


 |
市場調查報告書
商品編碼
1630343
北美風力發電:市場佔有率分析、產業趨勢與成長預測(2025-2030)North America Wind Power - Market Share Analysis, Industry Trends & Statistics, Growth Forecasts (2025 - 2030) |
||||||
價格
※ 本網頁內容可能與最新版本有所差異。詳細情況請與我們聯繫。
簡介目錄
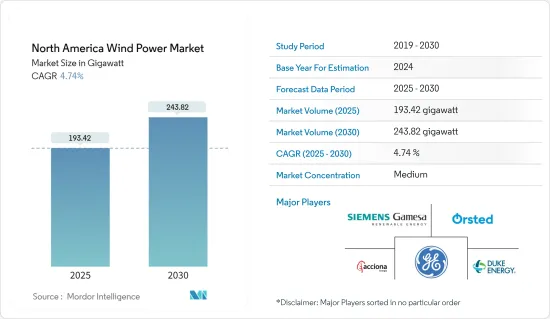
北美風電市場規模預計到2025年為193.42吉瓦,預計2030年將達到243.82吉瓦,預測期間(2025-2030年)複合年成長率為4.74%。
主要亮點
- 長期來看,市場成長的關鍵因素包括政府政策利多、風發電工程投資增加、風力發電成本下降,導致風力發電部署增加。
- 另一方面,擴大採用天然氣電力和太陽能等替代能源能源可能會阻礙該地區的市場成長。
- 儘管近期面臨挑戰,北美風電產業的陸上和離岸風力發電預計仍將強勁成長。產業專家預測,技術進步,特別是浮體式海上風電平台的進步,將釋放太平洋沿岸和大西洋深水區的巨大潛力。
- 美國擁有該地區最高的裝置容量,在陸上風力發電和即將推出的離岸風力發電計劃持續成長的支持下,預計在預測期內仍將是最大的市場。
北美風電市場趨勢
主導市場的土地領域
- 陸域風電是指安裝在陸地上的風力發電機利用自然氣流所產生的電力。它是北美發展最快的可再生能源技術之一。風力發電機對於未來的無碳能源產業也很重要,因為它們不會排放空氣或水污染物。
- 在過去五年中,陸上風電技術不斷發展,以最大限度地提高每兆瓦裝置容量的發電量,以覆蓋北美更多風速較低的地區。
- 例如,2023年,北美陸上風電裝置總量將總合172.29GW。美國有 147.979GW,加拿大有 16.989GW。這比2022年裝置容量164.215GW成長了4.92%。美國和加拿大較低的發電成本和增加的投資預計將鼓勵進一步安裝陸上風力發電機。
- 此外,美國2023年6月新增風電裝置650千萬瓦,投資108億美元。年內安裝的所有計劃均為陸上項目;沒有啟動海上計劃。此類措施可增加北美陸上風電的總裝置容量。
- 隨著對經濟實惠、清潔和多樣化電源的需求不斷成長,美國各地政府和公用事業公司正在考慮將風力發電作為可行的解決方案。此外,憑藉該地區獨特的風能資源,有充分的機會最大限度地發揮風力發電開發的經濟和環境效益。
- 2024年,北美陸域風力發電產業呈現復甦與擴張。根據美國能源局(DOE) 的一份新報告,通貨膨脹控制法案 (IRA) 顯著改善了近期風力發電部署預測。根據美國清潔電力協會(ACP)預測,到2024年第一季,美國陸上風電裝置容量將達到約2,530萬千瓦,與前一年同期比較增加超過50兆瓦。
- 未來四年,北美預計將新增6,000萬千瓦陸上風電裝置容量,其中92%將出現在美國,其餘8%將出現在加拿大。這種擴張可能源自於有利的措施、投資和技術進步。美國將引領新的陸上風電發電工程,並為可再生能源努力做出重大貢獻。這種成長支持向清潔能源的過渡和減少碳排放。
- 考慮到上述幾點和最近的發展,預計陸上產業將在預測期內主導北美風電市場。
美國主導市場
- 美國風電產業透過「美國優先」計劃獲得了政府的大力支持,該計劃旨在提高國內能源生產。由於該國擁有廣闊的沿海地區可供租賃,離岸風力發電領域被認為是重點發展領域。
- 2023年總設備容量為148,020兆瓦,比2022年的141,674兆瓦成長4.9%,佔北美風總設備容量的90%以上,排名第二。
- 此外,美國公用事業規模發電總量的約 10%(即 4,250 億度)來自 41 個州的風電發電工程。這段期間風電產量領先的五個州是德克薩斯州、愛荷華州、奧克拉荷馬州州、堪薩斯州和伊利諾州,這五個州合計約佔全國風電總產量的59%。
- 2023年,維斯塔斯向美國交付約210萬千瓦風力發電設備。此外,維斯塔斯訂單了新墨西哥州SunZia風電計劃1,089MW的契約,使其成為維斯塔斯全球最大的陸上計劃。維斯塔斯還為其美國供應鏈投入了 19 億美元,並與 1,200 多家供應商合作。這凸顯了美國在風力渦輪機和設備方面對維斯塔斯等國際公司的依賴,儘管國內風電產能不斷擴大。
- 2024年,Natixis企業與投資銀行向Invenergy提供了9億美元的綠色信用證。此次融資旨在支持美洲各地發電工程的發展。 Invenergy的可再生能源計劃規模超過30GW,風電企業也備受關注。此外,Natixis CIB還提供了12.7億美元,支持堪薩斯州和德克薩斯州677兆瓦的風能和太陽能發電設施。這項投資凸顯了我們致力於加強風力發電基礎設施的決心。
- 根據美國風力發電協會(AWEA)的數據,風電市場的風電裝置容量顯著成長。美國超過四分之一的風力發電能力位於德克薩斯州。
- 而且,根據能源部 (DOE) 的數據,離岸風電每年有潛力超過 2,000 吉瓦。此外,美國風力發電協會的相關人員表示,大約 700 億美元的離岸風力發電計劃正在進行中,預計將於 2030 年完工。
- 鑑於上述幾點和最近的發展,預計美國將在預測期內主導北美風電市場。
北美風電產業概況
北美風電市場較為分散。該市場的主要企業包括 Acciona Energia SA、Orsted AS、杜克能源公司、通用電氣公司和西門子歌美颯可再生能源公司。
其他好處
- Excel 格式的市場預測 (ME) 表
- 3 個月分析師支持
目錄
第1章簡介
- 調查範圍
- 市場定義
- 研究場所
第2章調查方法
第3章執行摘要
第4章市場概況
- 介紹
- 至2029年裝置容量及預測(單位:GW)
- 北美可再生能源結構,2023 年
- 2019-2023 年安裝的風力發電機數量
- 最新趨勢和發展
- 政府法規和措施
- 市場動態
- 促進因素
- 政府支持措施和獎勵
- 風力發電成本下降
- 抑制因素
- 越來越多採用天然氣和太陽能發電等替代能源
- 促進因素
- 供應鏈分析
- 波特五力分析
- 供應商的議價能力
- 消費者議價能力
- 新進入者的威脅
- 替代品的威脅
- 競爭公司之間的敵對關係
- 投資分析
第5章市場區隔
- 按位置
- 陸上
- 離岸
- 按地區
- 美國
- 加拿大
- 北美其他地區
第6章 競爭狀況
- 併購、合資、聯盟、協議
- 主要企業策略
- 公司簡介
- 風電場營運商
- Acciona Energia SA
- Orsted AS
- Duke Energy Corporation
- NextEra Energy Inc.
- Trident Winds Inc.
- E.ON SE
- EDF SA
- EnBW Energie Baden-Wurttemberg AG
- 設備供應商
- Envision Energy
- General Electric Company
- Siemens Gamesa Renewable Energy
- Vestas Wind Systems AS
- 風電場營運商
- 其他主要國家名單
- 市場排名分析
第7章 市場機會及未來趨勢
- 採用浮體式海上風電平台
簡介目錄
Product Code: 69531
The North America Wind Power Market size is estimated at 193.42 gigawatt in 2025, and is expected to reach 243.82 gigawatt by 2030, at a CAGR of 4.74% during the forecast period (2025-2030).
Key Highlights
- Over the long term, major factors attributing to the growth of the market include favorable government policies, the increasing investment in wind power projects, and the reduced cost of wind energy, which led to increased adoption of wind energy.
- On the other hand, the increasing adoption of alternate energy sources, such as gas-based power and solar power, is likely to hinder the market growth in the region.
- Nevertheless, despite potential short-term challenges, the North American wind energy power industry is projected to grow substantially, with both onshore and offshore wind installations. Industry experts anticipate that technological advances, particularly in floating offshore wind platforms, will unlock a vast potential along the Pacific coast and deeper Atlantic waters.
- The United States had the highest installed capacity in the region, and it is expected to be the largest market during the forecast period, bolstered by constant growth in onshore wind power additions and upcoming offshore wind power projects.
North America Wind Power Market Trends
Onshore Segment to Dominate the Market
- Onshore wind energy refers to the electricity produced by wind turbines situated on land, harnessing the natural flow of air. It is one of the fastest-growing renewable energy technologies in North America. It is also important for a future carbon-free energy industry because wind turbines do not release air or water pollutants.
- Over the last five years, onshore wind energy power generation technology has evolved to maximize electricity produced per megawatt capacity installed to cover more North American sites with lower wind speeds.
- For instance, in 2023, onshore wind energy installations in North America totaled 172.29 GW. The United States accounted for 147.979 GW, while Canada had 16.989 GW. This represented a 4.92% increase from 2022, when installations were at 164.215 GW. The decreasing cost of power generation and increased investments in the United States and Canada are expected to drive further onshore wind turbine installations.
- Moreover, in June 2023, the United States increased its wind power capacity by 6.5 GW, investing USD 10.8 billion. All projects installed during this year were onshore, as no offshore projects were initiated. This kind of initiative can boost North America's total onshore wind energy installations.
- With the increasing need for an affordable, clean, and diverse electricity supply, the government and utilities nationwide consider wind power a viable solution. Moreover, with the region's unparalleled wind resources, ample opportunities exist to maximize wind energy development's economic and environmental benefits.
- In 2024, the onshore wind energy industry in North America is demonstrating recovery and expansion. The latest reports from the US Department of Energy (DOE) suggest that the Inflation Reduction Act (IRA) has markedly improved projections for wind energy deployment in the near term. According to the American Clean Power Association (ACP), the land-based wind energy pipeline in the United States reached approximately 25.3 GW by the end of Q1 2024, marking an increase of over 5 GW compared to the previous year.
- In the next four years, North America is expected to add 60 GW of onshore wind capacity, with 92% of this growth occurring in the United States and the remaining 8% in Canada. This expansion may be driven by favorable policies, investments, and technological advancements. The United States will lead in new onshore wind projects, contributing significantly to renewable energy efforts. This growth supports the transition to cleaner energy and reduced carbon emissions.
- Owing to the above points and the recent developments, the onshore segment is expected to dominate the North American wind power market during the forecast period.
United States to Dominate the Market
- The US wind power industry is receiving immense support from the government due to the America First policy, which aims to boost domestic energy production. The offshore wind power sector is considered a major area of development, as the country has a large coastal area available for leasing.
- In 2023, the country had the second-largest total installed wind energy turbine capacity, with 148,020 MW, marking a 4.9% increase from the 141,674 MW installed in 2022, which accounted for over 90% of North America's total wind energy capacity.
- Additionally, approximately 10% of the total electricity generated at the utility-scale in the United States, equating to 425 billion kWh, was derived from wind energy projects across 41 states. The leading five states in terms of wind electricity generation during this period were Texas, Iowa, Oklahoma, Kansas, and Illinois, which together accounted for around 59% of the total wind electricity output in the country.
- In 2023, Vestas provided approximately 2.1 GW of wind capacity to the United States, representing the company's highest delivery volume in any nation during that year. Furthermore, Vestas obtained a substantial order of 1,089 MW for the SunZia Wind project located in New Mexico, which stands as the largest single onshore project worldwide for Vestas. The company also committed USD 1.9 billion to the US supply chain, collaborating with over 1,200 suppliers. This underscores the dependence of the United States on international firms such as Vestas for wind power turbines and equipment, even as domestic wind power generation capacity continues to expand.
- In 2024, Natixis Corporate & Investment Banking offered a Green Letter of Credit valued at USD 900 million to Invenergy. This loan is aimed at backing the growth of extensive wind energy projects throughout the Americas. Invenergy's collection of renewable energy projects spans more than 30 GW, featuring notable wind energy ventures. Furthermore, Natixis CIB has extended USD 1.27 billion in support for 677 MW of wind and solar facilities in Kansas and Texas. This investment underscores the dedication to enhancing wind energy infrastructure.
- According to the American Wind Energy Association (AWEA), the wind power market witnessed significant growth in the total installed wind power capacity, and the ongoing and dramatic onshore wind boom in Texas primarily drove this increase in capacity. More than a quarter of the total wind capacity of the United States is in Texas.
- Also, according to the Department of Energy (DOE), offshore wind has the potential to generate more than 2,000 GW of capacity per year. Adding to this, the American Wind Energy Association's officials have stated that around USD 70 billion of offshore wind power projects are in the pipeline and are expected to be completed by 2030.
- Owing to the above points and the recent developments, the United States is expected to dominate the North American wind power market during the forecast period.
North America Wind Power Industry Overview
The North American wind energy market is semi-fragmented. Some of the key players in the market include Acciona Energia SA, Orsted AS, Duke Energy Corporation, General Electric Company, and Siemens Gamesa Renewable Energy SA.
Additional Benefits:
- The market estimate (ME) sheet in Excel format
- 3 months of analyst support
TABLE OF CONTENTS
1 INTRODUCTION
- 1.1 Scope of the Study
- 1.2 Market Definition
- 1.3 Study Assumption
2 RESEARCH METHODOLOGY
3 EXECUTIVE SUMMARY
4 MARKET OVERVIEW
- 4.1 Introduction
- 4.2 Installed Capacity and Forecast in GW, until 2029
- 4.3 North America Renewable Energy Mix, 2023
- 4.4 Number of Wind Turbines Installed, 2019-2023
- 4.5 Recent Trends and Developments
- 4.6 Government Policies and Regulations
- 4.7 Market Dynamics
- 4.7.1 Drivers
- 4.7.1.1 Supportive Government Policies and Incentives
- 4.7.1.2 Declining Wind Energy Cost
- 4.7.2 Restraints
- 4.7.2.1 Increasing Adoption of Alternate Energy Sources, Such as Gas-based Power and Solar Power
- 4.7.1 Drivers
- 4.8 Supply Chain Analysis
- 4.9 Porter's Five Forces Analysis
- 4.9.1 Bargaining Power of Suppliers
- 4.9.2 Bargaining Power of Consumers
- 4.9.3 Threat of New Entrants
- 4.9.4 Threat of Substitutes Products and Services
- 4.9.5 Intensity of Competitive Rivalry
- 4.10 Invrestment Analysis
5 MARKET SEGMENTATION
- 5.1 By Location
- 5.1.1 Onshore
- 5.1.2 Offshore
- 5.2 By Geography
- 5.2.1 United States
- 5.2.2 Canada
- 5.2.3 Rest of North America
6 COMPETITIVE LANDSCAPE
- 6.1 Mergers and Acquisitions, Joint Ventures, Collaborations, and Agreements
- 6.2 Strategies Adopted by Leading Players
- 6.3 Company Profiles
- 6.3.1 Wind Farm Operators
- 6.3.1.1 Acciona Energia SA
- 6.3.1.2 Orsted AS
- 6.3.1.3 Duke Energy Corporation
- 6.3.1.4 NextEra Energy Inc.
- 6.3.1.5 Trident Winds Inc.
- 6.3.1.6 E.ON SE
- 6.3.1.7 EDF SA
- 6.3.1.8 EnBW Energie Baden-Wurttemberg AG
- 6.3.2 Equipment Suppliers
- 6.3.2.1 Envision Energy
- 6.3.2.2 General Electric Company
- 6.3.2.3 Siemens Gamesa Renewable Energy
- 6.3.2.4 Vestas Wind Systems AS
- 6.3.1 Wind Farm Operators
- 6.4 List of Other Prominent Countries
- 6.5 Market Ranking Analysis
7 MARKET OPPORTUNITIES AND FUTURE TRENDS
- 7.1 Adoption of Floating Offshore Wind Platforms
02-2729-4219
+886-2-2729-4219
 2026年全球風力發電市場報告
 日本風力發電市場:規模、佔有率、趨勢和預測:按地區分類,2026-2034年
 風力發電機速度放大器市場:依產品類型、級數、應用、最終用戶和銷售管道,全球預測,2026-2032年
 中東和非洲風力發電:市場佔有率分析、行業趨勢和統計數據、成長預測(2026-2031 年)
 無吊風力發電系統:全球市場佔有率和排名、總收入和需求預測(2025-2031 年)風電市場(按應用、渦輪機類型、渦輪機尺寸和組件)—2025-2032 年全球預測
 風電市場:產業趨勢及全球預測(截至 2035 年):按地點、組件、應用、風力渦輪機容量、投資類型、公司類型和地區劃分
 全球風力渦輪機市場
 2024-2040年歐盟氫動力卡車(H2 ICE)產業二氧化碳排放生命週期
 風電市場規模、佔有率、成長分析(按地點、按組件、按容量、按公司規模、按應用、按地區)-2025-2032 年產業預測
▼