


 |
市場調查報告書
商品編碼
2124310
智慧政府:市場佔有率分析、產業趨勢與統計、成長預測(2026-2031)Smart Government - Market Share Analysis, Industry Trends & Statistics, Growth Forecasts (2026 - 2031) |
||||||

※ 本網頁內容可能與最新版本有所差異。詳細情況請與我們聯繫。
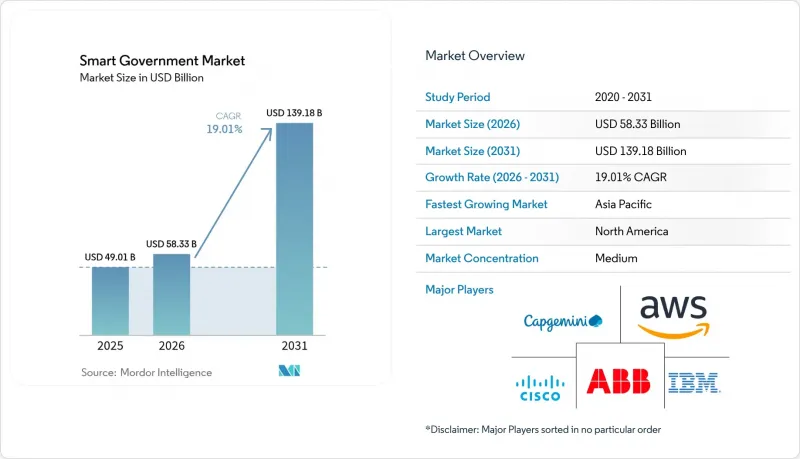
據 Mordor Intelligence 稱,2025 年智慧政府市場價值 490.1 億美元,預計將從 2026 年的 583.3 億美元成長到 2031 年的 1,391.8 億美元。
預測期(2026-2031 年)的複合年成長率預計為 19.01%。
本報告按元件(解決方案和服務)、部署模式(本地部署、雲端部署等)、應用程式(資源規劃(GRP/ERP)、公民參與平台等)、最終用戶層級(國家/聯邦、州/省)和地區進行分類。
全球智慧政府市場趨勢與洞察
政府推動數位轉型的舉措
目前,行政指導方針設定了嚴格的績效目標,這些目標超越了長期的採購週期,將轉型專案轉變為有時限、以合規為主導的專案。拜登總統的第14144號行政命令強制要求所有聯邦機構滿足人工智慧安全要求,從而鎖定了多年的軟體投資。阿拉伯聯合大公國(阿拉伯聯合大公國)的「數位政府戰略」旨在2025年實現100%的服務數位化和90%的滿意度,為全面的技術棧現代化樹立了全球標竿。地方政府也正在效仿這些框架,以保持互通性並滿足不斷提高的使用者體驗標準,而這些需求遠遠超出了最初的國家級指令。
擴大基於雲端的政府資訊技術的應用
向雲端遷移將資本支出轉化為可預測的營運成本,使各機構能夠利用企業級功能,並有可能降低 50% 至 60% 的營運成本。自 2016 年以來,美國聯邦政府的雲端預算增加了五倍,而新加坡陸路交通管理局在遷移後將運算成本降低了 60%。對舊有系統的鎖定仍然是一個令人擔憂的問題(英國在與根深蒂固的供應商重新談判時遇到的挑戰就凸顯了這一點),但能夠保證可移植性的平台正在獲得越來越多的關注,推動著雲端技術在所有服務層級的普及。
缺乏統一的資料共用方法
監管碎片化迫使供應商建構區域性系統,從而削弱了規模經濟效益並延緩了部署。歐盟新法規,例如DORA和NIS2,加重了合規負擔,許多組織對此準備不足。中國和俄羅斯的資料主權法規要求本地託管,這阻礙了全球解決方案的部署並增加了成本。
細分市場分析
預計到2031年,業務收益將以20.03%的複合年成長率成長,超過解決方案的成長速度。這凸顯了執行品質在決定智慧政府成功與否的關鍵作用。政府機構缺乏統籌複雜多供應商生態系統的人才,導致如今大多數競標中都包含了系統整合和託管服務包。服務的擴展與採購需求的趨勢相吻合,即優先考慮基於結果的里程碑,而非單一產品功能。因此,策略顧問公司正在活性化併購力度,以獲取政府科技領域的專業技術,而平台供應商則正在整合專業服務,以確保收入的持續成長。
即使到了2025年,解決方案仍將佔據智慧政府市場60.45%的佔有率,因為政府機構仍然將特定軟體與專案進度直接掛鉤。然而,合約模式正轉向捆綁式交付,服務成為價值實現時間保證的強大支撐。擁有持續交付框架和公共部門認證的供應商正逐漸獲得優勢,因為他們能夠有效緩解進度延誤——這在多年期專案中是一個長期存在的難題。這種轉變有利於能夠將轉型藍圖與政策要求相契合的端到端合作夥伴,而諮詢式服務正成為關鍵的差異化因素。
憑藉靈活的成本結構、付費使用制以及內建的合規工具等優勢,雲端模式預計到2025年將佔據智慧政府市場規模的66.30%。隨著公共雲端如今已達到甚至超越政府安全標準,其採用率正以20.65%的複合年成長率加速成長。混合雲策略作為過渡措施仍然有效,它使IT領導者能夠靈活地簡化傳統大型主機,同時將新的工作負載遷移到聯邦認證的區域。
成功指標顯示,政府雲端專案正逐步與私部門標準趨於一致。 63%的政府雲端專案已達到預期目標,縮小了與企業基準的差距。其餘未達標的項目更多是由於專案管理的複雜性而非平臺本身的限制,這表明通用操作手冊和熟練的整合商正在彌合成熟度差距。邊緣運算的應用案例,尤其是在遠端邊防安全和災害應變領域,顯示雲端正在從單一目的地演變為分散式連續體。
區域分析
北美地區一開始就佔據了37.70%的絕對佔有率,並持續投入大量聯邦和省級資源用於人工智慧、零信任安全和公民體驗的重塑。 1500億美元的人工智慧投資承諾將支撐全國內向演算法政策實施的轉變,而加州等州則正在展示生成式人工智慧在立法盡職實質審查中的有效性。加拿大的「數位野心」計畫正在加強雙語服務的平等性和全通路可及性,這表明聯邦制和多樣性正在影響該計畫的範圍。儘管支出能力雄厚,舊有系統仍延長了採購週期,促使各機構分階段進行現代化改造,重點是包含網路安全和持續交付升級的雲端服務合約。
亞太地區以21.05%的複合年成長率遙遙領先其他地區,並制定了全面的國家轉型藍圖。新加坡正在為其人工智慧卓越中心提供資金,印度正與Aadhaar合作擴展公共服務,越南則正利用公共和私人津貼投資其寬頻走廊。快速的都市化迫使市政府同時推動城市規劃、交通和環境監測的數位化,這為智慧政府市場採用模組化和可複製平台創造了有利環境。擁有敏捷交付模式的供應商能夠滿足這些緊迫的進度要求,而採用柔軟性永久授權模式的供應商的需求正在下降。
在歐洲,在布魯塞爾層級協調推動資料可攜性和安全性統一標準的支持下,各項工作正穩步推進。每個項目都利用了「InvestAI」基金提供的2000億歐元資金,該基金旨在幫助成員國協調採購計畫和技術架構。英國獨立「GOV.UK Wallet」的試點計畫表明,基於國家主權的戰略如何與歐洲各地的規範共存,並最終建立起對歐盟以外地區也具有重大影響的標準。儘管高合規要求提升了熟悉歐盟數位主權的本地供應商的作用,但擁有GDPR和DORA認證的非歐盟供應商仍然保持競爭力。
其他好處:
- Excel格式的市場預測(ME)表
- 3個月的分析師支持
目錄
第1章:引言
- 研究假設和市場定義
- 調查範圍
第2章:調查方法
第3章執行摘要
第4章 市場狀況
- 市場概覽
- 市場促進因素
- 政府推動數位轉型的舉措
- 擴大基於雲端的政府資訊技術的應用
- 人工智慧驅動的以公民為中心的分析
- 政府即平台採購模式
- 非接觸式生物識別程序
- 強制性氣候變遷調適能力監測
- 市場限制因素
- 缺乏統一的資料共用立法
- 對資料隱私和竊盜的擔憂
- 公部門的數位技能差距
- 與SaaS供應商有供應商鎖定風險
- 價值供應鏈分析
- 監理情勢
- 技術展望
- 波特五力模型
- 投資分析
- 新冠疫情的影響及宏觀經濟前景
第5章 市場規模與成長預測
- 按組件
- 解決方案
- 服務
- 按部署模式
- 現場
- 雲
- 混合
- 透過使用
- 資源規劃(GRP/ERP)
- 公共安全保障
- 公民參與平台
- 環境和基礎設施監測
- 智慧運輸和運輸
- 按最終用戶級別
- 國家/聯邦
- 按州/省
- 地方/市政
- 按地區
- 北美洲
- 美國
- 加拿大
- 墨西哥
- 南美洲
- 巴西
- 阿根廷
- 其他南美國家
- 歐洲
- 德國
- 英國
- 法國
- 義大利
- 西班牙
- 俄羅斯
- 其他歐洲國家
- 亞太地區
- 中國
- 日本
- 印度
- 韓國
- 其他亞太國家
- 中東
- 沙烏地阿拉伯
- 阿拉伯聯合大公國
- 土耳其
- 其他中東國家
- 非洲
- 南非
- 奈及利亞
- 埃及
- 其他非洲國家
- 北美洲
第6章 競爭情勢
- 市場集中度
- 策略趨勢
- 市佔率分析
- 公司簡介
- IBM
- Cisco Systems
- Amazon Web Services
- Oracle
- Huawei Technologies
- Capgemini
- ABB
- Microsoft
- Tyler Technologies
- Siemens
- SAP SE
- NEC Corporation
- Entrust
- HID Global(ASSA ABLOY)
- Nokia
- OpenGov
- Accenture
- Imex Systems
- Granicus
- GovPilot
第7章 市場機會與未來展望
According to Mordor Intelligence, the smart government market size was valued at USD 49.01 billion in 2025 and estimated to grow from USD 58.33 billion in 2026 to reach USD 139.18 billion by 2031, at a CAGR of 19.01% during the forecast period (2026-2031).
This report is Segmented by Component (Solutions and Services), Deployment Model (On-Premise, Cloud, and More), Application (Resource Planning (GRP/ERP), Citizen Engagement Platforms, and More), End-User Level (National/Federal, State/Provincial), and Geography.
Global Smart Government Market Trends and Insights
Government initiatives for digital transformation
Executive mandates now impose strict performance targets that override lengthy procurement cycles, turning transformation projects into time-boxed, compliance-driven programs. President Biden's Executive Order 14144 prescribes AI security requirements across all federal agencies, locking in multi-year software investments. The UAE's Digital Government Strategy aims for 100% service digitization and 90% satisfaction by 2025, setting a global benchmark for holistic stack modernization. Sub-national bodies replicate these frameworks to preserve interoperability and satisfy rising user-experience benchmarks, amplifying addressable demand well beyond the original sovereign mandates.
Growing adoption of cloud-based government IT
Cloud migration converts capital outlay into predictable operating expense, letting agencies unlock enterprise-grade capabilities and achieve 50%-60% cost savings on operations. U.S. federal cloud budgets have quintupled since 2016, while Singapore's Land Transport Authority trimmed compute costs by 60% post-migration. Although legacy lock-in remains a concern-highlighted by UK renegotiation challenges with entrenched vendors-platforms that guarantee portability win favor, pushing cloud penetration across every service tier.
Lack of uniform data-sharing laws
Fragmented regulations force vendors into jurisdiction-specific builds, undermining economies of scale and delaying rollouts. New EU rules, such as DORA and NIS2, raise compliance overhead that many agencies are unprepared to absorb. Data-sovereignty statutes in China and Russia compel local hosting, fracturing global solution footprints, and inflating costs.
Other drivers and restraints analyzed in the detailed report include:
- AI-driven citizen-centric analytics
- Government-as-a-Platform procurement model
- Data-privacy and cyber-theft concerns
For complete list of drivers and restraints, kindly check the Table Of Contents.
Segment Analysis
Services revenue expands at a 20.03% CAGR to 2031, eclipsing solution growth and underscoring that execution quality dictates Smart Government outcomes. Systems integration and managed services packages now accompany most bids because agencies lack the staff depth to orchestrate complex multi-vendor ecosystems. The Services rise parallels procurement language that values outcome-based milestones over discrete product features. Consequently, strategic consultancies increase M&A activity to secure niche GovTech expertise, while platform vendors embed professional services to lock in recurring revenue.
Solutions retain 60.45% of the Smart Government market in 2025 as governments still equate tangible software with project progress. However, contracts are shifting toward bundled offerings where services underpin time-to-value assurances. Providers with continuous-delivery frameworks and public-sector certifications gain an edge because they mitigate schedule slippage, a chronic pain point in multi-year programs. The change favors end-to-end partners capable of aligning transformation roadmaps with policy mandates, positioning consultative engagement as a critical differentiator.
Cloud models hold 66.30% share of the Smart Government market size in 2025 on the strength of elastic cost structures, pay-as-you-go pricing, and built-in compliance tooling. Adoption accelerates at a 20.65% CAGR because public cloud now meets or surpasses agency security baselines. Hybrid strategies persist as stepping-stones, giving IT leaders breathing space to rationalize legacy mainframes while steering new workloads into federally certified regions.
Success metrics reveal a convergence with private-sector norms: 63% of government cloud projects achieve stated objectives, narrowing the gap with enterprise benchmarks. Remaining shortfalls stem from project-management complexity rather than platform limitations, suggesting that common playbooks and skilled integrators are closing maturity gaps. Edge compute use cases, especially in remote border security and disaster response, illustrate that cloud is evolving into a distributed continuum, not a single destination.
Complete Report Scope:
- By Component
- Solutions
- Services
- By Deployment Model
- On-premise
- Cloud
- Hybrid
- By Application
- Resource Planning (GRP/ERP)
- Public Safety and Security
- Citizen Engagement Platforms
- Environmental and Infrastructure Monitoring
- Smart Mobility and Transport
- By End-user Level
- National/Federal
- State/Provincial
- Local/Municipal
- By Geography
- North America
- United States
- Canada
- Mexico
- South America
- Brazil
- Argentina
- Rest of South America
- Europe
- Germany
- United Kingdom
- France
- Italy
- Spain
- Russia
- Rest of Europe
- Asia Pacific
- China
- Japan
- India
- South Korea
- Rest of Asia Pacific
- Middle East
- Saudi Arabia
- United Arab Emirates
- Turkey
- Rest of Middle East
- Africa
- South Africa
- Nigeria
- Egypt
- Rest of Africa
- North America
Geography Analysis
North America starts with a dominant 37.70% stake and continues to funnel sizeable federal and state resources into artificial intelligence, zero-trust security, and citizen experience redesigns. The USD 150 billion AI investment pledge underpins a national shift toward algorithmic policy execution, while states such as California validate generative AI for legislative due-diligence tasks. Canada's Digital Ambition reinforces bilingual service parity and omnichannel accessibility, showing how federalism and diversity shape program scoping. Although spending capacity is unrivaled, entrenched legacy systems still elongate procurement cycles, nudging agencies toward phased modernization anchored by cloud service contracts that bake in cybersecurity and continuous-delivery upgrades.
Asia Pacific outpaces every other region with its 21.05% CAGR and expansive national transformation roadmaps. Singapore finances AI Centers of Excellence, India expands Aadhaar-linked public services, and Vietnam funnels public-private grants into broadband corridors. Rapid urbanization forces city governments to digitize planning, transport, and environmental monitoring almost in lockstep, making the Smart Government market ripe for modular, replicable platforms. Vendors with agile delivery frameworks meet these compressed timelines, whereas rigid perpetual-license models find fewer takers.
Europe enjoys steady momentum undergirded by Brussels-level coordination that drives uniform standards for data portability and security. Projects tap EUR 200 billion in InvestAI funds, prompting member states to synchronize procurement calendars and tech stacks. The UK's independent GOV.UK Wallet trials showcase how sovereign strategies can coexist with broader continental norms, ultimately setting references that echo well beyond the bloc. High compliance thresholds elevate the role of local vendors versed in EU digital sovereignty, though non-EU suppliers that certify against GDPR and DORA remain competitive.
- IBM
- Cisco Systems
- Amazon Web Services
- Oracle
- Huawei Technologies
- Capgemini
- ABB
- Microsoft
- Tyler Technologies
- Siemens
- SAP SE
- NEC Corporation
- Entrust
- HID Global (ASSA ABLOY)
- Nokia
- OpenGov
- Accenture
- Imex Systems
- Granicus
- GovPilot
Additional Benefits:
- The market estimate (ME) sheet in Excel format
- 3 months of analyst support
TABLE OF CONTENTS
1 INTRODUCTION
- 1.1 Study Assumptions and Market Definition
- 1.2 Scope of the Study
2 RESEARCH METHODOLOGY
3 EXECUTIVE SUMMARY
4 MARKET LANDSCAPE
- 4.1 Market Overview
- 4.2 Market Drivers
- 4.2.1 Government initiatives for digital transformation
- 4.2.2 Growing adoption of cloud-based government IT
- 4.2.3 AI-driven citizen-centric analytics
- 4.2.4 Government-as-a-Platform procurement model
- 4.2.5 Contact-free biometric identity programs
- 4.2.6 Climate-resilience monitoring mandates
- 4.3 Market Restraints
- 4.3.1 Lack of uniform data-sharing laws
- 4.3.2 Data-privacy and cyber-theft concerns
- 4.3.3 Public-sector digital-skills gap
- 4.3.4 SaaS vendor lock-in risk
- 4.4 Value / Supply-Chain Analysis
- 4.5 Regulatory Landscape
- 4.6 Technological Outlook
- 4.7 Porter's Five Forces
- 4.7.1 Bargaining Power of Suppliers
- 4.7.2 Bargaining Power of Buyers
- 4.7.3 Threat of New Entrants
- 4.7.4 Threat of Substitutes
- 4.7.5 Intensity of Competitive Rivalry
- 4.8 Investment Analysis
- 4.9 Impact of COVID-19 and Macroeconomic Outlook
5 MARKET SIZE AND GROWTH FORECASTS (VALUE)
- 5.1 By Component
- 5.1.1 Solutions
- 5.1.2 Services
- 5.2 By Deployment Model
- 5.2.1 On-premise
- 5.2.2 Cloud
- 5.2.3 Hybrid
- 5.3 By Application
- 5.3.1 Resource Planning (GRP/ERP)
- 5.3.2 Public Safety and Security
- 5.3.3 Citizen Engagement Platforms
- 5.3.4 Environmental and Infrastructure Monitoring
- 5.3.5 Smart Mobility and Transport
- 5.4 By End-user Level
- 5.4.1 National/Federal
- 5.4.2 State/Provincial
- 5.4.3 Local/Municipal
- 5.5 By Geography
- 5.5.1 North America
- 5.5.1.1 United States
- 5.5.1.2 Canada
- 5.5.1.3 Mexico
- 5.5.2 South America
- 5.5.2.1 Brazil
- 5.5.2.2 Argentina
- 5.5.2.3 Rest of South America
- 5.5.3 Europe
- 5.5.3.1 Germany
- 5.5.3.2 United Kingdom
- 5.5.3.3 France
- 5.5.3.4 Italy
- 5.5.3.5 Spain
- 5.5.3.6 Russia
- 5.5.3.7 Rest of Europe
- 5.5.4 Asia Pacific
- 5.5.4.1 China
- 5.5.4.2 Japan
- 5.5.4.3 India
- 5.5.4.4 South Korea
- 5.5.4.5 Rest of Asia Pacific
- 5.5.5 Middle East
- 5.5.5.1 Saudi Arabia
- 5.5.5.2 United Arab Emirates
- 5.5.5.3 Turkey
- 5.5.5.4 Rest of Middle East
- 5.5.6 Africa
- 5.5.6.1 South Africa
- 5.5.6.2 Nigeria
- 5.5.6.3 Egypt
- 5.5.6.4 Rest of Africa
- 5.5.1 North America
6 COMPETITIVE LANDSCAPE
- 6.1 Market Concentration
- 6.2 Strategic Moves
- 6.3 Market Share Analysis
- 6.4 Company Profiles (includes Global level Overview, Market level overview, Core Segments, Financials as available, Strategic Information, Market Rank/Share for key companies, Products and Services, and Recent Developments)
- 6.4.1 IBM
- 6.4.2 Cisco Systems
- 6.4.3 Amazon Web Services
- 6.4.4 Oracle
- 6.4.5 Huawei Technologies
- 6.4.6 Capgemini
- 6.4.7 ABB
- 6.4.8 Microsoft
- 6.4.9 Tyler Technologies
- 6.4.10 Siemens
- 6.4.11 SAP SE
- 6.4.12 NEC Corporation
- 6.4.13 Entrust
- 6.4.14 HID Global (ASSA ABLOY)
- 6.4.15 Nokia
- 6.4.16 OpenGov
- 6.4.17 Accenture
- 6.4.18 Imex Systems
- 6.4.19 Granicus
- 6.4.20 GovPilot
7 MARKET OPPORTUNITIES AND FUTURE OUTLOOK
- 7.1 White-space and Unmet-need Assessment

 智慧政府市場:按組件、技術、應用、部署模式和政府部門分類-2026-2032年全球市場預測
 2026年全球智慧政府市場報告
 全球智慧政府市場規模、佔有率、趨勢和成長分析報告(2026-2034)
 智慧政府市場-全球產業規模、佔有率、趨勢、機會、預測:按解決方案、服務、地區和競爭對手分類,2021-2031年智慧政府技術市場-全球產業規模、佔有率、趨勢、機會及預測(按解決方案、服務、部署、地區和競爭格局分類,2021-2031年)
 智慧政府市場規模、佔有率和成長分析(按組件、類型、部署模式和地區分類)-2026-2033年產業預測
 全球智慧政府市場規模研究與預測(依技術、應用、服務類型、最終用戶和區域預測,2025 年至 2035 年)