


 |
市場調查報告書
商品編碼
2124546
安全評估:市場佔有率分析、產業趨勢與統計、成長預測(2026-2031)Security Assessment - Market Share Analysis, Industry Trends & Statistics, Growth Forecasts (2026 - 2031) |
||||||

※ 本網頁內容可能與最新版本有所差異。詳細情況請與我們聯繫。
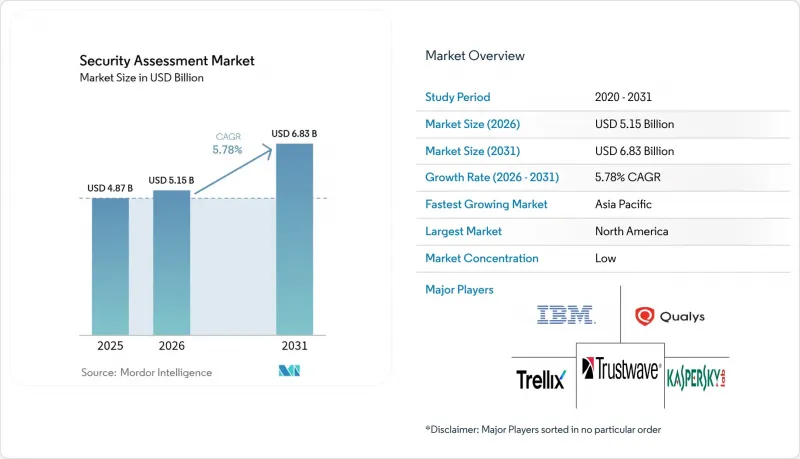
根據 Mordor Intelligence 預測,安全評估市場規模將從 2025 年的 48.7 億美元成長到 2026 年的 51.5 億美元,然後在 2031 年達到 68.3 億美元,2026 年至 2031 年的複合年成長率為 5.78%。
本報告按服務類型(漏洞評估、滲透測試等)、部署模式(本地部署、雲端部署)、組織規模(大型企業、中小企業)、最終用戶產業(IT與電信、銀行、金融服務和保險、零售與電子商務、醫療保健與生命科學等)以及地區進行細分。市場預測以美元計價。
全球安全評估市場趨勢與洞察
網路釣魚/惡意軟體攻擊的數量和複雜程度都在增加。
針對醫療機構的勒索軟體攻擊在18個月內激增137%,迫使各公司重新思考其評估方法,而不再局限於年度檢查清單。由於攻擊者會在補丁發布後的幾天內改變策略,各公司正在採用持續的入侵模擬來模擬攻擊者的行為,而不是靜態掃描。亞太地區在全球範圍內記錄了最長的平均“潛伏時間”,這暴露出響應方面的不足,需要專業的評估服務來填補。隨著客戶要求比常規漏洞掃描更貼近實際的檢驗,提供人工智慧驅動的威脅模擬和紅隊演練的服務提供者的訂單正在不斷成長。
監管合規義務現在也擴展到了中型企業。
《數位營運韌性法案》(Digital Operational Resilience Act)於2025年1月生效,該法案強制要求歐盟超過22,000家金融機構定期進行韌性測試,其適用範圍從大型銀行擴展到中型企業。在美國,監管機構已製定包含第三方風險管理計劃的基本韌性要求,這催生了區域性銀行對評估的新需求。提案的《健康保險流通與責任法案》(HIPAA)安全更新進一步強制要求採用多因素身份驗證和年度審計,預計第一年的合規成本將達到90億美元。這些不斷擴展的監管要求正將合規從「一次性」流程轉變為「持續性」流程,從而穩定服務需求。
中小企業領域的預算限制
儘管中小企業將約 4% 的收入用於安全保障,但它們的資料外洩率卻異常高,亞太地區 56% 的中小企業報告了安全事件,75% 的企業遭受了客戶資料遺失。全面的安全測試往往超出預算,迫使許多企業依賴基礎掃描器,導致威脅防護有漏洞。因此,雖然成本效益的考量限制了短期內的擴展,但自動化、訂閱式平台的創新(可降低部署成本)也在推動安全領域的進步。
細分市場分析
預計到2025年,漏洞評估將佔總收入的33.02%,凸顯其在合規計畫中的基礎性作用。同時,PTaaS預計將以7.18%的複合年成長率快速成長,反映出市場正向與DevOps相契合的持續檢驗轉變。許多公司正從年度穿透測試轉向月度或迭代式測試。 DORA和HIPAA的修訂正在穩步推動風險和合規性審計的普及。
隨著多重雲端環境的普及,對雲端配置評估的需求日益成長。將 API 整合到 CI/CD 管道中的供應商,透過以即時儀表板取代冗長的諮詢週期,正在建立永續的競爭優勢。人工智慧驅動的漏洞利用生成技術的普及,進一步促使買家更加重視速度而非人力成本。提供結合自動化檢測和分析師檢驗的混合模式的供應商,透過平衡效率和準確性,吸引了銀行、金融服務和保險 (BFSI) 以及醫療保健等風險規避型產業的注意。
對於某些金融和政府客戶而言至關重要的本地測試環境,在2025年佔總收入的51.65%。然而,預計到2031年,雲端交付的評估平台將實現7.97%的複合年成長率。彈性擴充性、遠端協作以及與雲端原生工作負載的整合是推動其普及的關鍵因素。 FedRAMP 20x藍圖表明,公共部門對持續雲端監控的需求日益成長,私人企業也紛紛效仿。多租戶SaaS評估可以降低客戶的基礎設施開銷並加快更新速度。
那些憑藉多重雲端可視性和開放API脫穎而出的供應商正在贏得長期合約。同時,隨著混合辦公和邊緣部署的擴展,純粹的本地部署工具面臨被淘汰的風險。在資料主權法規依然存在的地區,供應商擴大推出具有主權特性的SaaS區域,而不是採用硬性空氣間隙的設備,以留住受監管的客戶。
區域分析
北美地區預算充足,監管完善,預計2025年將佔全球收入的40.88%。 FedRAMP 20x以及聯邦政府提出的韌性標準正在推動聯邦政府和銀行業採用持續監控。加拿大正在使其資料外洩通知規則與美墨加協定(USMCA)夥伴國保持一致,而墨西哥的《2024年資料保護法》則增加了供應鏈對標準化評估的需求。
亞太地區是經濟成長的主要驅動力,預計2031年將以8.27%的複合年成長率成長。雲端運算的快速普及、電子商務的蓬勃發展以及地緣政治緊張局勢的加劇,都在推動該地區的支出成長。澳洲與微軟簽署的五年網路安全協議,以及日本以國防為重點的網路安全基礎設施擴張,都是資本投資的典型例證。該地區210萬人口的缺口以及網路攻擊持續時間的延長,促使企業對託管和自動化服務的需求不斷成長,以彌補勞動力短缺。尤其是中小企業,他們更傾向於選擇基於訂閱的測試平台,因為這些平台能夠幫助他們在無需大量資本投入的情況下解決安全漏洞。
在歐洲,嚴格的法律法規維持了市場規模的龐大。 DORA 針對數千家金融機構,而 NIS2 則擴大了公共產業和數位服務提供者的強制性安全措施範圍。該地區對資料主權的嚴格立場推動了評估中對本地化雲端節點和加密資料儲存的需求。英國的業務連續性法規與歐盟法規保持一致,簡化了跨國銀行的歐洲合規藍圖。
在拉丁美洲、中東和非洲,網路安全事件日益增加。隨著各國政府制定國家戰略,網路安全評估的應用正在迅速擴展,儘管仍處於早期階段。波灣合作理事會(GCC)成員國正在投資建造主權雲端區域,推動了該地區對網路安全評估的需求。在發生多起備受矚目的勒索軟體攻擊事件後,南美洲的電力公司正優先考慮對關鍵基礎設施進行審計。雖然預算限制了短期收入,但供應商與區域系統整合商之間的合作正在為中期擴張奠定基礎。
其他好處:
- Excel格式的市場預測(ME)表
- 3個月的分析師支持
目錄
第1章:引言
- 研究假設和市場定義
- 調查範圍
第2章:調查方法
第3章執行摘要
第4章 市場狀況
- 市場概覽
- 市場促進因素
- 網路釣魚和惡意軟體攻擊的增加和複雜性日益提高
- 監管合規要求正在擴展到中型企業市場(例如,DORA、OCC彈性規則)。
- 雲端遷移的激增推動了對持續安全檢驗的需求。
- 人工智慧驅動的自動化測試平台可降低成本並縮短週期時間。
- SaaS供應商對滲透測試即服務(PTaaS)的現狀
- 整合 DevSecOps 和左移安全測試
- 市場限制因素
- 中小企業領域的預算限制
- 熟練的紅隊/穿透測試人員短缺
- “工具激增導致的評估疲勞”和“警報過多”
- 對使用生成式人工智慧的評估引擎的準確性表示擔憂。
- 產業生態系分析
- 技術展望
- 波特五力分析
第5章 市場規模與成長預測
- 按服務類型
- 脆弱性評估
- 滲透測試
- 風險與合規審計
- 紅/紫隊模擬
- 雲端配置評估
- 按部署模式
- 現場
- 雲
- 按組織規模
- 大公司
- 中小企業
- 按最終用戶行業分類
- BFSI
- IT/通訊
- 醫療保健和生命科學
- 零售與電子商務
- 能源公用事業
- 政府/國防
- 其他(教育、媒體等)
- 按地區
- 北美洲
- 美國
- 加拿大
- 墨西哥
- 南美洲
- 巴西
- 阿根廷
- 其他南美國家
- 歐洲
- 德國
- 英國
- 法國
- 義大利
- 西班牙
- 荷蘭
- 俄羅斯
- 其他歐洲國家
- 亞太地區
- 中國
- 日本
- 印度
- 韓國
- 東南亞
- 澳洲和紐西蘭
- 其他亞太國家
- 中東和非洲
- 中東
- 沙烏地阿拉伯
- 阿拉伯聯合大公國
- 土耳其
- 其他中東國家
- 非洲
- 南非
- 奈及利亞
- 埃及
- 其他非洲國家
- 中東
- 北美洲
第6章 競爭情勢
- 市場集中度
- 策略趨勢
- 市佔率分析
- 公司簡介
- IBM Corporation
- Accenture PLC
- Cisco Systems Inc.
- Rapid7 Inc.
- Qualys Inc.
- Check Point Software Technologies Ltd.
- Trustwave(Singtel)
- Optiv Security Inc.
- Mandiant(Google Cloud)
- Secureworks Inc.
- Synopsys Inc.
- CrowdStrike Holdings Inc.
- Fortinet Inc.
- Palo Alto Networks Inc.
- Tenable Holdings Inc.
- Veracode
- Snyk Ltd.
- Absolute Software Corp.
- Holm Security
- Kaspersky Lab
- FireEye/Trellix
第7章 市場機會與未來展望
According to Mordor Intelligence, the security assessment market size is expected to grow from USD 4.87 billion in 2025 to USD 5.15 billion in 2026 and is forecast to reach USD 6.83 billion by 2031 at 5.78% CAGR over 2026-2031.
This report is Segmented by Service Type (Vulnerability Assessment, Penetration Testing, and More), Deployment Model (On-Premise, Cloud), Organization Size (Large Enterprises, Small and Medium-Sized Enterprises), End-User Vertical (IT and Telecom, BFSI, Retail and ECommerce, Healthcare and Lifesciences, and More), and Geography. The Market Forecasts are Provided in Terms of Value (USD).
Global Security Assessment Market Trends and Insights
Growing Volume and Sophistication of Phishing/Malware Attacks
Ransomware strikes on healthcare providers jumped 137% within 18 months, compelling firms to rethink assessment methods beyond annual checklists. Attackers now pivot tactics within days of patch releases, so enterprises are deploying continuous breach simulation that mirrors adversary behavior instead of static scans. Asia-Pacific records the highest median dwell times globally, exposing response gaps that specialized assessment services must close. Providers delivering AI-backed threat emulation and red-team exercises see rising engagement as clients demand realistic validation over routine vulnerability sweeps.
Regulatory Compliance Mandates Expanding to Mid-Market
The Digital Operational Resilience Act, live since January 2025, obliges more than 22,000 EU financial firms to run regular resilience testing, extending obligations from major banks to mid-tier entities. In the United States, regulators signal baseline resilience requirements that incorporate third-party risk programs, pushing fresh demand for assessment among regional banks. Proposed HIPAA security updates further require multi-factor authentication and yearly audits, projecting USD 9 billion first-year compliance costs. These broadening mandates stabilize service demand by transforming compliance from episodic to ongoing.
Budget Constraints in SMB Segment
Small firms devote near 4% of revenue to security yet face disproportionate breach rates, with 56% of Asia-Pacific SMEs reporting incidents and 75% suffering customer data loss. Full-spectrum testing often exceeds available budgets, pushing many toward basic scanners and leaving gaps in threat coverage. Affordability concerns therefore cap near-term expansion, but they also spur innovation in automated, subscription-priced platforms that lower delivery costs.
Other drivers and restraints analyzed in the detailed report include:
- Surging Cloud Migration Creating Demand for Continuous Validation
- AI-Enabled Automated Testing Platforms Lowering Cost and Cycle Time
- Shortage of Skilled Red-Team/Pentest Talent
For complete list of drivers and restraints, kindly check the Table Of Contents.
Segment Analysis
Vulnerability assessment held 33.02% of 2025 revenue, underscoring its foundational role in compliance programs. PTaaS, however, will scale fastest at 7.18% CAGR, mirroring a market pivot to ongoing validation aligned with DevOps. Many enterprises transition from yearly pentests to monthly or sprint-driven exercises. Risk and compliance audits sustain steady uptake thanks to DORA and HIPAA revisions.
Demand for cloud configuration assessment is rising as multi-cloud estates proliferate. Vendors embedding APIs into CI/CD pipelines create durable advantage, replacing lengthy consulting cycles with real-time dashboards. Mainstream adoption of AI-assisted exploit generation further shifts buyer expectations toward speed over labor hours. Providers offering hybrid models-automated discovery plus analyst validation-balance efficiency and accuracy, appealing to risk-averse sectors like BFSI and healthcare.
On-premise testing environments, mandatory for certain financial and government clients, delivered 51.65% revenue in 2025. Nonetheless, cloud-delivered assessment platforms will post an 7.97% CAGR to 2031. Elastic scale, remote collaboration, and integration with cloud-native workloads drive uptake. The FedRAMP 20x roadmap shows public-sector appetite for continuous cloud monitoring, and private enterprises follow suit. Multi-tenant SaaS assessment reduces infrastructure overhead for clients and accelerates updates.
Providers differentiating through multi-cloud visibility and API openness secure longer-term contracts. Conversely, purely on-premise tools risk obsolescence as hybrid workforces and edge deployments expand. Where data-sovereignty regulations persist, vendors increasingly position sovereign SaaS regions rather than hard-air-gapped appliances to retain regulated customers.
Complete Report Scope:
- By Service Type
- Vulnerability Assessment
- Penetration Testing
- Risk and Compliance Audit
- Red-/Purple-Team Simulation
- Cloud Configuration Assessment
- By Deployment Model
- On-Premise
- Cloud
- By Organization Size
- Large Enterprises
- Small and Medium-Sized Enterprises (SMEs)
- By End-user Industry
- BFSI
- IT and Telecom
- Healthcare and Life Sciences
- Retail and eCommerce
- Energy and Utilities
- Government and Defense
- Others (Education, Media, etc.)
- By Geography
- North America
- United States
- Canada
- Mexico
- South America
- Brazil
- Argentina
- Rest of South America
- Europe
- Germany
- United Kingdom
- France
- Italy
- Spain
- Netherlands
- Russia
- Rest of Europe
- Asia-Pacific
- China
- Japan
- India
- South Korea
- South East Asia
- Australia and New Zealand
- Rest of Asia-Pacific
- Middle East and Africa
- Middle East
- Saudi Arabia
- United Arab Emirates
- Turkey
- Rest of Middle East
- Africa
- South Africa
- Nigeria
- Egypt
- Rest of Africa
- Middle East
- North America
Geography Analysis
North America produced 40.88% of 2025 revenue owing to deep budgets and far-reaching regulations. FedRAMP 20x and potential federal resilience baselines spur federal and banking sectors to adopt continuous monitoring. Canada aligns breach-notification rules with its USMCA partners, while Mexico's 2024 data-protection statute elevates demand for standardized assessment across supply chains.
Asia-Pacific is the growth engine with an 8.27% CAGR through 2031. Rapid cloud adoption, e-commerce expansion, and heightened geopolitical tensions lift spending. Australia's five-year cybersecurity accord with Microsoft and Japan's defense-oriented cyber build-out illustrate capital infusion. The region's 2.1 million talent gap and prolonged dwell times create appetite for managed and automated services that offset staffing deficits. SMEs particularly favor subscription-delivered testing platforms to close exposure gaps without heavy capex.
Europe remains sizable through sweeping legislation. DORA reaches thousands of financial entities, while NIS2 widens compulsory security controls across utilities and digital providers. The region's strict data-sovereignty stance directs demand toward localized cloud nodes and encrypted data storage within assessments. United Kingdom operational-resilience rules converge with EU statutes, simplifying pan-European compliance roadmaps for multinational banks.
Latin America, Middle East, and Africa show nascent yet accelerating uptake as cyber incidents escalate and governments draft national strategies. Gulf Cooperation Council states invest in sovereign cloud zones, driving local assessment demand. South American power utilities prioritize critical-infrastructure audits following headline ransomware incidents. Budget limitations still temper immediate revenue, but vendor partnerships with regional integrators lay groundwork for mid-term expansion.
- IBM Corporation
- Accenture PLC
- Cisco Systems Inc.
- Rapid7 Inc.
- Qualys Inc.
- Check Point Software Technologies Ltd.
- Trustwave (Singtel)
- Optiv Security Inc.
- Mandiant (Google Cloud)
- Secureworks Inc.
- Synopsys Inc.
- CrowdStrike Holdings Inc.
- Fortinet Inc.
- Palo Alto Networks Inc.
- Tenable Holdings Inc.
- Veracode
- Snyk Ltd.
- Absolute Software Corp.
- Holm Security
- Kaspersky Lab
- FireEye/Trellix
Additional Benefits:
- The market estimate (ME) sheet in Excel format
- 3 months of analyst support
TABLE OF CONTENTS
1 INTRODUCTION
- 1.1 Study Assumptions and Market Definition
- 1.2 Scope of the Study
2 RESEARCH METHODOLOGY
3 EXECUTIVE SUMMARY
4 MARKET LANDSCAPE
- 4.1 Market Overview
- 4.2 Market Drivers
- 4.2.1 Growing volume and sophistication of phishing/malware attacks
- 4.2.2 Regulatory compliance mandates expanding to mid-market (e.g., DORA, OCC resilience rules)
- 4.2.3 Surging cloud migration driving continuous security validation demand
- 4.2.4 AI-enabled automated testing platforms lowering cost and cycle time
- 4.2.5 Pen-Testing-as-a-Service (PTaaS) adoption among SaaS vendors
- 4.2.6 Convergence of DevSecOps and shift-left security testing
- 4.3 Market Restraints
- 4.3.1 Budget constraints in SMB segment
- 4.3.2 Shortage of skilled red-team/pentest talent
- 4.3.3 Tool sprawl leading to assessment fatigue" and alert overload"
- 4.3.4 Accuracy concerns around Gen-AI-driven assessment engines
- 4.4 Industry Ecosystem Analysis
- 4.5 Technological Outlook
- 4.6 Porter's Five Forces Analysis
- 4.6.1 Threat of New Entrants
- 4.6.2 Bargaining Power of Buyers
- 4.6.3 Bargaining Power of Suppliers
- 4.6.4 Threat of Substitutes
- 4.6.5 Intensity of Competitive Rivalry
5 MARKET SIZE AND GROWTH FORECASTS (VALUES)
- 5.1 By Service Type
- 5.1.1 Vulnerability Assessment
- 5.1.2 Penetration Testing
- 5.1.3 Risk and Compliance Audit
- 5.1.4 Red-/Purple-Team Simulation
- 5.1.5 Cloud Configuration Assessment
- 5.2 By Deployment Model
- 5.2.1 On-Premise
- 5.2.2 Cloud
- 5.3 By Organization Size
- 5.3.1 Large Enterprises
- 5.3.2 Small and Medium-Sized Enterprises (SMEs)
- 5.4 By End-user Industry
- 5.4.1 BFSI
- 5.4.2 IT and Telecom
- 5.4.3 Healthcare and Life Sciences
- 5.4.4 Retail and eCommerce
- 5.4.5 Energy and Utilities
- 5.4.6 Government and Defense
- 5.4.7 Others (Education, Media, etc.)
- 5.5 By Geography
- 5.5.1 North America
- 5.5.1.1 United States
- 5.5.1.2 Canada
- 5.5.1.3 Mexico
- 5.5.2 South America
- 5.5.2.1 Brazil
- 5.5.2.2 Argentina
- 5.5.2.3 Rest of South America
- 5.5.3 Europe
- 5.5.3.1 Germany
- 5.5.3.2 United Kingdom
- 5.5.3.3 France
- 5.5.3.4 Italy
- 5.5.3.5 Spain
- 5.5.3.6 Netherlands
- 5.5.3.7 Russia
- 5.5.3.8 Rest of Europe
- 5.5.4 Asia-Pacific
- 5.5.4.1 China
- 5.5.4.2 Japan
- 5.5.4.3 India
- 5.5.4.4 South Korea
- 5.5.4.5 South East Asia
- 5.5.4.6 Australia and New Zealand
- 5.5.4.7 Rest of Asia-Pacific
- 5.5.5 Middle East and Africa
- 5.5.5.1 Middle East
- 5.5.5.1.1 Saudi Arabia
- 5.5.5.1.2 United Arab Emirates
- 5.5.5.1.3 Turkey
- 5.5.5.1.4 Rest of Middle East
- 5.5.5.2 Africa
- 5.5.5.2.1 South Africa
- 5.5.5.2.2 Nigeria
- 5.5.5.2.3 Egypt
- 5.5.5.2.4 Rest of Africa
- 5.5.5.1 Middle East
- 5.5.1 North America
6 COMPETITIVE LANDSCAPE
- 6.1 Market Concentration
- 6.2 Strategic Moves
- 6.3 Market Share Analysis
- 6.4 Company Profiles (includes Global level Overview, Market level overview, Core Segments, Financials as available, Strategic Information, Market Rank/Share, Products and Services, Recent Developments)
- 6.4.1 IBM Corporation
- 6.4.2 Accenture PLC
- 6.4.3 Cisco Systems Inc.
- 6.4.4 Rapid7 Inc.
- 6.4.5 Qualys Inc.
- 6.4.6 Check Point Software Technologies Ltd.
- 6.4.7 Trustwave (Singtel)
- 6.4.8 Optiv Security Inc.
- 6.4.9 Mandiant (Google Cloud)
- 6.4.10 Secureworks Inc.
- 6.4.11 Synopsys Inc.
- 6.4.12 CrowdStrike Holdings Inc.
- 6.4.13 Fortinet Inc.
- 6.4.14 Palo Alto Networks Inc.
- 6.4.15 Tenable Holdings Inc.
- 6.4.16 Veracode
- 6.4.17 Snyk Ltd.
- 6.4.18 Absolute Software Corp.
- 6.4.19 Holm Security
- 6.4.20 Kaspersky Lab
- 6.4.21 FireEye/Trellix
7 MARKET OPPORTUNITIES AND FUTURE OUTLOOK
- 7.1 White-space and Unmet-need Assessment

 消費者安全:市場佔有率分析、產業趨勢與統計及成長預測(2026-2031 年)
 2026-2030年全球安全領域人工智慧市場
 企業安全客戶回饋調查:數據亮點
 安全評估市場:依服務類型、組織規模、部署模式、最終用戶、國家及地區分類-全球產業分析、市場規模、市場佔有率及2026年至2033年預測
 安全市場規模、佔有率、趨勢和預測:按系統、服務、最終用戶和地區分類,2026-2034 年
 預測性安全市場-全球產業規模、佔有率、趨勢、機會與預測:按產業、部署模式、企業規模、威脅類型、技術、地區和競爭格局分類,2021-2031年安全設備市場報告:按類型、部署模式、最終用戶、產業和地區分類(2026-2034 年)
 安全領域人工智慧 (AI) 市場規模、佔有率和成長分析:按組件、部署模式、最終用戶和地區分類——2026-2033 年行業預測
 2026年全球安防市場報告2026年全球醫療資訊科技(IT)安全市場報告