


 |
市場調查報告書
商品編碼
1644271
地下公共事業測繪:市場佔有率分析、產業趨勢與統計、成長預測(2025-2030 年)Underground Utility Mapping - Market Share Analysis, Industry Trends & Statistics, Growth Forecasts (2025 - 2030) |
||||||
※ 本網頁內容可能與最新版本有所差異。詳細情況請與我們聯繫。
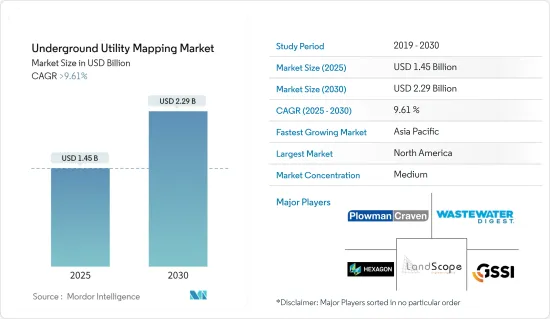
地下公共事業測繪市場規模預計在 2025 年將達到 14.5 億美元,預計到 2030 年將達到 22.9 億美元,預測期內(2025-2030 年)的複合年成長率將超過 9.61%。
推動地下公共事業測繪市場發展的兩個主要因素是經濟活動的活性化(尤其是在新興市場)以及政府維護地下公用設施的措施增加。
主要亮點
- 近年來,地下公共事業工程 (SUE) 產業一直走在前沿,為地下公共事業基礎設施測繪挑戰創造了創新解決方案。透過將電磁定位器和透地雷達等地球物理技術與歷史記錄等非技術方法相結合,該行業可以彙編地下基礎設施的綜合資料集。
- 此外,世界經濟論壇(WEF)預測,到2030年,全球對城市灰色基礎設施的投資將激增至10,5,480億美元。如此巨大的城市發展投資為地下公共事業測繪市場提供了巨大的成長機會。
- 隨著都市化進程的加速,全球智慧城市趨勢也愈發強勁。聯合國預測,到2050年,印度城市人口將增加4.04億,中國將增加2.92億,奈及利亞將增加2.12億。
- 同時,新興大陸拉丁美洲的都市化最為迅速。全球各地眾多智慧城市計劃如火如荼地進行,國際投資也不斷湧入。經濟合作暨發展組織(OECD)估計,2010年至2030年間,全球對智慧城市計畫(包括所有主要城市基礎設施計劃)的投資將達到近1.8兆美元。智慧城市發展的激增將增加地下公共事業地圖市場的需求。
- 基礎設施規劃在城市發展中常常被忽視,但對於複雜設施的無縫運作至關重要。這項工作中的一個重要工具是 3D公共事業地圖,它可以提供一個區域及其公共事業的3D觀點。該方法可以捕獲地下資料,例如用水和污水和煤氣管道以及結構圖和電線。借助詳細的 3D公共事業地圖和概念場地模型 (CSM),規劃人員可以快速識別挑戰並設計出有效的解決方案。
- 透過將新技術與公共事業地圖結合,地下公共事業地圖市場正在轉變。這些進展將提高探勘活動的準確性、效率和安全性。因此,探勘團隊能夠更好地應對與地下基礎設施相關的挑戰,簡化路線並降低風險,從而推動市場成長並激發創新。
- 透地雷達(GPR) 非常適合精確定位目標的水平位置,但各種因素都會影響深度測量的速度和準確性。土壤類型和水分含量極為重要。例如,沙土和粘土等難以處理的土壤會減慢雷達訊號。潮濕的材料進一步影響訊號速度。因此,確定不同材料中 GPR 訊號的確切速度是一項挑戰,但估計的準確度通常在 90% 左右。
地下公共事業測繪市場趨勢
透地雷達有望成為最大的組件解決方案
- 透地雷達(GPR) 是公共事業測繪的最佳選擇,它發射 MHz 和 GHz 範圍內的定向電磁波。透過分析這些訊號回波,GPR 可以精確定位地下公共事業基礎設施的位置。
- GPR 技術擅長識別金屬和非金屬公共事業。快速的資料收集、經濟高效和高解析度影像使其成為公共事業測量員進行公共事業測繪調查的首選。
- 除了公共事業測繪之外,GPR 還可以作為評估水泥建築物的非破壞性工具,揭示鋼筋位置、板厚度以及空隙和管道的存在。這種非侵入性方法不僅可以確保準確的結果,而且還最大限度地減少對正在進行的施工計劃的干擾。
- 為了前瞻性起見,無人機製造商正在生產具有 GPR 功能的無人機,以便更好地探測地下公共,這預示著一個蓬勃發展的市場機會。
- 隨著天然氣管道的擴大,精確測繪和監測的需求也隨之增加。地面穿透技術在定位、識別和評估管道狀況以及保護周圍環境方面發揮著至關重要的作用。截至 2024 年 2 月,GGON資料突顯了中國在全球天然氣管道中的主導地位。目前,中國管道網路已運作中442 條管道,另有 302 條規劃或正在建設中,為全球 1,500 多條運作中天然氣管道做出了重要貢獻。
北美佔有最大市場佔有率
- 北美快速的都市化和人口成長給現有的基礎設施系統帶來了壓力,增加了對地下公共事業測繪服務的需求。都市區複雜且密集,需要精確測繪以防止施工期間損壞地下設施。
- 根據國家地下資產登記諮詢小組的報告,定位地下資產的挑戰每年對美國經濟造成約 500 億美元的損失。在過去 20 年裡,該問題還導致 1,500 多人受傷,近 400 人死亡。此外,地下公共事業測繪不準確也是造成高速公路建設延誤的重要原因。這些不確定性正在推動該地區採用基於先進技術的解決方案。
- 北美許多城市和市政當局正在投資智慧城市計畫。這些措施旨在利用科技更好地管理基礎設施,增強公共服務並最佳化資源配置。其中,地下公共事業測繪發揮著至關重要的作用,為基礎設施資產管理和規劃提供重要資料。
- 該地區正在努力開發有關地下公用設施的資料共用方法,特別是在施工期間捕獲的資料。一個值得注意的例子是芝加哥市的試點項目,該項目引入了 3D 地鐵地圖的資料收集和共用平台。
- 區域參與者擴大採用無機成長策略來搶佔更大的市場佔有率,從而進一步推動該領域的成長。此外,該地區的許多公共工程部門正在使用 GIS 技術來幫助定位地下設施。
地下公共事業測繪產業概況
地下公共事業測繪市場呈現半固體,其特點是大型跨國公司和許多小型企業共存。影響市場的關鍵參與者是 Hexagon AB、GSSI Geophysical Survey Systems Inc.、LandScope Engineering Ltd.、Plowman Craven Limited、Geospatial Corporation 等。這些參與者正在策略性地利用夥伴關係和收購來增強其產品供應並確保競爭優勢。
例如,2024年4月,地下埋藏物損害防治知名公司USIC,LLC(以下簡稱「USIC」)與美國「合作夥伴助力您的成功」(PaYS)計畫正式達成合作關係。該舉措為美國軍人提供了報效祖國的機會,同時也為他們退休後的職業生涯做好了準備。夥伴關係簽約儀式在USIC總部舉行,活動由印第安納州陸軍國民警衛隊新兵保留營主辦。作為經過認證的 PaYS 合作夥伴,USIC 致力於為士兵在陸軍服役期滿後提供面試和就業機會。這項戰略夥伴關係不僅有利於士兵順利過渡到平民生活,也凸顯了美國致力於與企業界建立牢固關係的決心。
其他福利:
- Excel 格式的市場預測 (ME) 表
- 3 個月的分析師支持
目錄
第 1 章 簡介
- 研究假設和市場定義
- 研究範圍
第2章調查方法
第3章執行摘要
第4章 市場洞察
- 市場概況
- 產業吸引力-波特五力分析
- 新進入者的威脅
- 購買者/消費者的議價能力
- 供應商的議價能力
- 替代品的威脅
- 競爭對手之間的競爭
第5章 市場動態
- 市場促進因素
- 新技術與公共事業地圖相結合以改善探勘活動
- 提高發現應用程式的可用性並提高行銷支出的回報
- 市場挑戰
- 測繪工具維護成本高
6. COVID-19 對地下公共事業測繪市場的影響
第7章 市場區隔
- 按組件類型
- 解決方案
- 透地雷達
- 電磁定位器
- 其他解決方案
- 服務
- 解決方案
- 按最終用戶產業
- 公共
- 石油和天然氣
- 建築和施工
- 通訊業
- 電
- 其他最終用戶產業
- 按地區
- 北美洲
- 歐洲
- 亞洲
- 澳洲和紐西蘭
- 拉丁美洲
- 中東和非洲
第8章 競爭格局
- 公司簡介
- Hexagon AB
- GSSI Geophysical Survey Systems Inc.
- Landscope Engineering Ltd
- Plowman Craven Limited
- Geospatial Corporation
- Vivax-Metrotech Corp.
- Maverick Inspection Ltd
- Red Laser Scanning
- Technics Group
- multiVIEW Locates Inc.
第9章投資分析
第10章:市場的未來
The Underground Utility Mapping Market size is estimated at USD 1.45 billion in 2025, and is expected to reach USD 2.29 billion by 2030, at a CAGR of greater than 9.61% during the forecast period (2025-2030).
Two primary factors are propelling the underground utility mapping market: heightened economic activities, especially in developing nations, and increasing government initiatives aimed at maintaining these underground utilities.
Key Highlights
- In recent years, the subsurface utility engineering (SUE) industry has been at the forefront, crafting innovative solutions to the challenges of mapping underground utility infrastructures. By melding geophysical technologies, such as electromagnetic locators and ground-penetrating radars, with non-technical methods like historical records, the industry is able to amass a comprehensive dataset of subsurface infrastructures.
- Moreover, the World Economic Forum anticipates that global investments in urban grey infrastructure will skyrocket to USD 10,548 billion by 2030. Such monumental urban development investments herald a significant growth opportunity for the underground utility mapping market.
- As urbanization accelerates, the global trend of smart cities is gaining traction. The United Nations projects that by 2050, urban populations will swell by 404 million in India, 292 million in China, and 212 million in Nigeria.
- Meanwhile, Latin America, an emerging continent, is experiencing the swiftest urbanization. With numerous global smart city projects in motion, international investments are pouring in. The Organization for Economic Cooperation and Development (OECD) estimates that from 2010 to 2030, global investments in smart city initiatives will near USD 1.8 trillion, encompassing all metropolitan infrastructure projects. This surge in smart city developments is set to amplify demand in the underground utility mapping market.
- Infrastructure planning, often sidelined in urban development, is vital for the seamless operation of complex facilities. A pivotal tool in this endeavor is 3D utility mapping, which provides a three-dimensional perspective of an area and its utilities. This method captures subsurface data, encompassing water, sewer, and gas lines, alongside structural maps and electrical wiring. Armed with a detailed 3D utility map and a Conceptual Site Model (CSM), planners can swiftly pinpoint challenges and devise effective solutions.
- By merging emerging technologies with utility maps, the underground utility mapping market is undergoing a transformation. These advancements bolster the accuracy, efficiency, and safety of exploration activities. Consequently, exploration teams can adeptly navigate challenges tied to underground infrastructure, streamline their routes, and mitigate risks, driving the market's growth and fostering innovation.
- While Ground Penetrating Radar (GPR) excels at pinpointing the horizontal locations of targets, various factors can sway the speed and precision of depth measurements. Soil type and moisture content are pivotal. For instance, radar signals slow down in challenging soils like sand and clay. Moisture-rich materials further influence signal speed. Thus, while pinpointing the exact speed of GPR signals across different materials poses challenges, estimates generally hover around 90% accuracy.
Underground Utility Mapping Market Trends
Ground Penetrating Radar is Expected to be the Largest Component Type Solution
- Ground-penetrating radar (GPR) stands out as the premier choice for utility mapping, emitting directional electromagnetic waves in the MHz and GHz range. By analyzing the return of these signals, GPR accurately pinpoints the location of underground utility infrastructure.
- GPR technology is notably adept at identifying both metallic and nonmetallic utilities. Utility surveyors favor GPR for its swift data acquisition, cost-effectiveness, and high-resolution imagery in utility mapping surveys.
- Beyond utility mapping, GPR serves as a non-destructive tool for evaluating concrete structures, revealing insights on rebar placements, slab thickness, and the presence of voids or conduits. This non-invasive approach not only ensures precise results but also minimizes disruptions to ongoing construction projects.
- In a forward-looking move, drone manufacturers are crafting GPR-enabled drones, hinting at a burgeoning market opportunity as they become poised to detect underground utilities.
- With the expansion of natural gas pipelines, the demand for precise mapping and monitoring intensifies. Ground penetration techniques play a pivotal role in locating, identifying, and evaluating pipeline conditions, all while safeguarding the surrounding environment. As of February 2024, data from GGON highlights China's dominance in the global gas pipeline landscape. Boasting 442 operational pipelines and an additional 302 either proposed or under construction, China's network is a significant contributor to the global tally of over 1,500 operational gas pipelines.
North America Holds Largest Market Share
- In North America, rapid urbanization and population growth are straining existing infrastructure systems, leading to a heightened demand for underground utility mapping services. The complexity and density of urban areas necessitate precise mapping to prevent damage to underground utilities during construction.
- The National Underground Asset Registry Advisory Group reports that the challenge of locating underground utilities costs the U.S. economy approximately USD 50 billion annually. This issue has also led to over 1,500 injuries and nearly 400 fatalities in the past two decades. Furthermore, inaccuracies in underground utility mapping contribute significantly to delays in highway construction. Such uncertainties are driving the adoption of advanced technology-based solutions in the region.
- Numerous cities and municipalities across North America are channeling investments into smart city initiatives. These efforts aim to harness technology for better infrastructure management, enhanced public services, and optimized resource allocation. Within this context, underground utility mapping plays a pivotal role, offering vital data for infrastructural asset management and planning.
- Efforts are underway in the region to develop methods for sharing data on underground utilities, especially those captured during construction. A notable example is the City of Chicago's pilot program, which aims to deploy a platform for data collection and sharing a 3D map of the subway.
- Regional players are increasingly adopting inorganic growth strategies to capture larger market shares, further propelling the segment's growth. Additionally, many public works departments in the region are utilizing GIS technology to pinpoint the locations of underground utilities.
Underground Utility Mapping Industry Overview
The underground utility mapping market features a semi-consolidated landscape, characterized by the coexistence of global giants and a multitude of small to medium-sized enterprises. Key players shaping the market include Hexagon AB, GSSI Geophysical Survey Systems Inc., LandScope Engineering Ltd, Plowman Craven Limited, and Geospatial Corporation. These players are strategically leveraging partnerships and acquisitions to bolster their product offerings and secure a competitive edge.
For example, in April 2024, USIC, LLC ("USIC"), a prominent player in underground utility damage prevention, forged an official partnership with the U.S. Army's Partnership for Your Success (PaYS) Program. This initiative provides American soldiers with opportunities to serve their country while simultaneously preparing for their post-service careers. The partnership was ceremoniously signed at USIC's corporate headquarters, with the event being hosted by the Indiana Army National Guard Recruiting and Retention Battalion. As a recognized PaYS Partner, USIC pledges to offer soldiers an interview and a shot at employment once they conclude their Army tenure. This strategic alliance not only facilitates a smoother transition for soldiers into civilian life but also underscores the US Army's dedication to nurturing strong relationships with the corporate sector.
Additional Benefits:
- The market estimate (ME) sheet in Excel format
- 3 months of analyst support
TABLE OF CONTENTS
1 INTRODUCTION
- 1.1 Study Assumptions and Market Definition
- 1.2 Scope of the Study
2 RESEARCH METHODOLOGY
3 EXECUTIVE SUMMARY
4 MARKET INSIGHTS
- 4.1 Market Overview
- 4.2 Industry Attractiveness - Porter's Five Forces Analysis
- 4.2.1 Threat of New Entrants
- 4.2.2 Bargaining Power of Buyers/Consumers
- 4.2.3 Bargaining Power of Suppliers
- 4.2.4 Threat of Substitute Products
- 4.2.5 Intensity of Competitive Rivalry
5 MARKET DYNAMICS
- 5.1 Market Drivers
- 5.1.1 Emerging Technologies Combined With Utility Maps to Improve the Exploration Activities
- 5.1.2 Increasing Availability of Detecting Applications and Increased Return on Marketing Spending
- 5.2 Market Challenges
- 5.2.1 Significantly High Maintenance Costs of Mapping Tools
6 IMPACT OF COVID-19 ON THE UNDERGROUND UTILITY MAPPING MARKET
7 MARKET SEGMENTATION
- 7.1 By Component Type
- 7.1.1 Solutions
- 7.1.1.1 Ground Penetrating Radar
- 7.1.1.2 Electromagnetic Locators
- 7.1.1.3 Other Solutions
- 7.1.2 Services
- 7.1.1 Solutions
- 7.2 By End-user Industry
- 7.2.1 Public Safety
- 7.2.2 Oil and Gas
- 7.2.3 Building and Construction
- 7.2.4 Telecommunication
- 7.2.5 Electricity
- 7.2.6 Other End-user Industries
- 7.3 By Geography
- 7.3.1 North America
- 7.3.2 Europe
- 7.3.3 Asia
- 7.3.4 Australia and New Zealand
- 7.3.5 Latin America
- 7.3.6 Middle East and Africa
8 COMPETITIVE LANDSCAPE
- 8.1 Company Profiles
- 8.1.1 Hexagon AB
- 8.1.2 GSSI Geophysical Survey Systems Inc.
- 8.1.3 Landscope Engineering Ltd
- 8.1.4 Plowman Craven Limited
- 8.1.5 Geospatial Corporation
- 8.1.6 Vivax-Metrotech Corp.
- 8.1.7 Maverick Inspection Ltd
- 8.1.8 Red Laser Scanning
- 8.1.9 Technics Group
- 8.1.10 multiVIEW Locates Inc.

