


 |
市場調查報告書
商品編碼
2124514
基於區塊鏈的供應鏈管理:市場佔有率分析、行業趨勢和統計數據以及成長預測(2026-2031 年)Blockchain Supply Chain - Market Share Analysis, Industry Trends & Statistics, Growth Forecasts (2026 - 2031) |
||||||

※ 本網頁內容可能與最新版本有所差異。詳細情況請與我們聯繫。
2025 年,基於區塊鏈的供應鏈管理市場價值為 12 億美元,預計到 2031 年將達到 124.1 億美元,而 2026 年為 17.7 億美元,預測期(2026-2031 年)的複合年成長率為 47.65%。
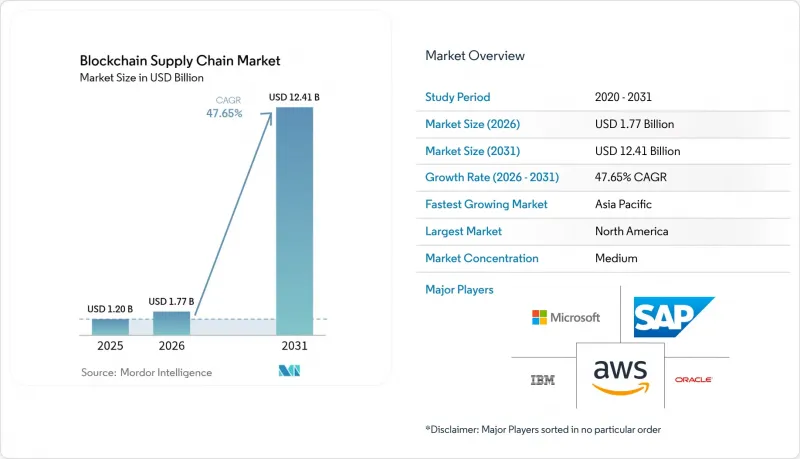
本報告按組件(平台、服務)、區塊鏈類型(公有鏈、私有鏈、聯盟鏈、混合鏈)、部署模式(雲端、本地部署)、組織規模(大型企業、中小企業)、應用(支付結算、產品溯源等)和地區進行細分。市場預測以美元計價。
全球區塊鏈技術驅動的供應鏈管理市場趨勢及洞察
對安全防篡改的供應鏈交易的需求日益成長
雷諾的「XCEED」舉措以高達每秒500筆的處理速度處理超過一百萬份合規文件,展示了不可篡改的帳本如何將監管報告從靜態電子表格轉變為即時檢驗。此網路涵蓋多個一級供應商,縮短了審計準備週期,並增強了集體風險監控。即時身份驗證減少了事件回應時間,嵌入式智慧合約減少了約40%的人工核對工作。敏感資料由細粒度加密金鑰保護,這表明即使在生產規模的區塊鏈中,隱私和透明度也可以共存。
多層供應鏈中端對端透明度的必要性
沃爾瑪的食品安全計畫將追溯污染源所需的時間從數天縮短至數秒,充分展現了防篡改記錄如何提升召回準確度和品牌信任度。 DNV的「我的故事」QR碼將檢驗的永續性和品質數據與單一產品關聯起來,為消費者提供按需獲取的原產地證明。這種方法使品牌能夠將透明度轉化為競爭優勢,同時監管機構也能持續了解產品生命週期中的高風險環節。
區塊鏈網路互通性的局限性
供應鏈合作夥伴通常使用不同的帳本,由於無法直接通訊,他們不得不建造成本高昂的中間件。儘管 Hyperledger Cacti 和其他跨鏈框架正在發展,但缺乏普遍接受的檢驗規則和爭議解決機制阻礙了其普及應用。擁有多元化供應商生態系統的公司擔心供應商鎖定問題,因此互通性成為大規模部署的策略前提。
細分市場分析
預計到2025年,平台相關服務將佔區塊鏈供應鏈管理市場規模的56.62%,顯示企業對可擴展的基礎架構有著強勁的需求,該架構能夠支援多種應用情境。供應商藍圖強調模組化API、人工智慧驅動的分析以及整合加速器,以便將區塊鏈整合到現有的MES、WMS和ERP系統中。預計複合年成長率將達到48.10%的服務包括架構設計、資料遷移、變更管理和營運管理軟體包。隨著試驗計畫逐步投入生產,企業正將預算從實驗階段轉向長期營運支援。
IBM Food Trust 等成功案例凸顯了整合平台如何縮短引進週期,並在供應商和監管機構之間建立網路效應。基於區塊鏈的專業服務供應鏈管理市場正隨著合作夥伴生態系統的擴展而進一步擴大,這些生態系統將網路安全、溝通經濟學和持續合規模區塊捆綁在一起,為系統整合商提供永續的收入來源。
公共架構憑藉其開放的檢驗和易於多元合作夥伴加入的特點,預計到2025年將佔據42.10%的收入佔有率。然而,對定價模式、供應商名單和合約條款的擔憂促使許多公司採用混合框架,將鏈上透明度與許可型數據飛地相結合。這種混合子領域體現了網路覆蓋範圍和資料隱私之間的平衡,預計將實現49.20%的複合年成長率。
VeChain透過其「StarGate」計畫推出的更新版加權委託權益證明(WDPoS)正是這種轉變的例證。此設計賦予企業節點管治影響力,同時確保公開檢驗的可靠性。隨著各國資料居住法規的日益嚴格,混合部署能夠在不影響全球同步的前提下實現區域分類,從而促進其在擁有敏感的醫藥和國防供應鏈的行業中的應用。
區域分析
北美地區得益於早期採用者、強勁的創業投資資金和相對清晰的法律體制,預計到2025年將佔全球收入的39.15%。沃爾瑪、家得寶和主要汽車製造商是多層網路的核心,該網路正在加速整個供應鏈的採用。美國監管機構已發布指導意見,明確了數位記錄的證據價值,從而緩解了審計人員的擔憂。加拿大正致力於自然資源的可追溯性,而墨西哥則利用區塊鏈技術來提高近岸外包的物流透明度。
亞太地區預計將實現50.30%的複合年成長率,這主要得益於中國政府支持的「一帶一路」區塊鏈貿易走廊、日本的「社會5.0」數位化計劃以及印度的「生產連結獎勵計畫」(PLI)推動的製造業擴張。政府主導的沙盒機制正在加速跨境關稅、電子帳單發票認證和碳權清算中心等領域的試點計畫。澳洲礦業出口商正在採用基於帳本的排放報告機制,以滿足全球買家對環境、社會和治理(ESG)的嚴格審查。
歐洲的發展動能源自於其嚴格的永續發展法規。強制性的「數位產品護照」要求提供詳細的生命週期數據,這促使製造商轉向基於區塊鏈的可追溯性。德國的「工業4.0」叢集正在將區塊鏈與物聯網和5G工廠網路融合,而英國則利用其金融科技優勢實現供應鏈金融的代幣化。中東、南美和非洲的新興中心正在實施帳本解決方案,以簡化海關程序並提升貿易港口的競爭力。
其他好處:
- Excel格式的市場預測(ME)表
- 3個月的分析師支持
目錄
第1章:引言
- 研究假設和市場定義
- 調查範圍
第2章:調查方法
第3章執行摘要
第4章 市場狀況
- 市場概覽
- 市場促進因素
- 對安全防篡改的供應鏈交易的需求日益成長
- 多層供應鏈中端對端透明度的必要性
- 透過追蹤和自動匹配代幣化資產來降低成本。
- 物聯網感測器與區塊鏈的整合用於即時資產追蹤
- 基於ESG的原產地審計要求
- 物流領域的智慧保險和參數型保險索賠
- 市場限制因素
- 區塊鏈網路互通性的局限性
- 跨境資料和加密資產監管方面的不確定性
- 對公有鏈的可擴展性和能耗問題感到擔憂。
- 企業專案中Web3人才短缺
- 價值鏈分析
- 監理情勢
- 技術趨勢(DID、零知識證明、L2 總結等)
- 波特五力分析
- 宏觀經濟因素對市場的影響
第5章 市場規模與成長預測
- 按組件
- 平台
- 服務
- 按區塊鏈類型
- 民眾
- 私人的
- 聯盟
- 混合
- 按部署模式
- 雲
- 現場
- 按組織規模
- 大公司
- 小型企業
- 透過使用
- 付款和結算
- 產品可追溯性
- 仿冒品檢測
- 智慧合約
- 風險與合規管理
- 其他用途
- 按地區
- 北美洲
- 美國
- 加拿大
- 墨西哥
- 南美洲
- 巴西
- 阿根廷
- 其他南美國家
- 歐洲
- 德國
- 英國
- 法國
- 西班牙
- 俄羅斯
- 其他歐洲國家
- 亞太地區
- 中國
- 日本
- 印度
- 澳洲
- 韓國
- 其他亞太國家
- 中東
- 阿拉伯聯合大公國
- 沙烏地阿拉伯
- 土耳其
- 其他中東國家
- 非洲
- 南非
- 奈及利亞
- 其他非洲國家
- 北美洲
第6章 競爭情勢
- 市場集中度
- 策略趨勢
- 市佔率分析
- 公司簡介
- IBM Corporation
- Oracle Corporation
- Microsoft Corporation
- SAP SE
- Amazon Web Services, Inc.
- Huawei Technologies Co., Ltd.
- TIBCO Software Inc.
- Vechain Foundation San Marino Srl
- GuardTime OU
- Accenture PLC
- Auxesis Group
- Omnichain Solutions, Inc.
- BTL Group Limited
- Bitfury Holding BV
- CargoSmart Limited
- Chainlink Labs Inc.
- Everledger Limited
第7章 市場機會與未來展望
According to Mordor Intelligence, the blockchain supply chain market size was valued at USD 1.20 billion in 2025 and estimated to grow from USD 1.77 billion in 2026 to reach USD 12.41 billion by 2031, at a CAGR of 47.65% during the forecast period (2026-2031).
This report is Segmented by Component (Platform, Services), Blockchain Type (Public, Private, Consortium, Hybrid), Deployment Model (Cloud, On-Premise), Organization Size (Large Enterprises, Smes), Application (Payment and Settlement, Product Traceability, and More), and Geography. The Market Forecasts are Provided in Terms of Value (USD).
Global Blockchain Supply Chain Market Trends and Insights
Augmented Demand for Secure, Tamper-Proof Supply-Chain Transactions
Renault's XCEED initiative processes more than 1 million compliance documents at up to 500 TPS, illustrating how immutable ledgers shift regulatory reporting from static spreadsheets to real-time verification . The network spans multiple tier-one suppliers, cutting audit preparation cycles and strengthening collective risk oversight. Real-time certification reduces disruption response intervals, and embedded smart contracts eliminate roughly 40% of manual reconciliations. Confidential data is safeguarded through granular cryptographic keys, proving that privacy and transparency can co-exist on production-scale blockchains.
Need for End-to-End Transparency in Multi-Tier Supply Chains
Walmart's food-safety program trimmed contamination source tracing from days to seconds, demonstrating how immutable records enhance recall accuracy and brand trust. DNV's "My Story" QR codes link verified sustainability and quality data to individual items, giving consumers on-demand provenance proof . The approach allows brands to transform transparency into a competitive advantage while regulators gain continuous visibility into high-risk nodes across product life cycles.
Limited Interoperability Across Blockchain Networks
Supply-chain partners often operate disparate ledgers that fail to communicate natively, forcing costly middleware builds. Hyperledger Cacti and other cross-chain frameworks are advancing, yet the absence of universally accepted validation rules and dispute mechanisms prolongs deployment timelines. Enterprises with diverse vendor ecosystems remain wary of vendor lock-in, making interoperability a strategic prerequisite before large-scale rollouts.
Other drivers and restraints analyzed in the detailed report include:
- Cost-Saving Push from Tokenized Asset Tracking and Automated Reconciliation
- Convergence of IoT Sensors and Blockchain for Real-Time Asset Tracking
- Regulatory Uncertainty on Cross-Border Data/Crypto Rules
For complete list of drivers and restraints, kindly check the Table Of Contents.
Segment Analysis
Platform offerings accounted for 56.62% of the blockchain supply chain market size in 2025, underscoring enterprise appetite for scalable backbones that serve multiple use cases. Vendor roadmaps emphasize modular APIs, AI-powered analytics, and integration accelerators that embed blockchain into existing MES, WMS, and ERP systems. Services, projected to rise at a 48.10% CAGR, include architecture design, data migration, change management, and managed operations packages. As pilot programs graduate to production, enterprises redirect budgets from experimentation to long-term operational support.
Implementation proof points such as IBM Food Trust highlight how unified platforms condense deployment cycles and foster network effects among suppliers and regulators. The blockchain supply chain market size tied to professional services is further amplified by partner ecosystems that bundle cybersecurity, tokenomics, and continuous-compliance modules, creating recurring revenue streams for system integrators.
Public architectures held 42.10% revenue share in 2025, owing to open validation and easy onboarding for diverse partners. Yet sensitivity around pricing models, supplier lists, and contract terms drives many corporates toward hybrid frameworks combining on-chain transparency with permissioned data enclaves. The hybrid sub-segment is projected to register a 49.20% CAGR, reflecting the balance between network reach and data privacy.
VeChain's weighted delegated proof-of-stake update, rolled out via its StarGate program, epitomizes this shift. The design gives enterprise nodes governance influence while preserving public verification guarantees. As national data-residency laws tighten, hybrid deployments allow regional segmentation without sacrificing global synchronization, promoting adoption in industries with sensitive formulation or defense supply chains.
Complete Report Scope:
- By Component
- Platform
- Services
- By Blockchain Type
- Public
- Private
- Consortium
- Hybrid
- By Deployment Model
- Cloud
- On-premise
- By Organization Size
- Large Enterprises
- SMEs
- By Application
- Payment and Settlement
- Product Traceability
- Counterfeit Detection
- Smart Contracts
- Risk and Compliance Management
- Other Applications
- By Geography
- North America
- United States
- Canada
- Mexico
- South America
- Brazil
- Argentina
- Rest of South America
- Europe
- Germany
- United Kingdom
- France
- Spain
- Russia
- Rest of Europe
- Asia Pacific
- China
- Japan
- India
- Australia
- South Korea
- Rest of Asia Pacific
- Middle East
- United Arab Emirates
- Saudi Arabia
- Turkey
- Rest of the Middle East
- Africa
- South Africa
- Nigeria
- Rest of Africa
- North America
Geography Analysis
North America secured 39.15% of 2025 revenue, energized by early-mover enterprises, robust venture funding, and comparatively clear legal frameworks. Walmart, Home Depot, and major automotive OEMs anchor multi-tier networks that funnel adoption down their supply chains. US regulators have issued guidance clarifying digital record admissibility, easing auditor concerns. Canada emphasizes natural-resource traceability, whereas Mexico leverages blockchain for near-shoring logistics transparency.
Asia-Pacific is on track for a 50.30% CAGR, driven by China's state-backed Belt and Road blockchain trade corridors, Japan's Society 5.0 digitization blueprint, and India's PLI-backed manufacturing expansion. Government-sponsored sandboxes fast-track pilots in cross-border duties, e-invoice authentication, and carbon-credit clearinghouses. Australia's mining exporters adopt ledger-anchored emissions reporting to satisfy global buyers' ESG scrutiny.
Europe's momentum comes from stringent sustainability legislation. Digital Product Passport mandates require granular lifecycle data, steering manufacturers toward blockchain-enabled traceability. Germany's Industry 4.0 clusters integrate blockchains with IoT and 5G factory networks, while the United Kingdom focuses on supply-chain finance tokenization aligned to its fintech strengths. Emerging hubs in the Middle East, South America, and Africa adopt ledger solutions to streamline customs processing and boost trade-port competitiveness.
- IBM Corporation
- Oracle Corporation
- Microsoft Corporation
- SAP SE
- Amazon Web Services, Inc.
- Huawei Technologies Co., Ltd.
- TIBCO Software Inc.
- Vechain Foundation San Marino S.r.l.
- GuardTime OU
- Accenture PLC
- Auxesis Group
- Omnichain Solutions, Inc.
- BTL Group Limited
- Bitfury Holding B.V.
- CargoSmart Limited
- Chainlink Labs Inc.
- Everledger Limited
Additional Benefits:
- The market estimate (ME) sheet in Excel format
- 3 months of analyst support
TABLE OF CONTENTS
1 INTRODUCTION
- 1.1 Study Assumptions and Market Definition
- 1.2 Scope of the Study
2 RESEARCH METHODOLOGY
3 EXECUTIVE SUMMARY
4 MARKET LANDSCAPE
- 4.1 Market Overview
- 4.2 Market Drivers
- 4.2.1 Augmented demand for secure, tamper-proof supply-chain transactions
- 4.2.2 Need for end-to-end transparency in multi-tier supply chains
- 4.2.3 Cost-saving push from tokenized asset tracking and automated reconciliation
- 4.2.4 Convergence of IoT sensors and blockchain for real-time asset tracking
- 4.2.5 ESG-driven provenance auditing requirements
- 4.2.6 Smart-insurance and parametric pay-outs for logistics
- 4.3 Market Restraints
- 4.3.1 Limited interoperability across blockchain networks
- 4.3.2 Regulatory uncertainty on cross-border data/crypto rules
- 4.3.3 Scalability and energy-use concerns in public chains
- 4.3.4 Shortage of Web3 talent for enterprise projects
- 4.4 Value Chain Analysis
- 4.5 Regulatory Landscape
- 4.6 Technological Outlook (DIDs, Zero-Knowledge Proofs, L2 roll-ups, and others)
- 4.7 Porter's Five Forces Analysis
- 4.7.1 Bargaining Power of Buyers
- 4.7.2 Bargaining Power of Suppliers
- 4.7.3 Threat of New Entrants
- 4.7.4 Threat of Substitutes
- 4.7.5 Intensity of Competitive Rivalry
- 4.8 Impact of Macroeconomic Factors on the Market
5 MARKET SIZE AND GROWTH FORECASTS (VALUE)
- 5.1 By Component
- 5.1.1 Platform
- 5.1.2 Services
- 5.2 By Blockchain Type
- 5.2.1 Public
- 5.2.2 Private
- 5.2.3 Consortium
- 5.2.4 Hybrid
- 5.3 By Deployment Model
- 5.3.1 Cloud
- 5.3.2 On-premise
- 5.4 By Organization Size
- 5.4.1 Large Enterprises
- 5.4.2 SMEs
- 5.5 By Application
- 5.5.1 Payment and Settlement
- 5.5.2 Product Traceability
- 5.5.3 Counterfeit Detection
- 5.5.4 Smart Contracts
- 5.5.5 Risk and Compliance Management
- 5.5.6 Other Applications
- 5.6 By Geography
- 5.6.1 North America
- 5.6.1.1 United States
- 5.6.1.2 Canada
- 5.6.1.3 Mexico
- 5.6.2 South America
- 5.6.2.1 Brazil
- 5.6.2.2 Argentina
- 5.6.2.3 Rest of South America
- 5.6.3 Europe
- 5.6.3.1 Germany
- 5.6.3.2 United Kingdom
- 5.6.3.3 France
- 5.6.3.4 Spain
- 5.6.3.5 Russia
- 5.6.3.6 Rest of Europe
- 5.6.4 Asia Pacific
- 5.6.4.1 China
- 5.6.4.2 Japan
- 5.6.4.3 India
- 5.6.4.4 Australia
- 5.6.4.5 South Korea
- 5.6.4.6 Rest of Asia Pacific
- 5.6.5 Middle East
- 5.6.5.1 United Arab Emirates
- 5.6.5.2 Saudi Arabia
- 5.6.5.3 Turkey
- 5.6.5.4 Rest of the Middle East
- 5.6.6 Africa
- 5.6.6.1 South Africa
- 5.6.6.2 Nigeria
- 5.6.6.3 Rest of Africa
- 5.6.1 North America
6 COMPETITIVE LANDSCAPE
- 6.1 Market Concentration
- 6.2 Strategic Moves
- 6.3 Market Share Analysis
- 6.4 Company Profiles (includes Global level Overview, Market level Overview, Core Segments, Financials as available, Strategic Information, Market Rank/Share, Products and Services, Recent Developments)
- 6.4.1 IBM Corporation
- 6.4.2 Oracle Corporation
- 6.4.3 Microsoft Corporation
- 6.4.4 SAP SE
- 6.4.5 Amazon Web Services, Inc.
- 6.4.6 Huawei Technologies Co., Ltd.
- 6.4.7 TIBCO Software Inc.
- 6.4.8 Vechain Foundation San Marino S.r.l.
- 6.4.9 GuardTime OU
- 6.4.10 Accenture PLC
- 6.4.11 Auxesis Group
- 6.4.12 Omnichain Solutions, Inc.
- 6.4.13 BTL Group Limited
- 6.4.14 Bitfury Holding B.V.
- 6.4.15 CargoSmart Limited
- 6.4.16 Chainlink Labs Inc.
- 6.4.17 Everledger Limited
7 MARKET OPPORTUNITIES AND FUTURE OUTLOOK
- 7.1 White-space and Unmet-Need Assessment

 區塊鏈供應鏈全球市場規模、佔有率、趨勢和成長分析報告(2026-2034年)
 區塊鏈市場分析及2035年醫療保健供應鏈預測:按類型、產品、服務、技術、組件、應用、流程、部署、最終用戶和解決方案分類
 2034年農業供應鏈可追溯性市場預測-依可追溯性階段、產品類型、公司規模、技術、應用、最終用戶和地區分類的全球分析永續供應鏈分析市場預測至2034年-全球分析(依分析類型、供應鏈階段、資料來源、決策支援功能、最終使用者和地區分類)EcoLoop市場預測(2034年)-按組件、部署模式、經營模式、應用、最終用戶和地區分類的全球分析數位產品通行證解決方案市場預測至2034年-按部署模式、通行證類型、技術、資料媒體、最終用戶和地區分類的全球分析產品護照管理市場預測至2034年-按部署類型、護照類型、技術、認證方法、最終用戶和地區分類的全球分析區塊鏈驅動的供應鏈透明平台市場預測至2034年:按平台類型、部署模式、供應鏈功能、最終用戶和地區分類的全球分析材料追溯平台市場預測至2034年-按組件、材料類型、部署模式、技術、應用、最終用戶和地區分類的全球分析產品護照解決方案市場預測至2034年-按組件、部署模式、企業規模、技術、應用、最終用戶和地區分類的全球分析