

 |
市場調查報告書
商品編碼
2124628
5G物聯網:市佔率分析、產業趨勢與統計、成長預測(2026-2031年)5G IoT - Market Share Analysis, Industry Trends & Statistics, Growth Forecasts (2026 - 2031) |
||||||

※ 本網頁內容可能與最新版本有所差異。詳細情況請與我們聯繫。
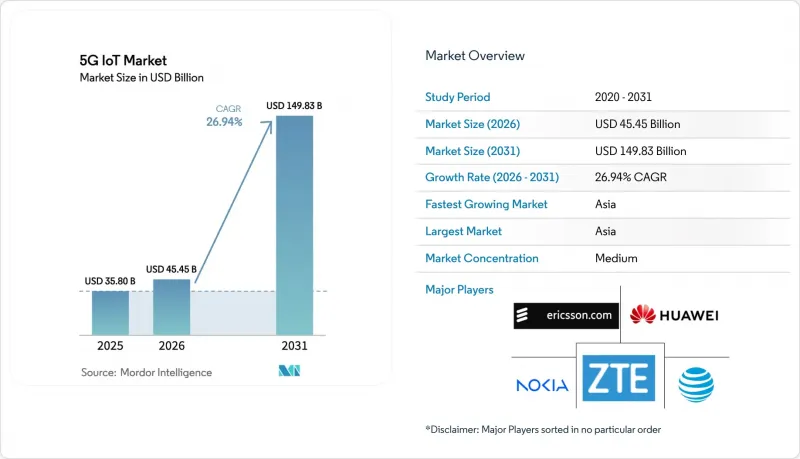
據 Mordor Intelligence 稱,2025 年 5G 物聯網市值為 358 億美元,預計到 2031 年將達到 1498.3 億美元,而 2026 年為 454.5 億美元,預測期(2026-2031 年)的複合成長率為 26.94%。
本報告按技術(超高可靠性低延遲通訊 (URLLC)、低功耗廣域網路 (LPWAN))、終端用戶產業(製造業、供應鏈和物流、醫療保健、零售、智慧城市和基礎設施、汽車和運輸)和地區進行分類。
全球5G物聯網市場趨勢與洞察
透過 RedCap 部署實現極高的設備密度
RedCap Release 17 透過將峰值資料傳輸速率限制在 250 Mbps 並採用更簡單的天線架構,降低了 30-40% 的模組成本。其長達數年的電池壽命使其適用於工業自動化、智慧電錶和城市級感測,同時向下相容性確保了全國範圍的覆蓋。
電信業者利用雲端和網路API的商業化戰略
雲端原生 5G 核心網路使營運商能夠透過 API 提供服務品質 (QoS)、位置服務和網路切片功能。企業將為確定性性能支付額外費用,從而獲得足以抵消大量頻寬和基礎設施投資的業務收益。
對於售價低於 2 美元的設備,4G/LPWAN 就足夠了。
許多低價值感測器每天僅傳輸數千位元組的資料。 LTE Cat-1 和 NB-IoT 技術已經能夠滿足這些需求,同時也能將模組成本降低一半。因此,地方公共產業和農業技術公司正在推遲 5G 升級,直到其價格能夠與其提供的價值相符。
細分市場分析
到2025年,LPWAN(5G RedCap)將佔據5G市場53.00%的佔有率,這體現了成本和網路效能的最佳平衡。 URLLC雖然規模較小,但預計其複合年成長率將達到40.63%,因為工廠和自動駕駛汽車對亞毫秒延遲的需求日益成長。隨著模組價格在2027年降至4美元左右,LPWAN設備的5G物聯網市場規模預計將顯著擴大。企業正在將資產追蹤和環境監測工作負載從LTE Cat-1遷移到RedCap,以利用網路切片技術,而無需承擔5G硬體的全部成本。同時,在機器人焊接和遠端手術等領域,URLLC的高價是合理的,這推動了專用晶片組的創新。
URLLC(超可靠低延遲通訊)的應用案例通常涉及將其與私有5G網路中的邊緣運算節點整合,從而取代確定性的有線乙太網路。奧迪在其沖壓廠的部署案例表明,該技術能夠縮短生產週期並減少停機時間,證明了其商業價值。組件供應商正競相利用時間敏感型網路特性和場效率計算(FEC)方案來確保資料包的傳輸,從而在頻寬指標之外實現差異化。簡而言之,5G物聯網市場的技術選擇並非基於統一的藍圖,而是基於具體的延遲、功耗和成本限制。
區域分析
在電信業者的資本投入與政策獎勵下,亞太地區正引領5G物聯網市場的發展,預計2025年,中國將佔全球銷售額的41.25%。中國聯通計劃在2025年底前將其5G-Advanced網路覆蓋範圍擴展至300個城市,這將大規模提升機器類通訊容量,並提高網路利用率。本地系統整合商正在維修鋼鐵、紡織和電子產業的生產線,並推廣專用網路技術。印度的成長率最高,預計到2031年將達到34.95%,這得益於RedCap公司售價低於5美元的模組符合中小企業的預算。諸如「數位印度」和「印度製造」等政府項目正在放寬頻段租賃規定,加速製藥、汽車和能源等行業的園區級部署。
在北美,由於《晶片和資訊安全法案》(CHIPS Act)的津貼,半導體工廠和國防基地的專用網路試點部署正被優先考慮。從密西根州延伸至德克薩斯州的汽車產業走廊沿線,路邊V2X單元和工廠內部的超可靠低延遲通訊(URLLC)鏈路正在部署,這充分展現了高頻寬、低延遲服務的投資回報。雲端超大規模資料中心業者正與營運商合作,提供網路API,使企業能夠透過程式碼進行路由,從而將服務運作時間從數月縮短至數分鐘。這種平台動態性正將5G物聯網市場從單純的連接擴展到應用託管領域。
其他好處:
- Excel格式的市場預測(ME)表
- 3個月的分析師支持
目錄
第1章:引言
- 研究假設和市場定義
- 調查範圍
第2章:調查方法
第3章執行摘要
第4章 市場狀況
- 市場概覽
- 市場促進因素
- RedCap的引入顯著提高了裝置密度。
- 電信業者雲端和網路API的商業化戰略
- 採用 3GPP 認證的有限功能(NR-Light)晶片組,售價低於 5 美元的產品。
- 超低功耗模組的需求與能源價格相關
- 歐盟實施共同安全指令(CSRD)給供應鏈帶來了壓力,促使其實現資產追蹤的數位化。
- 政府對 5G 專用網路的津貼(美國 CHIPS、歐盟 IPCEI)
- 市場限制因素
- 2 美元以下設備類別中 4G/LPWAN 的可用性
- 工業相機毫米波模組的物料清單 (BOM) 價格昂貴(超過 60 美元)。
- 拉丁美洲和非洲RedCap認證體系的碎片化
- 安全和合規相關成本(NIS2、SBOM)正在給 OEM 的利潤率帶來壓力。
- 價值供應鏈分析
- 監理情勢
- 技術展望
- 波特五力模型
第5章 市場規模與成長預測
- 透過技術
- 超高可靠性、低延遲通訊(URLLC)
- 低功耗廣域網路(LPWAN 5G RedCap/NB)
- 按最終用戶行業分類
- 製造業
- 供應鍊和物流
- 衛生保健
- 零售
- 智慧城市和基礎設施
- 汽車和運輸業
- 按地區
- 北美洲
- 美國
- 加拿大
- 墨西哥
- 南美洲
- 巴西
- 阿根廷
- 歐洲
- 德國
- 英國
- 法國
- 西班牙
- 俄羅斯
- 亞太地區
- 中國
- 日本
- 印度
- 澳洲和紐西蘭
- 中東和非洲
- 中東
- 非洲
- 北美洲
第6章 競爭情勢
- 市場集中度
- 策略趨勢
- 市佔率分析
- 公司簡介
- Nokia
- Ericsson
- Huawei
- ZTE
- Cisco
- Qualcomm
- ATandT
- Verizon
- Deutsche Telekom
- Vodafone
- China Mobile
- SK Telecom
- KT Corp
- Telefonica
- Telstra
- Rogers
- Orange
- Bell Canada
- NTT DOCOMO
- Reliance Jio
第7章 市場機會與未來展望
According to Mordor Intelligence, the 5G IoT market size was valued at USD 35.80 billion in 2025 and estimated to grow from USD 45.45 billion in 2026 to reach USD 149.83 billion by 2031, at a CAGR of 26.94% during the forecast period (2026-2031).
This report is Segmented by Technology (Ultra-Reliable Low-Latency Communications (URLLC), Low-Power Wide-Area Network (LPWAN)), End-User Industry (Manufacturing, Supply Chain and Logistics, Healthcare, Retail, Smart Cities and Infrastructure, Automotive and Transportation), and Geography
Global 5G IoT Market Trends and Insights
Massive device-density enablement after RedCap roll-out
Release 17 RedCap limits peak data rates to 250 Mbps and employs simpler antenna architectures, trimming module costs by 30-40%. Multi-year battery life aligns with industrial automation, smart metering, and city-wide sensing, while backward compatibility maintains nationwide coverage.
Telco cloud & network-API monetization playbooks
Cloud-native 5G cores let operators expose quality-of-service, location, and slicing functions through APIs. Enterprises pay a premium for deterministic performance, creating service revenue that offsets heavy spectrum and infrastructure investments.
4G/LPWAN sufficiency for sub-USD 2 device classes
Many low-value sensors only transmit kilobytes per day; LTE Cat-1 and NB-IoT already meet such needs at half the module cost. Rural utilities and agri-tech firms therefore defer 5G upgrades until pricing aligns with value delivered.
Other drivers and restraints analyzed in the detailed report include:
- 3GPP-approved reduced-capability chipsets below USD 5
- Energy-price-linked demand for ultra-low-power modules
- Security-compliance costs (NIS2, SBOM) squeeze OEM margins
For complete list of drivers and restraints, kindly check the Table Of Contents.
Segment Analysis
LPWAN (5G RedCap) captured 53.00% of the 5G market in 2025, reflecting optimum trade-offs between cost and network capabilities. URLLC, although smaller, is projected to grow at a 40.63% CAGR as factories and autonomous vehicles demand sub-1 ms latency. The 5G Internet of Things market size for LPWAN devices is projected to rise significantly as module prices fall toward USD 4 by 2027. Enterprises migrate asset-tracking and environmental-monitoring workloads from LTE Cat-1 to RedCap to leverage network slicing without incurring full 5G hardware costs. Conversely, domains such as robotic welding and remote surgery justify the premium of URLLC, driving specialized chipset innovation.
URLLC use cases frequently pair with edge-compute nodes inside private 5G networks, replacing deterministic wired Ethernet. Audi's implementation in press-shops improved cycle times and reduced downtime, validating the business case. Component vendors compete on time-sensitive networking features and FEC schemes that guarantee packet delivery, distinguishing offers beyond bandwidth metrics. In sum, technology choice in the 5G Internet of Things market aligns with distinct latency, power, and cost envelopes instead of a one-size-fits-all roadmap.
Complete Report Scope:
- By Technology
- Ultra-Reliable Low-Latency Communications (URLLC)
- Low-Power Wide-Area Network (LPWAN 5G RedCap/NB)
- By End-User Industry
- Manufacturing
- Supply-Chain and Logistics
- Healthcare
- Retail
- Smart Cities and Infrastructure
- Automotive and Transportation
- By Geography
- North America
- United States
- Canada
- Mexico
- South America
- Brazil
- Argentina
- Europe
- Germany
- United Kingdom
- France
- Spain
- Russia
- Asia-Pacific
- China
- Japan
- India
- Australia and New Zealand
- Middle East and Africa
- Middle East
- Africa
- North America
Geography Analysis
Asia-Pacific dominated the 5G Internet of Things market with China accounting for 41.25% of revenue in 2025, backed by operator capex and policy incentives. China Unicom plans 5G-Advanced coverage in 300 cities by end-2025, adding massive machine-type capacity and raising network utilization. Local integrators retrofit production lines in steel, textiles, and electronics, mainstreaming private-network know-how. India posts the fastest regional CAGR at 34.95% through 2031 as RedCap's sub-USD 5 modules fit the budget of small and medium enterprises. Government programs such as Digital India and Make-in-India relax spectrum-leasing rules, accelerating campus-wide deployments in pharma, auto, and energy verticals.
North America prioritizes private-network pilots in semiconductor fabs and defense hubs, aided by CHIPS Act grants. The automotive corridor from Michigan to Texas deploys roadside V2X units and factory URLLC links, validating return-on-investment for high-bandwidth, low-latency services. Cloud hyperscalers partner with carriers to expose network APIs that let enterprises configure paths with code, shortening service-activation cycles from months to minutes. This platform's dynamic extends the 5G Internet of Things market beyond connectivity into application hosting.
- Nokia
- Ericsson
- Huawei
- ZTE
- Cisco
- Qualcomm
- ATandT
- Verizon
- Deutsche Telekom
- Vodafone
- China Mobile
- SK Telecom
- KT Corp
- Telefonica
- Telstra
- Rogers
- Orange
- Bell Canada
- NTT DOCOMO
- Reliance Jio
Additional Benefits:
- The market estimate (ME) sheet in Excel format
- 3 months of analyst support
TABLE OF CONTENTS
1 INTRODUCTION
- 1.1 Study Assumptions and Market Definition
- 1.2 Scope of the Study
2 RESEARCH METHODOLOGY
3 EXECUTIVE SUMMARY
4 MARKET LANDSCAPE
- 4.1 Market Overview
- 4.2 Market Drivers
- 4.2.1 Massive device-density enablement after RedCap roll-out
- 4.2.2 Telco cloud and network-API monetisation playbooks
- 4.2.3 3GPP-approved reduced-capability (NR-Light) chipsets below US$5
- 4.2.4 Energy-price-linked demand for ultra-low-power modules
- 4.2.5 Supply-chain pressure to digitise asset-tracking post EU CSRD
- 4.2.6 Government-subsidised 5G private-network grants (US CHIPS, EU IPCEI)
- 4.3 Market Restraints
- 4.3.1 4G/LPWAN sufficiency for sub-US$2 device classes
- 4.3.2 High mmWave module BOM (>US$60) for industrial cameras
- 4.3.3 Fragmented certification regimes for RedCap in LATAM and Africa
- 4.3.4 Security-compliance costs (NIS2, SBOM) squeeze OEM margins
- 4.4 Value/Supply-Chain Analysis
- 4.5 Regulatory Landscape
- 4.6 Technological Outlook
- 4.7 Porter's Five Forces
- 4.7.1 Threat of New Entrants
- 4.7.2 Bargaining Power of Suppliers
- 4.7.3 Bargaining Power of Buyers
- 4.7.4 Threat of Substitutes
- 4.7.5 Intensity of Competitive Rivalry
5 MARKET SIZE AND GROWTH FORECASTS (VALUE)
- 5.1 By Technology
- 5.1.1 Ultra-Reliable Low-Latency Communications (URLLC)
- 5.1.2 Low-Power Wide-Area Network (LPWAN 5G RedCap/NB)
- 5.2 By End-User Industry
- 5.2.1 Manufacturing
- 5.2.2 Supply-Chain and Logistics
- 5.2.3 Healthcare
- 5.2.4 Retail
- 5.2.5 Smart Cities and Infrastructure
- 5.2.6 Automotive and Transportation
- 5.3 By Geography
- 5.3.1 North America
- 5.3.1.1 United States
- 5.3.1.2 Canada
- 5.3.1.3 Mexico
- 5.3.2 South America
- 5.3.2.1 Brazil
- 5.3.2.2 Argentina
- 5.3.3 Europe
- 5.3.3.1 Germany
- 5.3.3.2 United Kingdom
- 5.3.3.3 France
- 5.3.3.4 Spain
- 5.3.3.5 Russia
- 5.3.4 Asia-Pacific
- 5.3.4.1 China
- 5.3.4.2 Japan
- 5.3.4.3 India
- 5.3.4.4 Australia and New Zealand
- 5.3.5 Middle East and Africa
- 5.3.5.1 Middle East
- 5.3.5.2 Africa
- 5.3.1 North America
6 COMPETITIVE LANDSCAPE
- 6.1 Market Concentration
- 6.2 Strategic Moves
- 6.3 Market Share Analysis
- 6.4 Company Profiles (includes Global level Overview, Recent Developments)
- 6.4.1 Nokia
- 6.4.2 Ericsson
- 6.4.3 Huawei
- 6.4.4 ZTE
- 6.4.5 Cisco
- 6.4.6 Qualcomm
- 6.4.7 ATandT
- 6.4.8 Verizon
- 6.4.9 Deutsche Telekom
- 6.4.10 Vodafone
- 6.4.11 China Mobile
- 6.4.12 SK Telecom
- 6.4.13 KT Corp
- 6.4.14 Telefonica
- 6.4.15 Telstra
- 6.4.16 Rogers
- 6.4.17 Orange
- 6.4.18 Bell Canada
- 6.4.19 NTT DOCOMO
- 6.4.20 Reliance Jio
7 MARKET OPPORTUNITIES AND FUTURE OUTLOOK
- 7.1 White-space and Unmet-need Assessment

 2026-2034年5G物聯網全球市場規模、佔有率、趨勢和成長分析報告
 5G物聯網市場商業機會、成長要素、產業趨勢分析及2026-2035年預測
 面向物聯網的 5G 市場:2026-2032 年全球市場預測(按產品、技術、設備類型、應用和部署模式分類)
 5G工業IoT市場-全球市場規模、佔有率、趨勢、機會、預測:組件、最終用戶、應用、區域及競爭格局(2021-2031)
 2026年全球5G農業市場報告2026年火星塞B邊節點全球市場報告
 追蹤物聯網市場:4G追蹤物聯網市場:5G5G工業IoT市場:按組件、企業規模、應用和產業分類-2026-2032年全球市場預測5G物聯網市場:2026-2032年全球市場預測(按組件、網路架構、部署模式、產業和應用分類)