


 |
市場調查報告書
商品編碼
2124924
VR內容製作服務:市佔率分析、產業趨勢與統計、成長預測(2026-2031年)VR Content Creation Services - Market Share Analysis, Industry Trends & Statistics, Growth Forecasts (2026 - 2031) |
||||||

※ 本網頁內容可能與最新版本有所差異。詳細情況請與我們聯繫。
根據 Mordor Intelligence 預測,VR 內容創作服務市場規模將從 2025 年的 45.3 億美元成長到 2026 年的 65.5 億美元,然後在 2031 年達到 414.7 億美元,2026 年至 2031 年的複合年成長率為 44.62%。
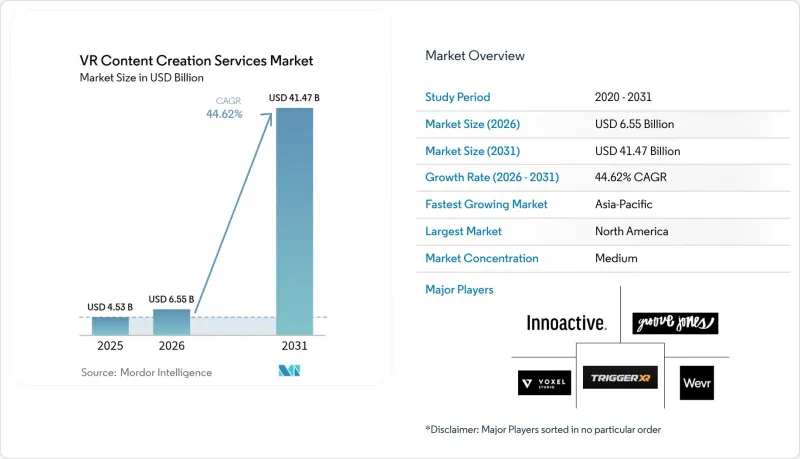
本報告按服務類型(360度攝影、後製服務等)、內容類型(娛樂、培訓和模擬等)、終端用戶行業(媒體和娛樂、醫療保健、教育、零售和電子商務等)、平台(基於PC的VR、行動VR、主機VR、WebXR)和地區進行細分。市場預測以價值(美元)表示。
全球VR內容創作服務市場的趨勢與洞察。
經濟型 6DoF VR頭戴裝置的普及
曾經售價超過1000美元的頭戴式顯示器如今售價已跌破500美元,其中Meta Quest 3引領潮流,預計2024年出貨量將達到240萬台。售價3,499美元的Apple Vision Pro則成功開拓了高階企業市場,吸引工作室進入利潤豐厚的逼真專案市場。不斷擴大的裝置量使得平台提供者能夠按席位授權,從而降低了企業培訓項目的准入門檻。
企業對透過身臨其境型培訓模組進行技能發展的需求
VR學習者報告稱,他們完成軟性技能課程的速度比課堂學生更快,自信心也提高了275%。沃爾瑪已在4700家門市部署了“VR學院”,波音公司也已將737 MAX線束培訓時間縮短了75%。這些可量化的節省時間效果,證明了支撐VR內容創作服務市場的多年期內容合約的合理性。
照片級真實感內容創作流程高成本
體積捕捉技術的資本投入超過100萬美元,而像Framestore這樣的公司製作的電影級項目,每個交付成果的成本通常在50萬到200萬美元之間。即時射線追蹤追蹤渲染的雲端成本是普通影片的兩倍,這使得中小企業難以負擔客製化體驗。
細分市場分析
預計互動式應用開發將以 46.38% 的複合年成長率成長,超過靜態 3D 建模預計在 2025 年達到的 34.28% 的市場佔有率。企業對分支邏輯、基於物理的模擬和多用戶協作的需求日益成長,這增加了軟體工程的複雜性。 Unity 的數據顯示,目前 68% 的企業專案都融入了互動式功能,高於 2022 年的 42%。人工智慧驅動的資源產生器正在推動這一趨勢,使美術人員能夠專注於遊戲邏輯。
3D建模仍然是一項基礎技術,但隨著Infinigen等工具實現背景道具的自動化創建,利潤率面臨的壓力越來越大。 360度影片製作正在發展成為一個細分的實況活動市場,而隨著Adobe Premiere VR工具集的擴展,後製服務也日趨商品化。擁有虛幻引擎專業知識的工作室可以收取高額費用,但由於動畫老手需要重新培訓以適應遊戲引擎的工作流程,因此人才短缺問題仍然存在。
受熱門IP開發的推動,娛樂產業在2025年仍維持41.05%的市場佔有率。醫療領域可視化VR內容創作服務的市場規模預計將以46.41%的複合年成長率成長,這主要得益於FDA的“數位健康舉措”,該計劃建議在手術規劃中使用VR技術。約翰霍普金斯大學的研究表明,在複雜的整形外科手術中使用VR進行演練,可使手術時間縮短38%。
在訓練和模擬領域,國防相關合約依然強勁;在行銷領域,身臨其境型展示室正被奧迪和寶馬等汽車製造商廣泛應用。得益於Matterport的空間數據平台,建築虛擬漫遊在疫情後仍保持成長動能。由於預算限制,教育領域的應用進展緩慢,但STEM(科學、技術、工程和數學)領域的津貼。
區域分析
到2025年,北美將佔全球整體收入的43.05%,這得益於財富500強企業的培訓預算、好萊塢的市場需求以及12億美元用於身臨其境型新創企業的創業投資資金。美國國防部在2024財政年度累計1.5億美元用於虛擬實境(VR)培訓,確保了模擬服務提供者穩定的訂單來源。加拿大設立了2,500萬加元(約1,850萬美元)的身臨其境型媒體基金,致力於培育可出口的創新產品,而一家墨西哥汽車零件供應商則將VR技術應用於組裝訓練。
預計亞太地區將錄得最高成長率,到2031年複合年成長率將達到46.33%。中國的目標是到2026年實現元宇宙相關產值2,500億元人民幣(約350億美元),並為內容創作工作室提供稅收優惠。韓國的「數位新政」累計2,200億韓元(約1.65億美元)用於身臨其境型內容,新加坡也啟動了一項3,000萬新元(約2,200萬美元)的津貼計畫。日本在其「社會5.0」計劃下,資助基於虛擬實境技術的養老護理培訓,而印度則在其科技中心試點企業技能發展計畫。
在歐洲,數位孿生技術在汽車和航太領域的應用正在穩步推進。德國弗勞恩霍夫研究所正與西門子和寶馬合作,檢驗虛擬實境(VR)原型。英國目前為創新產業的VR製作提供25%的稅收返還,法國已投資1,200萬歐元(約1,300萬美元)用於身臨其境型內容的聯合創作。中東地區的成長主要集中在沙烏地阿拉伯和阿拉伯聯合大公國,兩國的主權財富基金正在資助混合實境(MR)旅遊。南美洲仍處於起步階段,但儘管面臨頻寬限制,巴西在引入VR展示室仍取得了進展。
其他好處:
- Excel格式的市場預測(ME)表
- 3個月的分析師支持
目錄
第1章:引言
- 研究假設和市場定義
- 調查範圍
第2章:調查方法
第3章執行摘要
第4章 市場狀況
- 市場概覽
- 市場促進因素
- 經濟型 6DoF VR頭戴裝置的普及
- 企業技能提升對身臨其境型培訓模組的需求
- 利用人工智慧進行程式化內容生成的整合
- 透過邊緣雲渲染網路降低延遲
- 5G獨立組網的擴展正在推動行動VR串流媒體的發展。
- 新興亞洲市場對元宇宙生態系的政府補貼
- 市場限制因素
- 照片級真實感內容創作流程高成本
- 平台標準的碎片化阻礙了資產的重用。
- 農村地區的頻寬限制
- 人們越來越關注暈車和乘客安全問題
- 產業價值鏈分析
- 監理情勢
- 技術展望
- 宏觀經濟因素的影響
- 波特五力分析
第5章 市場規模與成長預測
- 按服務類型
- 3D建模和動畫
- 互動式應用開發
- 360度影片製作
- 360度全景照片
- 後製服務
- 按內容類型
- 娛樂
- 訓練和模擬
- 行銷和廣告
- 教育
- 醫學領域的可視化
- 建築與房地產虛擬之旅
- 按最終用途行業分類
- 媒體與娛樂
- 衛生保健
- 教育
- 零售與電子商務
- 製造業
- 房地產和建築
- 旅遊與飯店
- 按平台
- 基於PC的VR
- 行動VR
- 主機型VR
- WebXR
- 按地區
- 北美洲
- 美國
- 加拿大
- 墨西哥
- 歐洲
- 德國
- 英國
- 法國
- 義大利
- 其他歐洲國家
- 亞太地區
- 中國
- 日本
- 印度
- 韓國
- 澳洲
- 其他亞太國家
- 中東和非洲
- 中東
- 沙烏地阿拉伯
- 阿拉伯聯合大公國
- 其他中東國家
- 非洲
- 南非
- 埃及
- 其他非洲國家
- 中東
- 南美洲
- 巴西
- 阿根廷
- 其他南美國家
- 北美洲
第6章 競爭情勢
- 市場集中度
- 策略趨勢
- 市佔率分析
- 公司簡介
- Voxel Digital Studios Inc.
- Groove Jones LLC
- Innoactive GmbH
- Wevr Inc.
- Trigger XR Inc.
- Future Visual Ltd.
- Zengalt LLC
- Subvrsive Inc.
- REWIND FX Ltd.
- Visualise Creative Ltd.
- PixelWhip Studios Pty Ltd.
- CreamVR Inc.
- B2Studio Sp. z oo
- VR Vision Group LLC
- Lucid Reality Labs LLC
- Metastage Inc.
- The Virtual Reality Company Inc.
- Framestore Ltd.
- Felix and Paul Studios Inc.
- Magnopus LLC
第7章 市場機會與未來展望
According to Mordor Intelligence, the VR content creation services market size is expected to grow from USD 4.53 billion in 2025 to USD 6.55 billion in 2026 and is forecast to reach USD 41.47 billion by 2031 at 44.62% CAGR over 2026-2031.
This report is Segmented by Service Type (360-Degree Photography, Post-Production Services, and More), Content Type (Entertainment, Training and Simulation, and More), End-Use Industry (Media and Entertainment, Healthcare, Education, Retail and Ecommerce, and More), Platform (PC-Based VR, Mobile VR, Console VR, Webxr), and Geography. The Market Forecasts are Provided in Terms of Value (USD).
Global VR Content Creation Services Market Trends and Insights
Proliferation of Affordable 6DoF VR Headsets
Headsets, once priced above USD 1,000, now retail for below USD 500, led by the Meta Quest 3, which shipped 2.4 million units in 2024. Apple Vision Pro carved out a premium enterprise tier at USD 3,499, encouraging studios to bid on higher-margin photorealistic projects. A larger installed base lets platform holders offer seat-based licensing, lowering the threshold for corporate training programs.
Corporate Upskilling Demand for Immersive Training Modules
It is expectecd that VR learners completed soft-skills courses more faster than classroom cohorts and reported 275% greater confidence. Walmart rolled out VR Academies to 4,700 stores, while Boeing cut 737 MAX wiring-harness training time by 75%. Quantified time savings justify multi-year content contracts that underpin the VR Content Creation Services market.
High Cost of Photorealistic Content Production Pipelines
Volumetric capture stages exceed USD 1 million in capital expenditure, and cinematic projects at firms such as Framestore often require USD 500,000 to USD 2 million per deliverable. Real-time ray-traced rendering doubles cloud costs compared with flat video, pricing small enterprises out of bespoke experiences.
Other drivers and restraints analyzed in the detailed report include:
- Integration of AI-Driven Procedural Content Generation
- Expansion of 5G Standalone Networks Enabling Mobile VR Streaming
- Fragmented Platform Standards Hindering Asset Reusability
For complete list of drivers and restraints, kindly check the Table Of Contents.
Segment Analysis
Interactive application development is projected to grow at a 46.38% CAGR, eclipsing static 3D modeling's 34.28% 2025 share. Corporations are increasingly requesting branching logic, physics-based simulations, and multi-user collaboration, thereby elevating the complexity of software engineering. Unity reported that 68% of enterprise projects now incorporate interactivity, up from 42% in 2022. AI-powered asset generators enable artists to focus on gameplay logic, reinforcing this trend.
3D modeling remains foundational, yet margin pressure rises as tools like Infinigen automate the creation of background props. 360-degree video production has evolved into a niche live-event broadcasting, while post-production services are being commoditized amid the expansion of Adobe Premiere VR toolsets. Studios with Unreal Engine expertise command premium rates, but talent shortages persist as animation veterans retrain on game-engine workflows.
Entertainment retained a 41.05% share in 2025, benefiting from the extension of blockbuster intellectual property. The VR Content Creation Services market size for healthcare visualization is forecast to expand at a 46.41% CAGR, driven by FDA Digital Health initiatives that endorse the use of VR for surgical planning. Johns Hopkins reported a 38% cut in operating-room time after VR rehearsal for complex orthopedic surgeries.
Training and simulation secure steady defense contracts, while marketing applications leverage immersive showrooms from automakers such as Audi and BMW. Architecture tours are continuing to build momentum post-pandemic, thanks to Matterport's spatial data platform. Education adoption lags due to budget constraints, but receives incremental boosts from STEM grants.
Complete Report Scope:
- By Service Type
- 3D Modeling and Animation
- Interactive Application Development
- 360-Degree Video Production
- 360-Degree Photography
- Post-Production Services
- By Content Type
- Entertainment
- Training and Simulation
- Marketing and Advertising
- Education
- Healthcare Visualization
- Architecture and Real Estate Virtual Tours
- By End-Use Industry
- Media and Entertainment
- Healthcare
- Education
- Retail and Ecommerce
- Manufacturing
- Real Estate and Construction
- Tourism and Hospitality
- By Platform
- PC-Based VR
- Mobile VR
- Console VR
- WebXR
- By Geography
- North America
- United States
- Canada
- Mexico
- Europe
- Germany
- United Kingdom
- France
- Italy
- Rest of Europe
- Asia-Pacific
- China
- Japan
- India
- South Korea
- Australia
- Rest of Asia-Pacific
- Middle East and Africa
- Middle East
- Saudi Arabia
- United Arab Emirates
- Rest of Middle East
- Africa
- South Africa
- Egypt
- Rest of Africa
- Middle East
- South America
- Brazil
- Argentina
- Rest of South America
- North America
Geography Analysis
North America generated 43.05% of global revenue in 2025, supported by Fortune 500 training budgets, Hollywood volumetric capture, and USD 1.2 billion in venture funding for immersive startups. The United States Department of Defense earmarked USD 150 million for VR training in fiscal 2024, underwriting a stable pipeline for simulation providers. Canada's CAD 25 million (USD 18.5 million) immersive-media fund fosters export-ready productions, while Mexico's automotive suppliers adopt VR for assembly training.
Asia-Pacific is forecast to post the fastest 46.33% CAGR through 2031. China aims to target CNY 250 billion (USD 35 billion) in metaverse output by 2026, offering tax rebates to content studios. South Korea's Digital New Deal set aside KRW 220 billion (USD 165 million) for immersive content, and Singapore launched a SGD 30 million (USD 22 million) grant program. Japan funds VR eldercare training under its Society 5.0 vision, while India pilots corporate upskilling programs in tech hubs.
Europe benefits from automotive and aerospace digital-twin adoption. Germany's Fraunhofer Institute collaborates with Siemens and BMW on reviewing VR prototypes. The United Kingdom now offers a 25% creative-industries tax rebate for VR production, and France invests EUR 12 million (USD 13 million) in immersive co-productions. Middle East growth is concentrated in Saudi Arabia and the United Arab Emirates, where sovereign funds are bankrolling mixed-reality tourism. South America remains in its early stages, with Brazil deploying VR showrooms despite bandwidth constraints.
- Voxel Digital Studios Inc.
- Groove Jones LLC
- Innoactive GmbH
- Wevr Inc.
- Trigger XR Inc.
- Future Visual Ltd.
- Zengalt LLC
- Subvrsive Inc.
- REWIND FX Ltd.
- Visualise Creative Ltd.
- PixelWhip Studios Pty Ltd.
- CreamVR Inc.
- B2Studio Sp. z o.o.
- VR Vision Group LLC
- Lucid Reality Labs LLC
- Metastage Inc.
- The Virtual Reality Company Inc.
- Framestore Ltd.
- Felix and Paul Studios Inc.
- Magnopus LLC
Additional Benefits:
- The market estimate (ME) sheet in Excel format
- 3 months of analyst support
TABLE OF CONTENTS
1 INTRODUCTION
- 1.1 Study Assumptions and Market Definition
- 1.2 Scope of the Study
2 RESEARCH METHODOLOGY
3 EXECUTIVE SUMMARY
4 MARKET LANDSCAPE
- 4.1 Market Overview
- 4.2 Market Drivers
- 4.2.1 Proliferation of Affordable 6DoF VR Headsets
- 4.2.2 Corporate Upskilling Demand for Immersive Training Modules
- 4.2.3 Integration of AI-Driven Procedural Content Generation
- 4.2.4 Edge-Cloud Rendering Networks Reducing Latency
- 4.2.5 Expansion of 5G Standalone Networks Enabling Mobile VR Streaming
- 4.2.6 Government Subsidies for Metaverse Ecosystems in Emerging Asian Markets
- 4.3 Market Restraints
- 4.3.1 High Cost of Photorealistic Content Production Pipelines
- 4.3.2 Fragmented Platform Standards Hindering Asset Reusability
- 4.3.3 Limited Bandwidth in Rural Regions
- 4.3.4 Intensifying Concerns over Motion Sickness and User Safety
- 4.4 Industry Value Chain Analysis
- 4.5 Regulatory Landscape
- 4.6 Technological Outlook
- 4.7 Impact of Macroeconomic Factors
- 4.8 Porter's Five Forces Analysis
- 4.8.1 Threat of New Entrants
- 4.8.2 Bargaining Power of Suppliers
- 4.8.3 Bargaining Power of Buyers
- 4.8.4 Threat of Substitutes
- 4.8.5 Competitive Rivalry
5 MARKET SIZE AND GROWTH FORECASTS (VALUE)
- 5.1 By Service Type
- 5.1.1 3D Modeling and Animation
- 5.1.2 Interactive Application Development
- 5.1.3 360-Degree Video Production
- 5.1.4 360-Degree Photography
- 5.1.5 Post-Production Services
- 5.2 By Content Type
- 5.2.1 Entertainment
- 5.2.2 Training and Simulation
- 5.2.3 Marketing and Advertising
- 5.2.4 Education
- 5.2.5 Healthcare Visualization
- 5.2.6 Architecture and Real Estate Virtual Tours
- 5.3 By End-Use Industry
- 5.3.1 Media and Entertainment
- 5.3.2 Healthcare
- 5.3.3 Education
- 5.3.4 Retail and Ecommerce
- 5.3.5 Manufacturing
- 5.3.6 Real Estate and Construction
- 5.3.7 Tourism and Hospitality
- 5.4 By Platform
- 5.4.1 PC-Based VR
- 5.4.2 Mobile VR
- 5.4.3 Console VR
- 5.4.4 WebXR
- 5.5 By Geography
- 5.5.1 North America
- 5.5.1.1 United States
- 5.5.1.2 Canada
- 5.5.1.3 Mexico
- 5.5.2 Europe
- 5.5.2.1 Germany
- 5.5.2.2 United Kingdom
- 5.5.2.3 France
- 5.5.2.4 Italy
- 5.5.2.5 Rest of Europe
- 5.5.3 Asia-Pacific
- 5.5.3.1 China
- 5.5.3.2 Japan
- 5.5.3.3 India
- 5.5.3.4 South Korea
- 5.5.3.5 Australia
- 5.5.3.6 Rest of Asia-Pacific
- 5.5.4 Middle East and Africa
- 5.5.4.1 Middle East
- 5.5.4.1.1 Saudi Arabia
- 5.5.4.1.2 United Arab Emirates
- 5.5.4.1.3 Rest of Middle East
- 5.5.4.2 Africa
- 5.5.4.2.1 South Africa
- 5.5.4.2.2 Egypt
- 5.5.4.2.3 Rest of Africa
- 5.5.4.1 Middle East
- 5.5.5 South America
- 5.5.5.1 Brazil
- 5.5.5.2 Argentina
- 5.5.5.3 Rest of South America
- 5.5.1 North America
6 COMPETITIVE LANDSCAPE
- 6.1 Market Concentration
- 6.2 Strategic Moves
- 6.3 Market Share Analysis
- 6.4 Company Profiles (includes Global Level Overview, Market Level Overview, Core Segments, Financials as available, Strategic Information, Market Rank/Share for Key Companies, Products and Services, and Recent Developments)
- 6.4.1 Voxel Digital Studios Inc.
- 6.4.2 Groove Jones LLC
- 6.4.3 Innoactive GmbH
- 6.4.4 Wevr Inc.
- 6.4.5 Trigger XR Inc.
- 6.4.6 Future Visual Ltd.
- 6.4.7 Zengalt LLC
- 6.4.8 Subvrsive Inc.
- 6.4.9 REWIND FX Ltd.
- 6.4.10 Visualise Creative Ltd.
- 6.4.11 PixelWhip Studios Pty Ltd.
- 6.4.12 CreamVR Inc.
- 6.4.13 B2Studio Sp. z o.o.
- 6.4.14 VR Vision Group LLC
- 6.4.15 Lucid Reality Labs LLC
- 6.4.16 Metastage Inc.
- 6.4.17 The Virtual Reality Company Inc.
- 6.4.18 Framestore Ltd.
- 6.4.19 Felix and Paul Studios Inc.
- 6.4.20 Magnopus LLC
7 MARKET OPPORTUNITIES AND FUTURE OUTLOOK
- 7.1 White-Space and Unmet-Need Assessment

 VR行銷服務:市場佔有率分析、產業趨勢與統計、成長預測(2026-2031年)VR串流媒體:市佔率分析、產業趨勢與統計、成長預測(2026-2031年)
 虛擬實境(VR)內容市場:2026-2032年全球市場預測(按內容類型、設備類型、收入模式、分發平台和最終用戶分類)
 虛擬實境(VR)內容製作市場規模、佔有率和成長分析:按內容類型、技術、應用、最終用戶和地區分類-2026-2033年產業預測
 虛擬實境(VR)內容製作市場:按內容類型、組件、最終用戶和地區分類
 2026年全球虛擬內容製作市場報告VR內容製作市場:按組件、授權模式、最終用戶、部署方法和發行管道分類-2026年至2032年全球預測
 虛擬實境(VR)內容製作市場報告:按內容類型、組件、最終用戶和地區分類(2026-2034 年)
 虛擬偶像市場規模、佔有率和成長分析:按類型、技術、內容形式、獲利模式、目標受眾和地區分類——2026-2033年產業預測
 虛擬內容創作市場分析與預測(至2035年):類型、產品類型、服務、技術、組件、應用、設備、流程、最終用戶