


 |
市場調查報告書
商品編碼
2124940
自動販賣機:市場佔有率分析、產業趨勢與統計、成長預測(2026-2031)Vending Machine - Market Share Analysis, Industry Trends & Statistics, Growth Forecasts (2026 - 2031) |
||||||

※ 本網頁內容可能與最新版本有所差異。詳細情況請與我們聯繫。
根據 Mordor Intelligence 預測,自動販賣機市場規模將從 2025 年的 248.5 億美元成長到 2026 年的 261 億美元,然後在 2031 年達到 333.8 億美元,2026 年至 2031 年的複合年成長率為 5.04%。
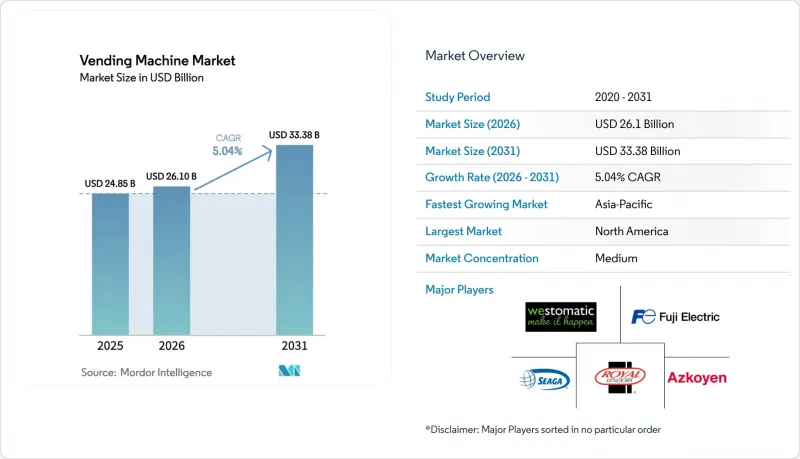
本報告按技術(自動化、半自動化、智慧/物聯網)、產品類型(零食和包裝食品、飲料、其他)、應用程式/地點(商業建築和辦公大樓、交通樞紐、教育機構、其他)、支付方式(現金、卡片式非現金支付、行動錢包/QR碼、其他)以及地區進行細分。市場預測以美元計價。
全球自動販賣機市場趨勢與洞察
人們對包裝食品和生鮮食品的需求日益成長,這些食品適合外出時食用。
隨著通勤者、上班族和學生將速度和便利性置於傳統零售商店之上,便利的食品服務持續推動全球自動販賣機市場的發展。根據美國勞工統計局數據顯示,1997年至2025年間,自動販賣機食品價格上漲了140.66%,其中2023年的漲幅尤為顯著,達到14.81%,凸顯了該品類強大的定價能力。東京一台由人工智慧驅動的沙拉自動販賣機能夠動態調整價格,以最大限度地減少損失並提高利潤率。營運商正利用預測需求模型,並針對每個位置最佳化庫存單位(SKU),以減少廢棄物並提高單位面積收益。此外,與氣調包裝(CA)供應商的合作,可以將生鮮食品的保存期限延長至五天,從而擴大交通樞紐和高等院校校園的商品種類。
無現金和非接觸式支付技術的迅速普及
全球自動販賣機市場的第二個利多因素是支付方式正穩步從硬幣和紙幣轉向「一觸即付」和QR碼支付,預計到2030年,這一趨勢將以12.65%的複合年成長率成長。 2024年,Cantaloupe在美洲和歐洲處理了超過115萬台連網終端,凸顯了規模經濟對支付現代化的支援作用。日本2024年7月的紙幣設計變更生動地展現了現有機器維修的複雜性。在維修時,僅有30%的自動販賣機完成了翻新,迫使營運商權衡升級成本與銷售影響。在印度,印度儲備銀行的2D碼硬幣試點項目,將數位錢包放置在人流量大的區域,表明新興市場可能正在跨越紙幣和硬幣時代,直接邁向數位支付。儘管 2-5% 的支付處理費給毛利率帶來了壓力,但企業透過提高平均客戶消費和減少與現金處理相關的管理費用來彌補成本。
大筆資本支出、安裝成本和維護成本
高昂的初始投資仍然是新進入全球自動販賣機市場的一大障礙。配備冷凍、視覺感測和多支付模組的現代化智慧終端所需的資本投入遠高於傳統的線圈式自動販賣機。營運商還需要預留預算用於升級以符合相關法規,例如軟體授權、通訊基礎設施和EMV-Co認證的讀卡機。原物料價格波動也是一大負擔。美國財政部發布的2024年銅價評估報告強調了投幣式自動販賣機利潤率面臨的壓力,預計2024年投幣式自動販賣機的交易量將佔總交易量的69.5%。許多新興市場收緊貸款標準,延長了投資回收期,迫使小規模業者推遲車輛升級。
細分市場分析
自動販賣機長期以來一直是全球自動販賣機市場的支柱,預計到2025年將佔據全球市場佔有率的55.12%。其廣泛的部署基礎提供了可預測的收入來源,但成長動力有限。同時,智慧/物聯網設備正以9.78%的複合年成長率成長,預示著經營模式將長期轉向以軟體為中心的模式。受連網設備驅動的全球自動販賣機市場規模預計將從2025年的79億美元成長到2031年的138.4億美元。這一成長將帶來來自雲端車隊管理儀錶板和程式化廣告的輔助收入,從而緩解硬體利潤率面臨的壓力。
專利申請格局也印證了創新潛力。可口可樂的微量成分管理專利實現了遠端口味調整,從而減少了服務呼叫次數。隨著行動資料通訊費用的下降,城區圖(planograms)正變得越來越具有商業性可行性。早期採用者報告稱,當人工智慧模組根據即時需求重新排列SKU位置時,銷售轉換率達到了兩位數。在此背景下,投資報酬率有限的半自動販賣機這種過渡模式正逐漸失去市場。
飲料仍將佔據核心地位,預計2025年將佔銷售額的32.85%。然而,由於永續發展法規的推動,反向自動販賣機正經歷最快的成長,複合年成長率(CAGR)高達10.71%。隨著押金制度在更多地區成為強制性要求,預計到2031年,反向自動販賣機在全球自動販賣機市場的佔有率將增加兩倍。雖然銷售傳統零食和包裝食品的自動販賣機仍然是人們用餐的重要組成部分,但對鹽和糖含量的監管要求促使企業重新評估產品線。個人防護工具(PPE)和行動電話配件等非食品消費品已不再是小眾市場,價格彈性抵消了銷售下降的影響。
TOMRA每年回收480億個容器,這一事實清楚地表明,規模化營運如何提升廢棄物管理的經濟效益。到了2025年,歐盟多家雜貨店已安裝店內壓縮機,透過降低迴收流程的物流成本,提高投資報酬率(ROI)。同時,在東京,一家由人工智慧驅動的生鮮食品銷售部門已證明,它能夠利用動態定價引擎克服生鮮食品庫存下降的不利影響,這證實了進一步豐富菜單的有效性。
區域分析
北美憑藉著廣泛的寬頻和卡片付款基礎設施,預計到2025年將佔全球自動販賣機銷售額的32.74%。在美國,為優先落實疫情後的衛生措施,政府大樓內已安裝了非接觸式個人防護工具(PPE)分送器。同時,在加拿大,為降低碳排放目標,政府正在推動冷凍設施的維修,以提高能源效率。墨西哥雖然市場規模較小,但隨著主要飲料生產商為即將到來的生產者責任召回(EPR)法規做準備,該國正在擴大反向自動販賣機試點計畫。人事費用的上升正在加速這三個市場自動化技術的普及,儘管面臨市場成熟帶來的壓力,但成長率仍保持在個位數中段水準。
亞太地區預計將以9.86%的複合年成長率(CAGR)領跑,都市區化進程和行動支付的普及將顯著擴大全球自動販賣機市場規模。在中國,重視QR碼的消費文化正在加速智慧型裝置的普及;而在日本,紙幣和硬幣設計的變化導致70%的舊機器暫時無法使用。泰國的「淘寶」網路每天透過6000個終端售出20萬瓶飲料,是勞動力替代經濟影響的典型例證。印度儲備銀行的2D碼硬幣計劃表明,政府主導推動小規模零售支付現代化。
歐洲的進展更為穩健,這得益於監管的支持。英國的2027年押金返還計畫正在擴大反向自動販賣機的安裝範圍,而德國不來梅機場於2025年6月開設了一家配備人工智慧監控的自主商店。斯堪地那維亞企業已基本實現無現金支付,現在正向企業園區銷售符合ESG(環境、社會和治理)標準的零食產品。南歐在行動錢包的普及方面落後於歐洲,但透過在機場和火車站等旅遊相關場所推廣行動錢包,正在迎頭趕上,並保持中等個位數的較高成長率。
其他好處
- Excel格式的市場預測(ME)表
- 3個月的分析師支持
目錄
第1章:引言
- 研究假設和市場定義
- 調查範圍
第2章:調查方法
第3章執行摘要
第4章 市場狀況
- 市場概覽
- 市場促進因素
- 人們對包裝食品和生鮮食品的需求日益成長,這些食品適合外出時食用。
- 無現金和非接觸式支付技術的迅速普及
- 引入物聯網智慧販賣機用於預測性維護。
- 生產者延伸責任制(EPR)法規正在促進反向彎曲機的普及。
- 透過職場。
- 地方醫療保健網路中的藥品和個人防護工具(PPE)自動販賣系統
- 市場限制因素
- 大筆資本支出、安裝成本和維護成本
- 大眾運輸工具中含糖飲料和卡路里含量的限制
- 連網裝置的網路安全與資料隱私風險
- 對某些公共區域的衛生和破壞行為感到擔憂
- 價值鏈分析
- 監理情勢
- 技術展望
- 波特五力分析
- 永續性和循環經濟分析
- 市場宏觀經濟趨勢的評估
第5章 市場規模與成長預測
- 透過技術
- 自動販賣機
- 半自動販賣機
- 智慧/物聯網自動販賣機
- 依產品類型
- 零食和包裝食品
- 飲料
- 菸草和尼古丁產品
- 非食品必需品(個人防護裝備、電子設備、個人護理用品)
- 反向彎曲機(回收利用)
- 按應用程式/安裝位置
- 商業大樓和辦公大樓
- 交通樞紐(機場、鐵路、公車、地鐵)
- 教育機構
- 醫療機構
- 飯店和休閒設施
- 工業和製造設施
- 其他(住宅、購物中心)
- 透過付款方式
- 現金
- 卡片式的非現金支付(信用卡、簽帳金融卡、NFC)
- 行動錢包/QR碼
- 生物識別/臉部認證
- 按地區
- 北美洲
- 美國
- 加拿大
- 墨西哥
- 歐洲
- 德國
- 英國
- 法國
- 義大利
- 西班牙
- 俄羅斯
- 其他歐洲國家
- 亞太地區
- 中國
- 日本
- 印度
- 韓國
- 澳洲
- 其他亞太國家
- 南美洲
- 巴西
- 阿根廷
- 其他南美國家
- 中東
- 沙烏地阿拉伯
- 阿拉伯聯合大公國
- 土耳其
- 其他中東國家
- 非洲
- 南非
- 奈及利亞
- 其他非洲地區
- 北美洲
第6章 競爭情勢
- 市場集中度分析
- 策略舉措和趨勢
- 市佔率分析
- 公司簡介
- Fuji Electric Co., Ltd.
- Crane Merchandising Systems(Crane NXT)
- Azkoyen Group
- Evoca Group
- SandenVendo GmbH
- Westomatic Vending Services Ltd.
- Royal Vendors, Inc.
- Seaga Manufacturing, Inc.
- Jofemar SA
- Selecta Group
- Cantaloupe Inc.(USA Technologies)
- 365 Retail Markets LLC
- TCN Vending Machine Co., Ltd.
- Guangzhou Baoda Intelligent Technology Co., Ltd.
- Daalchini Technologies Pvt. Ltd.
- Canteen Vending Services(Compass Group)
- Aramark Corporation
- FAS International SpA
- Vending.com(Federal Machine Corp.)
- Vendekin Technologies Pvt. Ltd.
第7章 市場機會與未來展望
According to Mordor Intelligence, the vending machine market size is expected to grow from USD 24.85 billion in 2025 to USD 26.1 billion in 2026 and is forecast to reach USD 33.38 billion by 2031 at 5.04% CAGR over 2026-2031.
This report is Segmented by Technology (Automatic, Semi-Automatic, and Smart/IoT-Enabled), Product Type (Snacks and Packaged Food, Beverages, and More), Application (Commercial Buildings and Offices, Transportation Hubs, Educational Institutions, and More), Payment Mode (Cash, Card-Based Cashless, Mobile Wallet and QR, and More), and Geography. The Market Forecasts are Provided in Terms of Value (USD).
Global Vending Machine Market Trends and Insights
Increasing Demand for Packaged and Fresh Food for On-the-Go Consumption
Food-service convenience continues to lift the global vending machine market as commuters, office staff, and students prioritize speed and accessibility over traditional retail. The U.S. Bureau of Labor Statistics recorded a 140.66% jump in vending-food prices between 1997 and 2025, with a notable 14.81% increase in 2023, confirming the category's pricing power. Tokyo's AI-equipped salad units adjust prices dynamically to minimize shrinkage and elevate margins. Operators overlay predictive-demand models that fine-tune SKUs by micro-location, cutting waste and boosting revenue per square foot. Partnerships with controlled-atmosphere-packaging suppliers now make fresh produce viable for five-day shelf lives, broadening product scope at transportation hubs and higher-education campuses.
Rapid Adoption of Cashless and Contactless Payment Technologies
A second tailwind for the global vending machine market is the steady replacement of coins and bills with tap-and-go or QR-based options, advancing 12.65% CAGR through 2030. Cantaloupe processed more than 1.15 million connected endpoints across the Americas and Europe in 2024, underscoring scale economics behind payment modernization. Japan's July 2024 banknote redesign illustrates the retro-fit complexity: only 30% of machines were reconfigured at launch, forcing operators to weigh upgrade costs against possible sales disruption. In India, the Reserve Bank's QR-coin pilot places digital wallets at high-footfall locations, an early indication that emerging markets may leapfrog physical cash. Although processor fees of 2-5% compress gross margins, operators recoup value via higher average tickets and lower cash-handling overhead.
High Capital, Installation, and Maintenance Expenditures
Up-front investment remains a gating factor for new entrants to the global vending machine market. Modern smart units with refrigeration, vision sensing, and multi-payment modules require meaningfully higher capital outlays than legacy coil machines. Operators must also budget for software licences, connectivity, and regulatory compliance upgrades such as EMV-co-certified readers. Raw-material volatility adds further strain; the U.S. Department of the Treasury's 2024 copper cost review highlighted margin pressure on coin mechanisms that still serve 69.5% of 2024 transactions. Tight lending standards in many emerging economies elongate payback periods, causing smaller route owners to defer fleet renewal.
Other drivers and restraints analyzed in the detailed report include:
- Deployment of IoT-Enabled Smart Vending Fleets for Predictive Maintenance
- Extended-Producer-Responsibility Rules Spurring Reverse-Vending Installations
- Cyber-Security and Data-Privacy Risks for Connected Machines
For complete list of drivers and restraints, kindly check the Table Of Contents.
Segment Analysis
Automatic machines, long the workhorse of the global vending machine market, held 55.12% global vending machine market share in 2025. Their wide installed base anchors predictable revenue but offers fewer upside levers. Smart/IoT units, meanwhile, are scaling at a 9.78% CAGR, signaling a secular shift toward software-centric business models. The global vending machine market size attributed to connected machines is projected to expand from USD 7.9 billion in 2025 to USD 13.84 billion by 2031. This growth unlocks ancillary revenue for cloud-based fleet dashboards and programmatic advertising, cushioning hardware margin compression.
Patent filings corroborate the innovation runway. Coca-Cola's micro-ingredient management patents enable remote flavor tweaks, lowering service calls. Algorithmic planograms that localize assortments at street-block granularity are hitting commercial viability as cellular data prices fall. Early adopters report double-digit upticks in sales conversion when AI modules reorder the SKU face according to real-time demand. Against that backdrop, semi-automatic machines are tapering as a transitional form factor with limited ROI.
Beverages remained kingpin at 32.85% of 2025 revenues; nevertheless, sustainability legislation positions reverse-vending machines as the fastest clip at 10.71% CAGR. Their contribution to global vending machine market size is forecast to triple by 2031 as more jurisdictions introduce mandatory deposit schemes. Traditional snack and packaged-food machines continue to serve core meal occasions, yet salt- and sugar-content regulations require portfolio revamps. Non-food essentials-think PPE and phone accessories-are no longer niche, aided by price elasticity that offsets lower volume throughput.
TOMRA's 48 billion annual container capture underscores how scale addresses waste-management economics. During 2025, several EU grocers integrated on-site compactors, pulling logistics costs out of the return loop and raising operator ROI. Parallel to that, AI-driven fresh-food units in Tokyo are proving that perishables can beat shrinkage headwinds with dynamic pricing engines, validating broader menu diversification.
Complete Report Scope:
- By Technology
- Automatic Vending Machines
- Semi-Automatic Vending Machines
- Smart / IoT-Enabled Vending Machines
- By Product Type
- Snacks and Packaged Food
- Beverages
- Tobacco and Nicotine Products
- Non-Food Essentials (PPE, Electronics, Personal Care)
- Reverse Vending Machines (Recycling)
- By Application / Deployment Location
- Commercial Buildings and Offices
- Transportation Hubs (Airports, Rail, Bus, Metro)
- Educational Institutions
- Healthcare Facilities
- Hospitality and Leisure Venues
- Industrial and Manufacturing Sites
- Others (Residential, Retail Malls)
- By Payment Mode
- Cash
- Card-Based Cashless (Credit/Debit, NFC)
- Mobile Wallet and QR
- Biometric and Facial Recognition
- By Geography
- North America
- United States
- Canada
- Mexico
- Europe
- Germany
- United Kingdom
- France
- Italy
- Spain
- Russia
- Rest of Europe
- Asia-Pacific
- China
- Japan
- India
- South Korea
- Australia
- Rest of Asia-Pacific
- South America
- Brazil
- Argentina
- Rest of South America
- Middle East
- Saudi Arabia
- UAE
- Turkey
- Rest of Middle East
- Africa
- South Africa
- Nigeria
- Rest of Africa
- North America
Geography Analysis
North America accounted for 32.74% of 2025 global vending machine market revenue, leveraging ubiquitous broadband and card-payments infrastructure. The United States channeled post-pandemic hygiene priorities into contact-free PPE dispensers across government buildings, while Canada's carbon-reduction targets incentivized energy-efficient refrigeration retrofits. Mexico, though smaller, is scaling reverse-vending pilots as beverage majors prepare for anticipated EPR laws. Labor-cost inflation hastens automation uptake across all three markets, sustaining mid-single-digit growth despite maturity pressures.
Asia-Pacific registered the highest 9.86% CAGR outlook, adding critical mass to the global vending machine market through urban migration and mobile money ubiquity. China's QR-first consumer culture accelerates smart-unit penetration, while Japan wrestles with currency redesigns that have rendered 70% of older machines temporarily non-compliant. Thailand's Tao Bin network sells 200,000 drinks daily via 6,000 machines, a poster child for labor substitution economics. India's Reserve Bank QR-coin initiative signals a state-sponsored push to modernize micro-retail payments.
Europe's trajectory is steadier but underpinned by regulatory catalysts. The UK's 2027 Deposit Return Scheme ramps reverse-vending installations, while Germany's Bremen Airport opened an AI-policed autonomous store in June 2025. Scandinavian operators, already largely cashless, now market ESG-compliant snack lines to corporate campuses. Southern Europe lags on mobile-wallet density yet catches up via tourism-linked deployments in airports and railway stations, ensuring the region maintains a high-single-digit growth clip.
- Fuji Electric Co., Ltd.
- Crane Merchandising Systems (Crane NXT)
- Azkoyen Group
- Evoca Group
- SandenVendo GmbH
- Westomatic Vending Services Ltd.
- Royal Vendors, Inc.
- Seaga Manufacturing, Inc.
- Jofemar S.A.
- Selecta Group
- Cantaloupe Inc. (USA Technologies)
- 365 Retail Markets LLC
- TCN Vending Machine Co., Ltd.
- Guangzhou Baoda Intelligent Technology Co., Ltd.
- Daalchini Technologies Pvt. Ltd.
- Canteen Vending Services (Compass Group)
- Aramark Corporation
- FAS International S.p.A.
- Vending.com (Federal Machine Corp.)
- Vendekin Technologies Pvt. Ltd.
Additional Benefits:
- The market estimate (ME) sheet in Excel format
- 3 months of analyst support
TABLE OF CONTENTS
1 INTRODUCTION
- 1.1 Study Assumptions and Market Definition
- 1.2 Scope of the Study
2 RESEARCH METHODOLOGY
3 EXECUTIVE SUMMARY
4 MARKET LANDSCAPE
- 4.1 Market Overview
- 4.2 Market Drivers
- 4.2.1 Increasing demand for packaged and fresh food for on-the-go consumption
- 4.2.2 Rapid adoption of cashless and contactless payment technologies
- 4.2.3 Deployment of IoT-enabled smart vending fleets for predictive maintenance
- 4.2.4 Extended-producer-responsibility rules spurring reverse-vending installations
- 4.2.5 Workplace ESG targets boosting healthy and sustainable vending offerings
- 4.2.6 Medicine and PPE vending in rural healthcare networks
- 4.3 Market Restraints
- 4.3.1 High capital, installation and maintenance expenditures
- 4.3.2 Sugary-drink and calorie restrictions in public institutions
- 4.3.3 Cyber-security and data-privacy risks for connected machines
- 4.3.4 Hygiene and vandalism concerns in certain public areas
- 4.4 Value Chain Analysis
- 4.5 Regulatory Landscape
- 4.6 Technological Outlook
- 4.7 Porter's Five Forces Analysis
- 4.7.1 Threat of New Entrants
- 4.7.2 Bargaining Power of Buyers
- 4.7.3 Bargaining Power of Suppliers
- 4.7.4 Threat of Substitutes
- 4.7.5 Competitive Rivalry
- 4.8 Sustainability and Circular-Economy Analysis
- 4.9 Assessment of Macro Economic Trends on the Market
5 MARKET SIZE AND GROWTH FORECASTS (VALUES)
- 5.1 By Technology
- 5.1.1 Automatic Vending Machines
- 5.1.2 Semi-Automatic Vending Machines
- 5.1.3 Smart / IoT-Enabled Vending Machines
- 5.2 By Product Type
- 5.2.1 Snacks and Packaged Food
- 5.2.2 Beverages
- 5.2.3 Tobacco and Nicotine Products
- 5.2.4 Non-Food Essentials (PPE, Electronics, Personal Care)
- 5.2.5 Reverse Vending Machines (Recycling)
- 5.3 By Application / Deployment Location
- 5.3.1 Commercial Buildings and Offices
- 5.3.2 Transportation Hubs (Airports, Rail, Bus, Metro)
- 5.3.3 Educational Institutions
- 5.3.4 Healthcare Facilities
- 5.3.5 Hospitality and Leisure Venues
- 5.3.6 Industrial and Manufacturing Sites
- 5.3.7 Others (Residential, Retail Malls)
- 5.4 By Payment Mode
- 5.4.1 Cash
- 5.4.2 Card-Based Cashless (Credit/Debit, NFC)
- 5.4.3 Mobile Wallet and QR
- 5.4.4 Biometric and Facial Recognition
- 5.5 By Geography
- 5.5.1 North America
- 5.5.1.1 United States
- 5.5.1.2 Canada
- 5.5.1.3 Mexico
- 5.5.2 Europe
- 5.5.2.1 Germany
- 5.5.2.2 United Kingdom
- 5.5.2.3 France
- 5.5.2.4 Italy
- 5.5.2.5 Spain
- 5.5.2.6 Russia
- 5.5.2.7 Rest of Europe
- 5.5.3 Asia-Pacific
- 5.5.3.1 China
- 5.5.3.2 Japan
- 5.5.3.3 India
- 5.5.3.4 South Korea
- 5.5.3.5 Australia
- 5.5.3.6 Rest of Asia-Pacific
- 5.5.4 South America
- 5.5.4.1 Brazil
- 5.5.4.2 Argentina
- 5.5.4.3 Rest of South America
- 5.5.5 Middle East
- 5.5.5.1 Saudi Arabia
- 5.5.5.2 UAE
- 5.5.5.3 Turkey
- 5.5.5.4 Rest of Middle East
- 5.5.6 Africa
- 5.5.6.1 South Africa
- 5.5.6.2 Nigeria
- 5.5.6.3 Rest of Africa
- 5.5.1 North America
6 COMPETITIVE LANDSCAPE
- 6.1 Market Concentration Analysis
- 6.2 Strategic Moves and Developments
- 6.3 Market Share Analysis
- 6.4 Company Profiles (includes Global overview, Market overview, Core segments, Financials as available, Strategic info, Market rank/share, Products and services, Recent developments)
- 6.4.1 Fuji Electric Co., Ltd.
- 6.4.2 Crane Merchandising Systems (Crane NXT)
- 6.4.3 Azkoyen Group
- 6.4.4 Evoca Group
- 6.4.5 SandenVendo GmbH
- 6.4.6 Westomatic Vending Services Ltd.
- 6.4.7 Royal Vendors, Inc.
- 6.4.8 Seaga Manufacturing, Inc.
- 6.4.9 Jofemar S.A.
- 6.4.10 Selecta Group
- 6.4.11 Cantaloupe Inc. (USA Technologies)
- 6.4.12 365 Retail Markets LLC
- 6.4.13 TCN Vending Machine Co., Ltd.
- 6.4.14 Guangzhou Baoda Intelligent Technology Co., Ltd.
- 6.4.15 Daalchini Technologies Pvt. Ltd.
- 6.4.16 Canteen Vending Services (Compass Group)
- 6.4.17 Aramark Corporation
- 6.4.18 FAS International S.p.A.
- 6.4.19 Vending.com (Federal Machine Corp.)
- 6.4.20 Vendekin Technologies Pvt. Ltd.
7 MARKET OPPORTUNITIES AND FUTURE OUTLOOK
- 7.1 White-Space and Unmet-Need Assessment
- 7.2 Forecast of Technology Convergence and New Business Models

 智慧自動販賣機食品解決方案市場預測至2034年-全球分析(按產品類型、技術整合、安裝位置、經營模式、食品類別創新、消費者細分和區域分類)
 連網自動販賣機:市場佔有率分析、產業趨勢與統計及成長預測(2026-2031 年)北美和歐洲自動販賣機:市場佔有率分析、行業趨勢和統計數據以及成長預測(2026-2031 年)醫療自動販賣機:市場佔有率分析、產業趨勢與統計、成長預測(2026-2031)
 零售自動販賣機市場-2026-2032年全球市場預測
 全球冷藏自動販賣機市場規模、佔有率、趨勢和成長分析報告(2026-2034)
 2026-2030年全球自動販賣機市場
 2026年全球生牛奶起司旅遊市場報告
 零售自動販賣機市場規模、佔有率和成長分析:按型號、產品類型、安裝類型、所有權模式、最終用戶和地區分類-2026-2033年產業預測
 酒精自動販賣機市場-全球產業規模、佔有率、趨勢、機會和預測(按技術類型、最終用戶、地區和競爭格局分類,2021-2031年)