


 |
市場調查報告書
商品編碼
1683175
LNG 市場:市場佔有率分析、產業趨勢與統計、成長預測(2025-2030 年)LNG - Market Share Analysis, Industry Trends & Statistics, Growth Forecasts (2025 - 2030) |
||||||
價格
※ 本網頁內容可能與最新版本有所差異。詳細情況請與我們聯繫。
簡介目錄
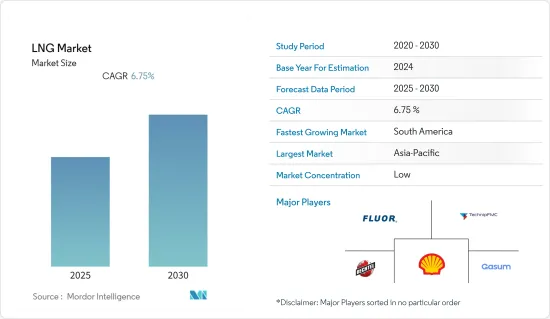
預測期內,液化天然氣市場預計將以 6.75% 的複合年成長率成長。
2020年,新冠疫情對市場產生了負面影響。目前市場已恢復至疫情前的水準。
關鍵亮點
- 從中期來看,預計天然氣發電需求增加和液化天然氣燃料船舶數量增加等因素將在預測期內推動全球液化天然氣市場的發展。
- 另一方面,預計預測期內液化天然氣供應過剩和貿易緊張局勢將阻礙市場成長。
- 液化天然氣市場是一個新興市場,因為對液化天然氣的需求不斷成長,預計未來幾年將提案許多液化天然氣計劃和發展計劃,為非洲地區的市場相關人員創造許多機會。
液化天然氣(LNG)市場趨勢
液化行業佔據市場主導地位
- 過去十年,工業化和都市化進程大幅加快,導致全球二氧化碳和溫室氣體排放量激增。因此,為了減少二氧化碳和溫室氣體的排放,世界各國政府都在推動使用天然氣作為發電和汽車的燃料。
- 因此,世界各國政府正在製定各種支持措施,鼓勵CNG和LNG燃料汽車的普及,包括對汽車製造商和消費者提供補貼和免稅。
- 過去十年,由於各地區需求不斷成長,全球天然氣消費量不斷增加。例如,2012年的天然氣消費量約為3,3,194億立方米,但到2021年將增加21%以上至4,3,750億立方米。
- 根據《2022年全球液化天然氣報告》,液化天然氣連接40個進口國和19個出口市場。 2021年全球液化量將從上年的2,000萬噸/年增加690萬噸/年,達到4.599億噸/年。非洲巨大的液化天然氣潛力對該地區的發展至關重要,目前有 1.239 億噸/年的液化天然氣提案正在等待最終投資決定(FID)。
- 此外,PFLNG Dua(1.5 MTPA)、Corpus Christi T3(4.5 MTPA)和 Yamal LNG T4(0.9 MTPA)是於 2021 年投入運作的液化計劃。 2022 年頭四個月又增加了 12.5 MTPA 的液化能力,使全球液化總合能力增至 472.4 MTPA。因此,預計液化能力的增加和液化計劃的建立將在預測期內產生對液化行業的需求。
- 因此,基於上述因素,預計液化部門將在預測期內主導液化天然氣市場。
亞太地區佔市場主導地位
- 亞太地區仍然是主要的進口地區,其在全球液化天然氣進口中的佔有率從去年的 72% 增加到 2019 年的 69%。去年亞洲液化天然氣進口量成長7.7%,達3,718億立方公尺。除日本、印度、馬來西亞和新加坡外,所有亞太國家的進口均增加。
- 根據《2022 年全球液化天然氣報告》,最大的出口地區仍是亞太地區,去年出口總合1.312 億噸,與 2020 年出口量持平。
- 中國是亞太地區最大的液化天然氣進口國,進口量增幅最大,較去年同期成長16.8%,去年進口量達1,095億立方公尺。此外,世界各國政府都推出了支持天然氣消費的政策,其中包括多個液化天然氣計劃。
- 此外,江蘇華電燕崖液化LNG接收站將於 2023 年 2 月在中國東部江蘇省利安克萊爾市燕崖港開工。該計劃被納入國家天然氣發展規劃和能源部「十四五」規劃,設計液化天然氣接收能力為300萬噸/年。該計劃是聯邦政府核准的2022年四個液化天然氣接收計劃之一,總接收量約為每年2,400萬噸。
- 因此,由於上述因素,預計亞太地區將在預測期內主導全球液化天然氣市場。
液化天然氣(LNG)產業概況
液化天然氣市場是細分的。主要參與企業(不分先後順序)包括 Fluor Corporation、TechnipFMC PLC、Bechtel Corporation、Shell PLC 和 Gasum AS。
其他福利
- Excel 格式的市場預測 (ME) 表
- 3 個月的分析師支持
目錄
第 1 章 簡介
- 研究範圍
- 市場定義
- 調查前提
第 2 章執行摘要
第3章調查方法
第4章 市場概況
- 介紹
- 2028 年市場規模與需求預測(十億美元)
- 最新趨勢和發展
- 政府法規和政策
- 市場動態
- 驅動程式
- 限制因素
- 供應鏈分析
- 產業吸引力-波特五力分析
- 供應商的議價能力
- 消費者議價能力
- 新進入者的威脅
- 替代品的威脅
- 競爭對手之間的競爭強度
第5章 市場區隔
- 液化天然氣基礎設施
- LNG液化工廠
- LNG 再氣化設施
- 液化天然氣運輸
- 液化天然氣貿易
- 地區
- 北美洲
- 美國
- 加拿大
- 墨西哥
- 北美其他地區
- 歐洲
- 德國
- 英國
- 法國
- 歐洲其他地區
- 亞太地區
- 中國
- 韓國
- 日本
- 其他亞太地區
- 南美洲
- 巴西
- 阿根廷
- 南美洲其他地區
- 中東和非洲
- 阿拉伯聯合大公國
- 沙烏地阿拉伯
- 其他中東和非洲地區
- 北美洲
第6章 競爭格局
- 併購、合資、合作、協議
- 主要企業策略
- 公司簡介
- LNG基礎設施公司(營運商和EPC公司)
- JGC Holdings Corporation
- Chiyoda Corporation
- Bechtel Corporation
- Technip FMC PLC
- Fluor Corporation
- LNG燃料庫公司和公司
- Shell PLC
- Gasum AS
- ENN Energy Holdings Ltd.
- Engie SA
- Gazpromneft Marine Bunker LLC
- LNG基礎設施公司(營運商和EPC公司)
第7章 市場機會與未來趨勢
簡介目錄
Product Code: 57149
The LNG Market is expected to register a CAGR of 6.75% during the forecast period.
In 2020, COVID-19 had a detrimental effect on the market. Presently, the market has reached pre-pandemic levels.
Key Highlights
- Over the medium term, factors such as increasing demand for gas power generation and a rising number of LNG-fueled fleets are expected to drive the global LNG market during the forecast period.
- On the other hand, LNG oversupply and trade tension are expected to hamper market growth during the forecast period.
- Nevertheless, a high number of LNG projects and development plans are expected to be proposed in the upcoming years, underpinned by the growing LNG demand, leading to the creation of several opportunities for market players in the African region, thus creating an emerging LNG market.
Liquefied Natural Gas (LNG) Market Trends
Liquefaction Sector to Dominate the Market
- In the last decade, there has been a significant rise in industrialization and urbanization, which has resulted in a surge in carbon dioxide and greenhouse gases worldwide. Thus, to reduce carbon and greenhouse gas emissions, governments are promoting the utilization of natural gas in power generation and fuel in vehicles.
- Thus, governments are developing various supportive policies to increase the adoption of CNG and LNG-based vehicles, including providing subsidies and tax exemptions to automobile manufacturers and consumers.
- The growing demand for natural gas across the regions resulted in increased natural gas consumption in the last decade across the globe. For instance, in 2012, natural gas consumption was around 3,319.4 billion cubic meters, which increased by more than 21% in 2021 to about 4,037.5 billion cubic meters.
- According to the World LNG Report 2022, LNG connected 40 importing countries with 19 export markets. The global liquefaction capacity accounted for 459.9 MTPA in 2021 after adding 6.9 MTPA, compared to 20 MTPA the year prior. The great potential for LNG in Africa is significant to the region's development, with 123.9 MTPA of proposed liquefaction waiting for the final investment decision (FID).
- Additionally, PFLNG Dua (1.5 MTPA), Corpus Christi T3 (4.5 MTPA), and Yamal LNG T4 (0.9 MTPA) were the liquefaction projects that came online in 2021. During the first four months of 2022, an additional 12.5 MTPA of liquefaction capacity was added, increasing the total global liquefaction capacity to 472.4 MTPA. Thus, the increasing liquefaction capacity, as well as the establishment of liquefaction projects, are expected to create demand for the liquefaction sector in the forecast period.
- Therefore, based on the above-mentioned factors, the liquefaction sector is expected to dominate the LNG market during the forecast period.
Asia-Pacific to Dominate the Market
- Asia-Pacific continued to be the leading importing region, with a 72% share of global LNG imports last year, up from 69% in 2019. Asian LNG imports grew by 7.7% last year, reaching 371.8 billion cubic meters. Imports rose in all Asia-Pacific countries except Japan, India, Malaysia, and Singapore.
- According to the World LNG Report 2022, the largest exporting region continued to be Asia-Pacific, with a total of 131.2 MT of exports last year, in line with what was exported in 2020.
- China, being the largest LNG importer in Asia-Pacific, experienced the greatest growth in terms of imported volumes, with an annual growth rate of 16.8%, accounting for 109.5 billion cubic meters last year. Additionally, governments also adopted supportive policies for natural gas consumption, which include several LNG projects.
- Furthermore, in February 2023, Jiangsu Huadian Ganyu LNG terminal construction began at Ganyu port in Lianyungang, China's eastern Jiangsu province. The project is included in both the national natural gas development plan and the province's 14th Five-Year Plan, with a designed LNG receiving capacity of 3 million mt/year. The project is one of four LNG-receiving projects approved by the federal government for 2022, with a total capacity of almost 24 million metric tons per year.
- Therefore, based on the above-mentioned factors, Asia-Pacific is expected to dominate the global LNG market during the forecast period.
Liquefied Natural Gas (LNG) Industry Overview
The LNG market is fragmented. Some of the major players (not in a particular order) include Fluor Corporation, TechnipFMC PLC, Bechtel Corporation, Shell PLC, and Gasum AS.
Additional Benefits:
- The market estimate (ME) sheet in Excel format
- 3 months of analyst support
TABLE OF CONTENTS
1 INTRODUCTION
- 1.1 Scope of the Study
- 1.2 Market Definition
- 1.3 Study Assumptions
2 EXECUTIVE SUMMARY
3 RESEARCH METHODOLOGY
4 MARKET OVERVIEW
- 4.1 Introduction
- 4.2 Market Size and Demand Forecast in USD billion, till 2028
- 4.3 Recent Trends and Developments
- 4.4 Government Policies and Regulations
- 4.5 Market Dynamics
- 4.5.1 Drivers
- 4.5.2 Restraints
- 4.6 Supply Chain Analysis
- 4.7 Industry Attractiveness - Porter's Five Forces Analysis
- 4.7.1 Bargaining Power of Suppliers
- 4.7.2 Bargaining Power of Consumers
- 4.7.3 Threat of New Entrants
- 4.7.4 Threat of Substitute Products and Services
- 4.7.5 Intensity of Competitive Rivalry
5 MARKET SEGMENTATION
- 5.1 LNG Infrastructure
- 5.1.1 LNG Liquefaction Plants
- 5.1.2 LNG Regasification Facilities
- 5.1.3 LNG Shipping
- 5.2 LNG Trade
- 5.3 Geography
- 5.3.1 North America
- 5.3.1.1 United States
- 5.3.1.2 Canada
- 5.3.1.3 Mexico
- 5.3.1.4 Rest of the North America
- 5.3.2 Europe
- 5.3.2.1 Germany
- 5.3.2.2 United Kingdom
- 5.3.2.3 France
- 5.3.2.4 Rest of the Europe
- 5.3.3 Asia-Pacific
- 5.3.3.1 China
- 5.3.3.2 South Korea
- 5.3.3.3 Japan
- 5.3.3.4 Rest of the Asia-Pacific
- 5.3.4 South America
- 5.3.4.1 Brazil
- 5.3.4.2 Argentina
- 5.3.4.3 Rest of the South America
- 5.3.5 Middle-East and Africa
- 5.3.5.1 United Arab Emirates
- 5.3.5.2 Saudi Arabia
- 5.3.5.3 Rest of the Middle-East and Africa
- 5.3.1 North America
6 COMPETITIVE LANDSCAPE
- 6.1 Mergers and Acquisitions, Joint Ventures, Collaborations, and Agreements
- 6.2 Strategies Adopted by Leading Players
- 6.3 Company Profiles
- 6.3.1 LNG Infrastructure Companies (Operators and EPC Companies)
- 6.3.1.1 JGC Holdings Corporation
- 6.3.1.2 Chiyoda Corporation
- 6.3.1.3 Bechtel Corporation
- 6.3.1.4 Technip FMC PLC
- 6.3.1.5 Fluor Corporation
- 6.3.2 LNG Bunkering and Trading Companies
- 6.3.2.1 Shell PLC
- 6.3.2.2 Gasum AS
- 6.3.2.3 ENN Energy Holdings Ltd.
- 6.3.2.4 Engie SA
- 6.3.2.5 Gazpromneft Marine Bunker LLC
- 6.3.1 LNG Infrastructure Companies (Operators and EPC Companies)
7 MARKET OPPORTUNITIES AND FUTURE TRENDS
02-2729-4219
+886-2-2729-4219
 生物液化天然氣市場 - 全球及區域分析:按應用、產地及地區 - 分析與預測(2025-2034)
 車用液化天然氣市場 - 全球產業規模、佔有率、趨勢、機會和預測,按車輛類型、按最終用戶產業、按液化天然氣儲存和基礎設施、按地區和競爭進行細分,2020-2030 年預測2025年液化天然氣(LNG)基礎設施全球市場報告
 2025 年至 2033 年按技術(液化、再氣化)、最終用途產業(住宅、商業、工業)及地區分類的液化天然氣市場規劃
 全球液化天然氣引擎市場研究報告 - 產業分析、規模、佔有率、成長、趨勢和預測 2025 年至 2033 年2025 年液化天然氣壓縮機全球市場報告2025 年液化天然氣全球市場報告
 液化天然氣 (LNG),全球市場 2025-2029
 液化天然氣市場:依應用、地區
 液化天然氣市場、規模、佔有率、趨勢、行業分析報告:依應用和地區 - 市場預測2025-2034
▼