


 |
市場調查報告書
商品編碼
1683540
全球廢棄物管理設備 -市場佔有率分析、行業趨勢和統計、成長預測(2025-2030 年)Global Waste Management Equipment - Market Share Analysis, Industry Trends & Statistics, Growth Forecasts (2025 - 2030) |
||||||
※ 本網頁內容可能與最新版本有所差異。詳細情況請與我們聯繫。
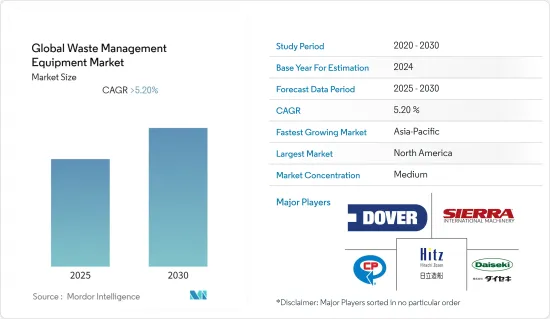
預測期內,全球廢棄物管理設備市場預計將以超過 5.2% 的複合年成長率成長。
COVID-19 從細分領域重點轉移的角度對廢棄物管理行業產生了影響;在封鎖期間,由於工業和辦公室部分或全部關閉,住宅部分產生的廢棄物比工業和商業中心更多。由於製造業活動放緩,工業廢棄物和商業廢棄物產量大幅下降。由於製藥和醫療保健行業的排放增加,危險廢棄物排放也增加。新冠疫情促使歐盟成員國採取零廢棄物方法,要求它們回收70-80%的廢棄物,減少危險廢棄物處理和焚燒技術產生的溫室排放(根據歐盟委員會的數據)。
新興國家現有的危險廢棄物處理能力已達極限,有可能導致廢棄物囤積和處置不充分的情況。城市廢棄物的數量不斷增加,大大超出了現有的廢棄物收集和處理系統的承受能力。據報道,回收活動有所減少,進一步加劇了城市廢棄物收集和處理的挑戰。根據 AMSA 集團在 2020 年進行的一項研究,義大利米蘭市由於嚴格的封鎖,其廢棄物排放總量下降了 27.5%。不過,與 2019 年同期相比,廢棄物回收量增加了 1%,而路邊垃圾箱減少了 38.2%。封鎖期間城市廢棄物減少了16.65%。
根據世界銀行預測,到2050年,廢棄物排放將比2020年增加73%。中等收入國家將佔這一成長的大部分,未來30年廢棄物產生量將幾乎翻倍,但低收入國家和許多高所得國家也將做出重大貢獻。截至 2021 年,全球僅有 77% 的固態廢棄物收集,33% 的廢棄物被露天傾倒。低收入國家的情況尤其令人擔憂,這些國家產生的廢棄物只有40%被收集,93%被傾倒或未妥善管理。根據廢料回收工業協會 (ISRI) 2021 年的一項調查,66% 的美國表示,如果回收產品不容易或不方便,他們就不會回收,而美國城市固態廢棄物(MSW) 回收率仍然低至 35%。據新加坡國家環境局(NEA)稱,2021 年產生了約 694 萬噸固態廢棄物,其中 383 萬噸被回收。非生活和家庭部門的廢棄物產生量分別從 2020 年的 412 萬噸和 177 萬噸增加到 2021 年的 512 萬噸和 182 萬噸,同樣,非生活和家庭部門的回收廢棄物分別從 2020 年的 281 萬噸和 23 萬噸增加到 2021 萬噸的 2021 萬噸和 23 萬噸。因此,人們對正確回收和處理廢棄物的認知不斷提高,正在推動廢棄物管理產業的發展。
廢棄物管理設備市場趨勢
全球廢棄物產生量的增加可能會推動對廢棄物管理設備的需求
根據 Sensoneo 發布的《2022 年世界廢棄物指數》,土耳其位居廢棄物管理最不環保的國家之首,人均回收廢棄物47 公斤,非法傾倒廢棄物 176 公斤。大部分廢棄物是在美國產生的。目前,每個美國排放811公斤垃圾,其中約一半被送往掩埋。但其中只有95公斤被焚燒。
根據 2022 年全球廢棄物指數,哥倫比亞排放的都市廢棄物最少,為人均 243 公斤。其他國家的垃圾回收率都較低,平均每人每年將 417 公斤廢棄物送到掩埋,而這些垃圾的處理方式對環境特別有害。自從上次世界廢棄物指數發布以來,冰島的廢棄物管理狀況比以往任何時候都更加惡化。根據2022年全球廢棄物指數,冰島的廢棄物排放自2019年以來增加了7%,而廢棄物回收率下降了68%。同時,瑞士是唯一一個不將廢棄物送到垃圾掩埋場的國家。在瑞士,每個居民排放706公斤廢棄物,其中333公斤被焚燒,210公斤被回收。
全球整體每年產生約4億噸塑膠廢棄物。美國2021年將產生4,000萬噸塑膠廢棄物,其中只有5%至6%,即約200萬噸將回收。 2021年,紙張回收超過5,000萬噸,回收率為68%,紙板回收率為91.4%。世界經濟論壇的一項研究顯示,美國每天約有1.1億個玻璃瓶被丟棄,但其中只有三分之一被回收。
聯合國糧食及農業組織在最新報告中估計,全球食物浪費量「以初級商品當量計算」為16億噸。其中,可食用食物廢棄物總量達13億噸。據估計,食物廢棄物的碳足跡為每年向大氣中釋放 33 億噸二氧化碳當量的溫室氣體。在新興國家,農業生產階段存在大量的食物浪費,而在中高所得地區,零售和消費層面往往有大量的食物浪費。食物浪費(不包括魚貝類)每年造成 7,500 億美元的直接經濟影響。
人們對工業廢棄物回收的興趣日益濃厚,刺激了市場
都市固態廢棄物(MSW)是企業、建築物、機構、小型企業、住宅和庭院產生的廢棄物,2021 年,它通常佔全國產生的廢棄物總量的不到 5%。根據歐盟官方資料,在同一時期,在大多數已開發國家,總廢棄物產生的30%至35%來自建築業的活動,包括建築施工、重建和拆除過程。
根據聯合國統計,全球每年產生約112億噸固態廢棄物,其中腐爛的廢棄物約佔全球溫室氣體排放的5%。據估計,全球每年只有不到20%的廢棄物被回收,富裕國家將可回收的垃圾出口到貧窮國家。在美國,所有回收材料的三分之一都出口到海外。在英國,估計有 46% 的回收物出口到土耳其、波蘭和馬來西亞等國家。
自新冠疫情爆發以來,歐洲、亞洲和美國的回收率都有所下降。但疫情也產生了大量新的廢棄物,如個人防護裝備和一次性用品。根據《美國科學院院刊》(PNAS)的一項研究,疫情在全球產生了超過 800 萬噸塑膠廢棄物,其中超過 25,000 噸最終流入海洋。
廢棄物管理設備產業概況
全球廢棄物管理市場格局高度整合且競爭激烈,許多參與者專注於創新技術,以回收和再利用世界各地各行業和家庭產生的廢棄物。該市場的主要全球參與者包括 Recycling Equipment Manufacturing Inc、CP Manufacturing Inc、Dover Corporation、Morita Holding Corporation、Tomra Systems ASA、Wastequip LLC、Blue Group、KK Balers Ltd、Shred-Tech Corporation 和 McNeilus Trucks and Manufacturing, Inc。此外,一些新興企業也紛紛湧現,它們不斷致力於透過遵循零廢棄物 3R(減少、重複使用、回收)理念來減少廢棄物。市場上也發生了很多併購事件。
其他福利:
- Excel 格式的市場預測 (ME) 表
- 3 個月的分析師支持
目錄
第 1 章 簡介
- 調查前提條件
- 研究範圍
第2章調查方法
- 分析方法
- 研究階段
第3章執行摘要
第4章 市場動態
- 當前市場狀況
- 市場概況
- 市場動態
- 驅動程式
- 限制因素
- 機會
- 價值鏈/供應鏈分析
- 波特五力分析
- 新進入者的威脅
- 購買者/消費者的議價能力
- 供應商的議價能力
- 替代品的威脅
- 競爭對手之間的競爭強度
- 廢棄物管理設備市場的技術進步
- 廢棄物管理設備市場的區域見解
- COVID-19 市場影響
第5章 市場區隔
- 依產品類型
- 廢棄物設備
- 廢棄物回收分選設備
- 廢棄物類型
- 危險貨物
- 非危險品
- 按應用
- 工業廢棄物
- 普通廢棄物
- 其他
- 按地區
- 北美洲
- 美國
- 加拿大
- 墨西哥
- 歐洲
- 西班牙
- 德國
- 法國
- 英國
- 葡萄牙
- 希臘
- 義大利
- 歐洲其他地區
- 亞太地區
- 中國
- 日本
- 韓國
- 印度
- 其他亞太地區
- 拉丁美洲、中東和非洲
- UAE
- 沙烏地阿拉伯
- 巴西
- 南非
- 其他地區
- 北美洲
第6章 競爭格局
- 公司簡介
- Recycling Equipment Manufacturing, Inc
- Sierra International Machinery, LLC
- CP Manufacturing, Inc.
- Dover Corporation
- Daiseki
- Hitachi Zosen
- Morita Holding Corporation
- Tomra Systems ASA
- Wastequip, LLC
- Blue Group*
第7章:市場的未來
第 8 章 附錄
The Global Waste Management Equipment Market is expected to register a CAGR of greater than 5.2% during the forecast period.
COVID-19 impacted the waste management industry from the focus of segment shift; during the lockdown, the residential segment generated more waste than industrial and commercial centres, as industries and offices were partially or completely shut. Industrial and commercial waste production fell drastically due to the slowdown in manufacturing activity. Hazardous waste production grew with higher production from the pharmaceutical and medical sectors. The COVID-19 pandemic triggered a zero-waste approach that requires members of the EU to recycle waste between 70-80% while declining GHG emissions attributed to toxic waste disposal and incineration techniques as per the European Commission.
Existing hazardous waste treatment capacity in developing countries was overwhelmed, leading to stockpiling and potentially inadequate disposal. Municipal waste had increased in volume, effectively overwhelming existing waste collection and disposal systems. A reduction in recycling activities was reported which further compounded challenges in the collection and disposal of municipal waste. The study conducted by AMSA Group in 2020 states that in Milan (Italy), the institution of strict lockdown led to a decline in the total waste production by 27.5%. However, recycling of waste increased by 1% compared to 2019 the same period, whereas street bins declined by 38.2%. The month of confinement saw a 16.65% drop in municipal waste.
According to the World Bank, by 2050, waste production will be 73% higher than in 2020. This increase will be mostly driven by middle-income countries in which waste generation will nearly double in the next three decades, though low- and many- high-income countries will contribute significantly to the growing volume. As of 2021, only 77% of global solid waste is collected and 33% of it is openly dumped. The situation in low-income countries is particularly alarming, where only 40% of the generated waste is collected and 93% is dumped or improperly managed. A survey conducted by the Institute of Scrap Recycling Industries (ISRI) in 2021 suggests that 66% of Americans would not recycle a product if it's not easy or inconvenient to do so, and the municipal solid waste (MSW) recycling rate in the US remains as low as 35% in the country. As per National Environment Agency (NEA), Singapore, in 2021, about 6.94 million tonnes of solid waste was generated, of which 3.83 million tonnes were recycled. Waste generated by the non-domestic and domestic sectors both increased in 2021, from 4.12 million tonnes and 1.77 million tonnes respectively in 2020, to 5.12 million tonnes and 1.82 million tonnes respectively in 2021, recycled waste attributed to the non-domestic and domestic sectors likewise increased, from 2.81 million tonnes and 0.23 million tonnes respectively in 2020, to 3.58 million tonnes and 0.24 million tonnes respectively in 2021 in Singapore. Thus increasing awareness about proper recycling and disposal of waste is fueling the growth of waste management industry.
Waste Management Equipment Market Trends
Rising global waste generation is likely to result in the need of waste management equipment
The 2022's Global Waste Index from Sensoneo, reports Turkey is at the top of the list as the least environmentally friendly waste management country, with 47kg of waste per capita recycled and 176kg per capita of waste disposed of illegally each year. Most waste is generated in the United States. Each US citizen currently produces 811kg of waste, and around half of that ends up in the landfill. Meanwhile, just 95kg of that is incinerated.
As per the 2022's Global Waste Index, Colombia produces the least municipal waste, at 243kg per capita while the disposal system in Chile recycles only two kilos per inhabitant. No other country recycles less, 417kg of waste per capita ends up in landfill and is disposed of in a particularly environmentally harmful way. Iceland's waste management has worsened the most since the last Global Waste Index. According to the 2022's Global Waste Index, waste production in Iceland increased by 7% since 2019 and 68% less waste is recycled. While Switzerland is the only country that does not send any waste to landfill. The Swiss produce 706kg of waste per capita, of which 333kg are incinerated and 210kg is recycled.
Globally, about 400 million tons of plastic waste are produced yearly. In 2021, in the U.S.A, 40 million tons of plastic waste is generated of which only 5% to 6% or about two million tons were recycled. More than 50 million tons of paper were recovered for recycling in 2021, achieving a 68% recycling rate and 91.4% of corrugated cardboard was recycled. About 110 million glass bottles are thrown away every day in the U.S., of which only one-third get recycled as per the study done by the World Economic Forum.
The Food and Agriculture Organization of the United Nations in its latest report that the global volume of food wastage is estimated at 1.6 billion tonnes of "primary product equivalents." Total food wastage for the edible part of this amounts to 1.3 billion tonnes. Food wastage's carbon footprint is estimated at 3.3 billion tonnes of CO2 equivalent to GHG released into the atmosphere per year. Home composting can potentially divert up to 150 kg of food waste per household per year from local collection authorities.Developing countries suffer more food losses during agricultural production, while in middle- and high-income regions, food waste at the retail and consumer level tends to be higher. The direct economic consequences of food wastage (excluding fish and seafood) run to the tune of USD 750 billion annually.
Growing concerns of recycling industrial waste fueling the market
Municipal solid waste management (MSW), which is waste generated from companies, buildings, institutions, small businesses, houses, and yards, often comprises less than 5% of the total amount of waste produced in a country in 2021. For the same time period, between 30% and 35% of the total amount of generated waste in most developed countries is attributed to building sector activities such as building construction, renovation, and demolition processes, according to the official EU statistical data.
According to United Nations, every year, an estimated 11.2 billion tonnes of solid waste is collected worldwide and the decay of the organic proportion of solid waste is contributing to about 5% of global greenhouse gas emissions. It is estimated that less than 20% of global waste is recycled each year and rich countries often export recyclables to poorer nations. One-third of recyclables in the US are shipped abroad. The UK estimates that 46% of its recycling goes to countries like Turkey, Poland, and Malaysia.
Recycling rates fell across Europe, Asia, and the US since the onset of the COVID-19 pandemic. But the pandemic also produced a surplus amount of new waste in the forms of PPE and single-use items. A study from the Proceedings of the National Academy of Sciences (PNAS) showed that the pandemic generated over 8 million tons of plastic waste around the world and over 25,000 tons of that waste entered the ocean.
Waste Management Equipment Industry Overview
The Global waste management market's landscape is consolidated and highly competitive with many players focused on innovative technologies to recycle and reuse the waste generated across various industries and households across the globe. The global players leading the market are Recycling Equipment Manufacturing Inc, CP Manufacturing Inc, Dover Corporation, Morita Holding Corporation, Tomra Systems ASA, Wastequip LLC, Blue Group, KK Balers Ltd, Shred-Tech Corporation, and McNeilus Trucks and Manufacturing, Inc. There are also several startups coming up in the industry that are continuously focusing on waste reduction following the Zero Waste - 3R (Reduce, Reuse and Recycle) philosophy. There are also many mergers and acquisitions taking place across the market.
Additional Benefits:
- The market estimate (ME) sheet in Excel format
- 3 months of analyst support
TABLE OF CONTENTS
1 INTRODUCTION
- 1.1 Study Assumptions
- 1.2 Scope of the Study
2 RESEARCH METHODOLOGY
- 2.1 Analysis Method
- 2.2 Research Phases
3 EXECUTIVE SUMMARY
4 MARKET INSIGHTS DYNAMICS
- 4.1 Current Market Scenario
- 4.2 Market Overview
- 4.3 Market Dynamics
- 4.3.1 Drivers
- 4.3.2 Restraints
- 4.3.3 Opportunities
- 4.4 Value Chain / Supply Chain Analysis
- 4.5 Porter's Five Forces Analysis
- 4.5.1 Threat of New Entrants
- 4.5.2 Bargaining Power of Buyers/Consumers
- 4.5.3 Bargaining Power of Suppliers
- 4.5.4 Threat of Substitute Products
- 4.5.5 Intensity of Competitive Rivalry
- 4.6 Technological Advancements in Waste Management Equipment Market
- 4.7 Regional insights on Waste Management Equipment Market
- 4.8 Impact of COVID-19 on the market
5 MARKET SEGMENTATION
- 5.1 By Product Type
- 5.1.1 Waste Disposal Equipment
- 5.1.2 Waste Recycling & Sorting Equipment
- 5.2 By Waste Type
- 5.2.1 Hazardous
- 5.2.2 Non-Hazardous
- 5.3 By Application
- 5.3.1 Industrial Waste
- 5.3.2 Municipal Waste
- 5.3.3 Others
- 5.4 By Geography
- 5.4.1 North America
- 5.4.1.1 US
- 5.4.1.2 Canada
- 5.4.1.3 Mexico
- 5.4.2 Europe
- 5.4.2.1 Spain
- 5.4.2.2 Germany
- 5.4.2.3 France
- 5.4.2.4 UK
- 5.4.2.5 Portugal
- 5.4.2.6 Greece
- 5.4.2.7 Italy
- 5.4.2.8 Rest of Europe
- 5.4.3 Asia-Pacific
- 5.4.3.1 China
- 5.4.3.2 Japan
- 5.4.3.3 South Korea
- 5.4.3.4 India
- 5.4.3.5 Rest of Asia-Pacific
- 5.4.4 LAMEA
- 5.4.4.1 UAE
- 5.4.4.2 Saudi Arabia
- 5.4.4.3 Brazil
- 5.4.4.4 South Africa
- 5.4.4.5 Rest of LAMEA
- 5.4.1 North America
6 COMPETITIVE LANDSCAPE
- 6.1 Overview
- 6.2 Company Profiles
- 6.2.1 Recycling Equipment Manufacturing, Inc
- 6.2.2 Sierra International Machinery, LLC
- 6.2.3 CP Manufacturing, Inc.
- 6.2.4 Dover Corporation
- 6.2.5 Daiseki
- 6.2.6 Hitachi Zosen
- 6.2.7 Morita Holding Corporation
- 6.2.8 Tomra Systems ASA
- 6.2.9 Wastequip, LLC
- 6.2.10 Blue Group*


