


 |
市場調查報告書
商品編碼
1683789
Speed Pedelec 電動自行車:市場佔有率分析、產業趨勢與統計、成長預測(2025-2029 年)Speed Pedelec E-Bike - Market Share Analysis, Industry Trends & Statistics, Growth Forecasts (2025 - 2029) |
||||||
※ 本網頁內容可能與最新版本有所差異。詳細情況請與我們聯繫。
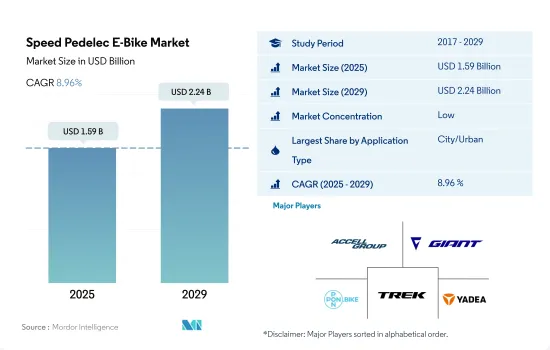
2025 年 Speed Pedelec 電動自行車市場規模估計為 15.9 億美元,預計到 2029 年將達到 22.4 億美元,預測期內(2025-2029 年)的複合年成長率為 8.96%。
- 電動自行車在世界各地迅速普及,越來越多的人購買電動自行車用於交通和通勤。以前我用的是山地自行車和健行車。然而,人們對電動自行車的偏好正在成長,因為它們是通勤的更好選擇,而且在冬季更容易使用,尤其是在大城鎮。 《交通研究》雜誌最近發表的一項研究發現,在六個月的時間裡,挪威的電動自行車騎士將自行車作為日常交通方式的使用量增加了四倍以上。購買電動自行車後,騎士們每天平均騎行 9.2 公里(5.7 英里),高於購買前每天平均騎行 2.1 公里(1.3 英里)。
- 市場擴大的主要因素是年輕人的運動和健康意識不斷增強。腳踏自行車市場不斷擴大,原因有很多,包括消費者健康意識的增強、交通堵塞問題的加劇以及環保意識的增強。這些電動自行車實用、充電方便、操作簡單。這些因素導致 2021 年和 2022 年對 Speed Pedelec 電動自行車的需求增加。
- 電動自行車產業的參與者正致力於引進尖端技術創新,例如智慧控制系統,可用於實現最高能源效率的高速電動自行車的自動或半自動變速箱。預計在預測期內,越野騎行等休閒活動的需求和高速電動自行車的需求將推動 250W 及以上電動自行車的需求。
國家概況
- 預計全球電動自行車市場將主要受到全球範圍內擴大採用電動自行車作為日常交通方式的推動。其他福利包括健康福利、經濟機動性和乘坐便利。
- 在亞太地區電動自行車市場,2023年的銷量約為3,480萬輛。中國、日本和印尼佔了大部分銷售額。以銷量計算,2022年中國將佔全球電動自行車市場的90%以上。然而,中國電動自行車市場近年來成長停滯,已接近飽和狀態。
- 近年來,電動自行車在歐洲的銷售量激增,德國、比利時、荷蘭等國電動自行車銷量龐大。消費者對用於交通、運動和休閒的電動自行車的偏好日益成長,推動了電動自行車的銷售。此外,瑞典、比利時和法國對電動自行車的補貼和稅收優惠預計將在預測期內支持歐洲電動自行車市場的顯著成長。
- 在北美,由於近年來人們對低速二輪車的偏好增加,電動自行車市場目前正處於早期成長階段。隨著各共享單車業者不斷增加電動自行車數量以擴充其車隊,預計在不久的將來電動自行車的銷售將會成長。
全球 Speed Pedelec 電動自行車市場趨勢
全球電動自行車普及率的穩定上升反映了全球向永續、高效的個人移動解決方案的轉變。
- 近年來,許多國家對電動自行車的需求不斷增加。汽油價格上漲、交通高峰期擁擠以及運動帶來的健康益處推動了英國和美國等多個國家開始普及電動自行車。歐洲是 2019 年電動自行車銷售的主要市場,與其他地區相比,採用率更高。與 2018 年相比,2019 年對電動自行車的需求不斷增加,加速了電動自行車的普及率。
- 新冠肺炎疫情在全球迅速蔓延,對自行車產業產生了正面影響。與其他交通途徑相比,電動自行車是日常通勤和其他本地地點旅行最實用且經濟實惠的解決方案之一,並且徹底改變了消費者的通勤方式。這鼓勵了人們投資電動自行車,2020 年全球電動自行車的普及率與 2019 年相比有所加速。
- 商業營運的恢復和停工等貿易限制的解除加速了世界各國對電動自行車的普及。進出口活動的改善是全球貿易壁壘消除的結果。根據估計和預測,在預測期內,由於電動自行車具有邊騎行邊鍛煉、無燃料成本、清潔騎行等特點和優勢,消費者對電動自行車的興趣將會增加,從而導致全球許多國家的電動自行車普及率提高。
全球範圍內通勤距離在 5 至 15 公里之間的成長凸顯了隨著工作與生活動態以及城市規劃的不斷發展,人們普遍轉向更適中的通勤距離。
- 全球自行車市場包括北美、歐洲和亞太等幾個熱愛自行車的地區。近年來,許多國家不同地區對自行車的需求正在增加。許多國家和地區的人們擴大使用自行車進行每天5至15公里的通勤,以及前往辦公室和商業區等附近的地方。在所有地區中,亞太地區每天通勤距離在 5-15 公里之間的人數最多。
- 在新冠肺炎疫情爆發後,全球多個國家的健身房和公共交通被迫關閉,許多人發現騎自行車是安全且隔離的交通方式。此外,在疫情期間,2020年全球每天出行5至15公里的通勤人數與2019年相比有所增加,因為人們更喜歡在周末騎自行車或在附近跑步來鍛鍊身體。每天通勤 5-15 公里的消費者傾向於選擇配備尖端電池組的電動自行車,其續航里程可延長至 40-45 公里。
Speed Pedelec 電動自行車產業概況
Speed Pedelec電動自行車市場較為分散,前五大企業佔了29.69%的市場。該市場的主要企業是:Accell Group、Giant Manufacturing、Pon Holding BV、Trek Bicycle Corporation和Yadea Group Holdings Ltd.(按字母順序排列)。
其他福利
- Excel 格式的市場預測 (ME) 表
- 3 個月的分析師支持
目錄
第 1 章執行摘要和主要發現
第2章 報告要約
第 3 章 簡介
- 研究假設和市場定義
- 研究範圍
- 調查方法
第4章 產業主要趨勢
- 自行車銷量
- 人均國內生產毛額
- 通貨膨脹率
- 電動自行車普及率
- 每天出遊 5 至 15 公里的人口/通勤者百分比
- 自行車出租
- 電動自行車電池價格
- 電池化學價格表
- 超本地化配送
- 自行車道
- 徒步人數
- 電池充電容量
- 交通堵塞指數
- 法律規範
- 價值鏈與通路分析
第5章 市場區隔
- 應用程式類型
- 貨運/公用設施
- 城市/城區
- 健行
- 電池類型
- 鉛酸電池
- 鋰離子電池
- 其他
- 地區
- 非洲
- 按國家
- 南非
- 非洲以外
- 亞太地區
- 按國家
- 澳洲
- 中國
- 印度
- 日本
- 紐西蘭
- 韓國
- 亞太地區其他國家
- 歐洲
- 按國家
- 奧地利
- 比利時
- 捷克共和國
- 丹麥
- 芬蘭
- 法國
- 德國
- 義大利
- 盧森堡
- 荷蘭
- 挪威
- 波蘭
- 西班牙
- 瑞典
- 瑞士
- 英國
- 其他歐洲國家
- 中東
- 按國家
- 沙烏地阿拉伯
- 阿拉伯聯合大公國
- 其他中東地區
- 北美洲
- 按國家
- 加拿大
- 墨西哥
- 美國
- 北美其他地區
- 南美洲
- 按國家
- 阿根廷
- 巴西
- 南美洲其他地區
- 非洲
第6章 競爭格局
- 關鍵策略趨勢
- 市場佔有率分析
- 業務狀況
- 公司簡介
- Accell Group
- Aima Technology Group Co. Ltd
- Cycling Sports Group, Inc.
- Fritzmeier Systems GmbH & Co. KG(M1 Sporttechnik)
- Giant Manufacturing Co. Ltd.
- Kalkhoff Werke GmbH
- Merida Industry Co. Ltd
- Pon Holding BV
- Riese & Muller
- Royal Dutch Gazelle
- Specialized Bicycle Components
- Tianjin Fuji-Ta Bicycle Co. Ltd.
- Trek Bicycle Corporation
- VanMoof BV
- Yadea Group Holdings Ltd.
- Yamaha Motor Co., Ltd.
第7章:執行長的關鍵策略問題
第 8 章 附錄
- 世界概況
- 概述
- 五力分析框架
- 全球價值鏈分析
- 市場動態(DRO)
- 資訊來源和進一步閱讀
- 圖片列表
- 關鍵見解
- 資料包
- 詞彙表
The Speed Pedelec E-Bike Market size is estimated at 1.59 billion USD in 2025, and is expected to reach 2.24 billion USD by 2029, growing at a CAGR of 8.96% during the forecast period (2025-2029).
- Electric bicycles are rapidly becoming more popular globally, with the increasing trend of more people buying e-bikes for transportation and commuting. Previously, people used mountain bikes or trekking bikes for this purpose. However, the preference for e-bikes is growing, as they are more suited for commuting and can be more easily used in wintertime, especially in big towns. According to a recent study published in the journal of Transportation Research, Norwegian e-bike riders more than quadrupled their daily use of the bicycle for transport over six months. After buying an e-bike, riders covered 9.2 km (5.7 miles) per day on average, up from 2.1 km (1.3 miles) per day before their purchase.
- The primary driver of the market's expansion is a rise in young people's awareness of exercise and health. The market for pedelecs is expanding due to reasons like rising consumer health awareness, growing traffic congestion problems, and growing environmental consciousness. These e-bikes are practical and simple to charge, and easy to operate. Due to these factors, the demand for speed pedelec e-bikes increased in 2021 and 2022.
- Players in the e-bike industry are working to introduce cutting-edge technological innovations, including intelligent control systems, which may be used to implement automatic or semi-automatic transmission for speed pedelecs that have the best energy efficiency. The growing demand for recreational activities like off-road cycling and the demand for speed pedelecs are likely to drive the demand for above 250 W e-bikes during the forecast period.
Country Level Overview
- The global e-bike market is expected to be mainly driven by the increasing adoption of electric bikes as a daily mode of transportation globally. Additionally, the market is seeing an upsurge in the unit sales of electric bikes owing to their benefits, such as health benefits, economic mobility, and convenience in riding.
- In the APAC e-bike market, unit sales amounted to around 34.8 million in 2023. China, Japan, and Indonesia accounted for the majority of unit sales during the historical period. China accounted for over a 90% share by volume in the global electric bike market in 2022. However, the Chinese e-bike market has been witnessing growth stagnate in recent years and is almost at saturation point.
- In Europe, electric bike sales have skyrocketed in recent years, with countries including Germany, Belgium, and the Netherlands selling large numbers of electric bikes. The sales are being driven by consumers' growing preference for using electric bikes for transportation, sports, and leisure activities. Additionally, the subsidies and tax incentives programs for electric bikes in Sweden, Belgium, and France are expected to support the significant growth of the European electric bike market during the forecast period.
- In North America, the electric bike market is currently at an early growth stage as people's preference for using low-speed two-wheelers has increased only in recent years. The inclusion of more electric bikes by various bike-sharing operators as part of their fleet expansion is expected to support the sales growth of these bikes in the near future.
Global Speed Pedelec E-Bike Market Trends
The steady global increase in e-bike adoption rates reflects a worldwide shift toward sustainable and efficient personal mobility solutions
- There has been an increase in the demand for electric bicycles in many countries over the past several years. Increased gasoline costs, traffic congestion during rush hours, and the health advantages of exercise are driving the adoption of e-bikes in several countries, including the United Kingdom and the United States. With a greater adoption rate in 2019 compared to other regions, Europe was the primary market for the sales of electric bikes. The increasing demand for e-bikes accelerated the adoption rate in 2019 compared to 2018.
- The bicycle industry was favorably impacted by the rapid global expansion of COVID-19 cases. E-bikes are one of the most practical and affordable solutions for everyday commutes to work and other local locations compared to other means of transportation, which has revolutionized how consumers commute. This has encouraged people to invest in e-bikes, which accelerated their adoption rate in 2020 over 2019 in various countries worldwide.
- The return of commercial operations and the lifting of trade restrictions like lockouts have accelerated the adoption of e-bikes in numerous countries throughout the world. The improvement of import and export activities has been a result of the removal of trade obstacles globally. According to estimates, during the forecast period, the adoption rate of e-bikes will increase in a number of countries worldwide due to consumers' growing interest in them as a result of their features and advantages, such as the ability to exercise while riding, the lack of fuel costs, and cleaner rides.
A global uptick in 5-15 km commutes underscores a universal shift towards moderate commuting distances, aligning with evolving work-life dynamics and urban planning.
- The global bicycle market is made up of several bicycle-friendly regions, including North America, Europe, and Asia-Pacific. Bicycle demand has grown recently among many countries in various regions. People from different countries and regions are gradually shifting to using bicycles for their everyday commutes of 5 to 15 km or other nearby locations such as offices and commercial districts. The APAC region has witnessed the most daily commuters traveling 5 to 15 km among all regions.
- Following the COVID-19 outbreak, which forced the closing of gyms and public transportation in several countries worldwide, many people discovered bicycles to be a secure and isolated method of transportation. People also preferred to exercise during the pandemic by bicycling or going on weekend runs to neighboring sites, which led to an increase in the number of commuters with a daily journey distance of 5 to 15 km in 2020 over 2019 globally. Consumers who commute 5 to 15 km daily are drawn to e-bikes with cutting-edge battery packs that offer an increased range of up to 40 to 45 km.
Speed Pedelec E-Bike Industry Overview
The Speed Pedelec E-Bike Market is fragmented, with the top five companies occupying 29.69%. The major players in this market are Accell Group, Giant Manufacturing Co. Ltd., Pon Holding B.V., Trek Bicycle Corporation and Yadea Group Holdings Ltd. (sorted alphabetically).
Additional Benefits:
- The market estimate (ME) sheet in Excel format
- 3 months of analyst support
TABLE OF CONTENTS
1 EXECUTIVE SUMMARY & KEY FINDINGS
2 REPORT OFFERS
3 INTRODUCTION
- 3.1 Study Assumptions & Market Definition
- 3.2 Scope of the Study
- 3.3 Research Methodology
4 KEY INDUSTRY TRENDS
- 4.1 Bicycle Sales
- 4.2 GDP Per Capita
- 4.3 Inflation Rate
- 4.4 Adoption Rate Of E-bikes
- 4.5 Percent Population/commuters With 5-15 Km Daily Travel Distance
- 4.6 Bicycle Rental
- 4.7 E-bike Battery Price
- 4.8 Price Chart Of Different Battery Chemistry
- 4.9 Hyper-local Delivery
- 4.10 Dedicated Bicycle Lanes
- 4.11 Number Of Trekkers
- 4.12 Battery Charging Capacity
- 4.13 Traffic Congestion Index
- 4.14 Regulatory Framework
- 4.15 Value Chain & Distribution Channel Analysis
5 MARKET SEGMENTATION (includes market size in Value in USD and Volume, Forecasts up to 2029 and analysis of growth prospects)
- 5.1 Application Type
- 5.1.1 Cargo/Utility
- 5.1.2 City/Urban
- 5.1.3 Trekking
- 5.2 Battery Type
- 5.2.1 Lead Acid Battery
- 5.2.2 Lithium-ion Battery
- 5.2.3 Others
- 5.3 Region
- 5.3.1 Africa
- 5.3.1.1 By Country
- 5.3.1.1.1 South Africa
- 5.3.1.1.2 Rest-of-Africa
- 5.3.2 Asia-Pacific
- 5.3.2.1 By Country
- 5.3.2.1.1 Australia
- 5.3.2.1.2 China
- 5.3.2.1.3 India
- 5.3.2.1.4 Japan
- 5.3.2.1.5 New Zealand
- 5.3.2.1.6 South Korea
- 5.3.2.1.7 Rest-of-APAC
- 5.3.3 Europe
- 5.3.3.1 By Country
- 5.3.3.1.1 Austria
- 5.3.3.1.2 Belgium
- 5.3.3.1.3 Czech Republic
- 5.3.3.1.4 Denmark
- 5.3.3.1.5 Finland
- 5.3.3.1.6 France
- 5.3.3.1.7 Germany
- 5.3.3.1.8 Italy
- 5.3.3.1.9 Luxembourg
- 5.3.3.1.10 Netherlands
- 5.3.3.1.11 Norway
- 5.3.3.1.12 Poland
- 5.3.3.1.13 Spain
- 5.3.3.1.14 Sweden
- 5.3.3.1.15 Switzerland
- 5.3.3.1.16 UK
- 5.3.3.1.17 Rest-of-Europe
- 5.3.4 Middle East
- 5.3.4.1 By Country
- 5.3.4.1.1 Saudi Arabia
- 5.3.4.1.2 United Arab Emirates
- 5.3.4.1.3 Rest-of-Middle East
- 5.3.5 North America
- 5.3.5.1 By Country
- 5.3.5.1.1 Canada
- 5.3.5.1.2 Mexico
- 5.3.5.1.3 US
- 5.3.5.1.4 Rest-of-North America
- 5.3.6 South America
- 5.3.6.1 By Country
- 5.3.6.1.1 Argentina
- 5.3.6.1.2 Brazil
- 5.3.6.1.3 Rest-of-South America
- 5.3.1 Africa
6 COMPETITIVE LANDSCAPE
- 6.1 Key Strategic Moves
- 6.2 Market Share Analysis
- 6.3 Company Landscape
- 6.4 Company Profiles
- 6.4.1 Accell Group
- 6.4.2 Aima Technology Group Co. Ltd
- 6.4.3 Cycling Sports Group, Inc.
- 6.4.4 Fritzmeier Systems GmbH & Co. KG (M1 Sporttechnik)
- 6.4.5 Giant Manufacturing Co. Ltd.
- 6.4.6 Kalkhoff Werke GmbH
- 6.4.7 Merida Industry Co. Ltd
- 6.4.8 Pon Holding B.V.
- 6.4.9 Riese & Muller
- 6.4.10 Royal Dutch Gazelle
- 6.4.11 Specialized Bicycle Components
- 6.4.12 Tianjin Fuji-Ta Bicycle Co. Ltd.
- 6.4.13 Trek Bicycle Corporation
- 6.4.14 VanMoof BV
- 6.4.15 Yadea Group Holdings Ltd.
- 6.4.16 Yamaha Motor Co., Ltd.
7 KEY STRATEGIC QUESTIONS FOR E BIKES CEOS
8 APPENDIX
- 8.1 Global Overview
- 8.1.1 Overview
- 8.1.2 Porter's Five Forces Framework
- 8.1.3 Global Value Chain Analysis
- 8.1.4 Market Dynamics (DROs)
- 8.2 Sources & References
- 8.3 List of Tables & Figures
- 8.4 Primary Insights
- 8.5 Data Pack
- 8.6 Glossary of Terms
 全球電動自行車市場:依類別、馬達類型、電池類型、應用類型、地區、機會及預測,2018-2032
 山地電動自行車市場-全球產業規模、佔有率、趨勢、機會和預測,按電池、類型、應用、地區和競爭細分,2020-2030 年
 全球電動自行車訂閱平台市場
 電動自行車市場規模、佔有率及成長分析(按類別、速度、電池類型、馬達類型、模式、組件、應用、所有權類型、電池容量、馬達重量、馬達功率及地區)-2025-2032 年產業預測
 2032 年 Speed Pedelec 電動自行車市場預測:按電池類型、組件、額定速度、馬達類型、騎乘者類型、應用和地區進行全球分析
 日本電動自行車市場報告,按推進類型(踏板輔助、高速電動自行車、油門輔助)、應用類型(貨運/多用途、城市/都市、健行)、電池類型(鉛酸電池、鋰離子電池等)和地區分類,2025 年至 2033 年
 2025年全球電動自行車市場報告
 全球電動自行車訂閱平台市場:產業分析、規模、佔有率、成長、趨勢與預測(2025-2032年)
 中國電動自行車市場:市場佔有率分析、產業趨勢與統計、成長預測(2025-2030)中東電動自行車:市場佔有率分析、產業趨勢與統計、成長預測(2025-2029 年)