


 |
市場調查報告書
商品編碼
1684033
普通波特蘭水泥:市場佔有率分析、行業趨勢和成長預測(2025-2030 年)Ordinary Portland Cement - Market Share Analysis, Industry Trends & Statistics, Growth Forecasts (2025 - 2030) |
||||||
價格
※ 本網頁內容可能與最新版本有所差異。詳細情況請與我們聯繫。
簡介目錄
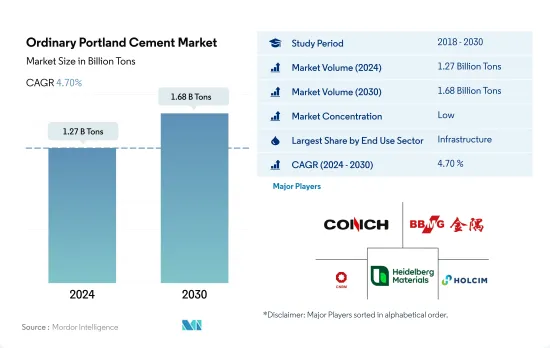
普通波特蘭水泥市場規模預計在2024年為12.7億噸,預計到2030年將達到16.8億噸,預測期內(2024-2030年)的複合年成長率為4.70%。
基礎設施支出的增加可能會推動對普通波特蘭水泥的需求。
- 在2022年的全球水泥市場中,普通波特蘭水泥(OPC)佔了29.18%的較大市場佔有率。受住宅和基礎設施建設行業需求成長的推動,預計 2023 年 OPC消費量將成長 0.81%。
- 2022年,基礎建設成為OPC的主要消費者,佔近一半的市場佔有率(47.91%)。在投資增加的推動下,預計2023年全球基礎建設支出將達到2.78兆美元。美國特別計畫到2025年撥款1.2兆美元,其中包括透過《基礎建設投資和就業法案》撥款5,500億美元。這些資金將用於各種計劃,包括道路、橋樑、鐵路、智慧基礎設施、寬頻和電動車。因此,基礎設施領域的OPC需求預計將從2023年的5.7676億噸飆升至2030年的7.7892億噸。
- 商業領域將成為 OPC 成長最快的消費者,預測期內複合年成長率將達到 6.30%。預計到2024年,對購物中心、辦公室和其他商業設施的需求不斷成長將推動全球新增3.01億平方英尺的商業占地面積。例如,印尼計畫在2025年竣工六個購物中心計劃,總合面積達29.2萬平方公尺。因此,預計到 2030 年全球 OPC 需求將比 2023 年的水準增加 5,652 萬噸。
預測期內,普通波特蘭水泥的消費量預計將由中東和非洲主導。
- 2022年全球一般波特蘭水泥消費量與前一年同期比較%。下降的主要原因是亞太地區消費量下降了5.72%。建設產業面臨阻力,通貨膨脹飆升,原物料價格上漲,景氣衰退迫在眉睫。除了這些因素之外,投資放緩和計劃延遲也抑制了普通波特蘭水泥的需求。不過,預計 2023 年將出現溫和復甦,消費量預計將成長 0.81%。這一成長主要受預計歐洲需求成長 5.69% 的推動。
- 到2022年,亞太地區將成為一般波特蘭水泥的主要消費地區,佔全球需求的70.71%。值得注意的是,中國、日本和印度等國家在塑造這項需求方面發揮了關鍵作用。中國對交通基礎設施的投資從2021年的1,576億美元增加到2022年的1,656億美元。日本製造業設施建設激增,而印度則專注於透過公路、鐵路和高速公路計劃加強連結性。
- 中東和非洲將成為普通波特蘭水泥消費量成長最快的地區,預計預測期內複合年成長率將達到 6.98%。阿拉伯聯合大公國表現突出,2021年至2022年基礎建設投資激增82%。到2022年,沙烏地阿拉伯和阿拉伯聯合大公國將分別佔全球消費量的11%和3%。特別是沙烏地阿拉伯雄心勃勃的「2030願景」和價值約26.6億美元的投資基金協議,凸顯了沙烏地阿拉伯王國對發展商業、旅遊和住宅計劃的承諾。
普通波特蘭水泥的全球市場趨勢
亞太地區大型辦公大樓建設計劃的激增將推動全球商業建築占地面積的增加。
- 2022年,全球商業建築占地面積預計與前一年同期比較僅小幅成長0.15%。歐洲表現突出,增幅達 12.70%,這得益於歐洲大力推行節能辦公大樓,以實現 2030 年二氧化碳排放目標。隨著員工重返辦公室,歐洲公司正在重新簽訂租約,刺激 2022 年新辦公大樓建設面積達到 450 萬平方英尺。預計這一勢頭將在 2023 年持續下去,全球成長率預計為 4.26%。
- 新冠疫情造成勞動力和材料短缺,導致商業建築計劃取消和延遲。然而,隨著停工緩解和建設活動恢復,2021 年全球新增商業占地面積飆升 11.11%,其中亞太地區以 20.98% 的成長率領先。
- 展望未來,全球新增商業占地面積的複合年成長率將達到4.56%。預計亞太地區的複合年成長率將達到 5.16%,超過其他地區。這一成長背後的驅動力是中國、印度、韓國和日本商業建築計劃的活性化。尤其北京、上海、香港、台北等中國主要城市的甲級辦公室建設正在加速。此外,印度計劃於 2023 年至 2025 年間在七大城市開設約 60 家購物中心,總面積約 2,325 萬平方英尺。總合到 2030 年,亞太地區的這些措施將比 2022 年增加 15.6 億平方英尺的新零售占地面積。
預計南美洲的住宅將出現最快的成長,這得益於政府加大對經濟適用住宅計畫的投資,這將推動全球住宅產業的發展。
- 2022年,全球新建住宅占地面積與2021年相比減少了約2.89億平方英尺。這是由於土地稀缺、勞動力短缺以及建築材料價格不永續的高企造成的住宅危機。這場危機對亞太地區造成了嚴重影響,2022 年新占地面積與 2021 年相比下降了 5.39%。不過,2023 年的前景更加光明,預計全球新建占地面積將比 2022 年成長 3.31%,這要歸功於政府投資,這些投資可以為 2030 年之前 30 億人建造新的經濟適用住宅提供資金。
- 新冠疫情造成經濟放緩,導致大量住宅建設計劃取消或延後,2020年全球新建占地面積較2019年下降4.79%。隨著2021年限制措施的解除,住宅計劃被壓抑的需求得到釋放,2021年全球新建占地面積較2020年成長11.22%,其中歐洲增幅最高,為18.28%,其次是南美洲,2021年較2020年成長17.36%。
- 預測期內,全球住宅新占地面積預計複合年成長率為 3.81%,其中南美洲的複合年成長率最快,為 4.05%。巴西的「Minha Casa Minha Vida」計畫於2023年宣布實施,是政府投資19.8億美元為低收入家庭提供經濟適用住宅的計畫;智利的「FOGAES」計畫也於2023年宣布實施,初始投資額為5,000萬美元。
普通波特蘭水泥產業概況
普通波特蘭水泥市場分散,前五大公司佔34.16%的市佔率。市場的主要企業有:安徽海螺水泥股份有限公司、北京金隅集團、中國建築材料集團公司、海德堡材料和霍爾希姆。
其他福利
- Excel 格式的市場預測 (ME) 表
- 3個月的分析師支持
目錄
第1章執行摘要和主要發現
第2章 報告要約
第3章 引言
- 研究假設和市場定義
- 研究範圍
- 調查方法
第4章 產業主要趨勢
- 最終用途趨勢
- 商業
- 工業/設施
- 基礎設施
- 住宅
- 重大基礎設施計劃(目前和已宣布)
- 法律規範
- 價值鍊和通路分析
第5章市場區隔
- 最終用途部門
- 商業
- 工業/設施
- 基礎設施
- 住宅
- 地區
- 亞太地區
- 按國家
- 澳洲
- 中國
- 印度
- 印尼
- 日本
- 馬來西亞
- 韓國
- 泰國
- 越南
- 其他亞太地區
- 歐洲
- 按國家
- 法國
- 德國
- 義大利
- 俄羅斯
- 西班牙
- 英國
- 其他歐洲國家
- 中東和非洲
- 按國家
- 沙烏地阿拉伯
- 阿拉伯聯合大公國
- 其他中東和非洲地區
- 北美洲
- 按國家
- 加拿大
- 墨西哥
- 美國
- 南美洲
- 按國家
- 阿根廷
- 巴西
- 南美洲其他地區
- 亞太地區
第6章競爭格局
- 關鍵策略趨勢
- 市場佔有率分析
- 業務狀況
- 公司簡介
- Anhui Conch Cement Company Limited
- BBMG Corporation
- CEMEX, SAB de CV
- China National Building Material Group Corporation
- Dangote Cement Plc.
- Heidelberg Materials
- Holcim
- SIG
- UltraTech Cement Ltd.
- Votorantim Cimentos
第 7 章 CEO 的關鍵策略問題CEO 的關鍵策略問題
第 8 章 附錄
- 世界概況
- 概述
- 五力分析框架(產業吸引力分析)
- 全球價值鏈分析
- 市場動態(DRO)
- 資訊來源及延伸閱讀
- 圖片列表
- 關鍵見解
- 資料包
- 詞彙表
簡介目錄
Product Code: 50001940
The Ordinary Portland Cement Market size is estimated at 1.27 billion Tons in 2024, and is expected to reach 1.68 billion Tons by 2030, growing at a CAGR of 4.70% during the forecast period (2024-2030).
Rising infrastructure spending is likely to drive the demand for ordinary Portland cement
- In 2022, the global cement market saw ordinary Portland cement (OPC) dominate, capturing a significant 29.18% market share. The consumption of OPC was projected to grow by 0.81% in 2023, driven by rising demand from the residential and infrastructure construction sectors.
- Infrastructure emerged as the leading consumer of OPC in 2022, accounting for nearly half (47.91%) of the market. Global infrastructure spending was set to hit USD 2.78 trillion in 2023, buoyed by increased investments. Notably, the United States plans to allocate USD 1.2 trillion by 2025, including USD 550 billion from the Infrastructure Investment and Jobs Act. These funds will be channeled into diverse projects like roads, bridges, rail, smart infrastructure, broadband, and electric vehicles. Consequently, OPC demand for the infrastructure sector is projected to surge from 576.76 million tons in 2023 to 778.92 million tons in 2030.
- The commercial segment is poised to be the fastest-growing consumer of OPC, with a robust CAGR of 6.30% during the forecast period. The global new floor area for commercial spaces is projected to rise by 301 million sq. ft in 2024, driven by heightened demand for shopping malls, offices, and other commercial establishments. For instance, Indonesia has six shopping mall projects slated for completion by 2025, adding up to a combined area of 292 thousand sq. meters. Consequently, the global OPC demand for the commercial sector is anticipated to climb by 56.52 million tons by 2030, compared to the levels seen in 2023.
The Middle East & Africa is expected to lead in terms of consumption volume of ordinary Portland cement during the forecast period
- In 2022, the global consumption of ordinary Portland cement dipped by 3.14% compared to the previous year. This decline was largely driven by a 5.72% drop in consumption from Asia-Pacific. The construction industry faced headwinds, grappling with surging inflation, soaring raw material prices, and an impending recession. These factors, coupled with a pullback in investments and project delays, weighed on the demand for ordinary Portland cement. However, in 2023, they anticipated a modest rebound, with consumption projected to inch up by 0.81%. This uptick is primarily driven by a projected 5.69% surge in demand from Europe.
- Asia-Pacific emerged as the dominant consumer of ordinary Portland cement in 2022, accounting for a significant 70.71% of the global demand. Notably, countries like China, Japan, and India played pivotal roles in shaping this demand. China's investment in transport infrastructure rose from USD 157.6 billion in 2021 to USD 165.6 billion in 2022. Japan witnessed a surge in manufacturing facility constructions, while India focused on bolstering its connectivity through road, rail, and highway projects.
- The Middle East & Africa is poised to witness the swiftest growth in ordinary Portland cement consumption, with a projected CAGR of 6.98% during the forecast period. The United Arab Emirates stood out, with an 82% surge in infrastructure investments from 2021 to 2022. In 2022, Saudi Arabia and the UAE accounted for 11% and 3% of global consumption, respectively. Notably, Saudi Arabia's ambitious Vision 2030 and its agreements, including those worth nearly USD 2.66 billion for investment funds, underscore its commitment to developing commercial, tourism, and residential projects.
Global Ordinary Portland Cement Market Trends
Asia-Pacific's surge in large-scale office building projects is set to elevate the global floor area dedicated to commercial construction
- In 2022, the global new floor area for commercial construction witnessed a modest growth of 0.15% from the previous year. Europe stood out with a significant surge of 12.70%, driven by a push for high-energy-efficient office buildings to align with its 2030 carbon emission targets. As employees returned to offices, European companies, resuming lease decisions, spurred the construction of 4.5 million square feet of new office space in 2022. This momentum is poised to persist in 2023, with a projected global growth rate of 4.26%.
- The COVID-19 pandemic caused labor and material shortages, leading to cancellations and delays in commercial construction projects. However, as lockdowns eased and construction activities resumed, the global new floor area for commercial construction surged by 11.11% in 2021, with Asia-Pacific taking the lead with a growth rate of 20.98%.
- Looking ahead, the global new floor area for commercial construction is set to achieve a CAGR of 4.56%. Asia-Pacific is anticipated to outpace other regions, with a projected CAGR of 5.16%. This growth is fueled by a flurry of commercial construction projects in China, India, South Korea, and Japan. Notably, major Chinese cities like Beijing, Shanghai, Hong Kong, and Taipei are gearing up for an uptick in Grade A office space construction. Additionally, India is set to witness the opening of approximately 60 shopping malls, spanning 23.25 million square feet, in its top seven cities between 2023 and 2025. Collectively, these endeavors across Asia-Pacific are expected to add a staggering 1.56 billion square feet to the new floor area for commercial construction by 2030, compared to 2022.
South America's estimated fastest growth in residential constructions due to increasing government investments in schemes for affordable housing to boost the global residential sector
- In 2022, the global new floor area for residential construction declined by around 289 million square feet compared to 2021. This can be attributed to the housing crisis generated due to the shortage of land, labor, and unsustainably high construction materials prices. This crisis severely impacted Asia-Pacific, where the new floor area declined 5.39% in 2022 compared to 2021. However, a more positive outlook is expected in 2023 as the global new floor area is predicted to grow by 3.31% compared to 2022, owing to government investments that can finance the construction of new affordable homes capable of accommodating 3 billion people by 2030.
- The COVID-19 pandemic caused an economic slowdown, due to which many residential construction projects got canceled or delayed, and the global new floor area declined by 4.79% in 2020 compared to 2019. As the restrictions were lifted in 2021 and pent-up demand for housing projects was released, new floor area grew 11.22% compared to 2020, with Europe having the highest growth of 18.28%, followed by South America, which rose 17.36% in 2021 compared to 2020.
- The global new floor area for residential construction is expected to register a CAGR of 3.81% during the forecast period, with South America predicted to develop at the fastest CAGR of 4.05%. Schemes and initiatives like the Minha Casa Minha Vida in Brazil announced in 2023 with a few regulatory changes, for which the government plans an investment of USD 1.98 billion to provide affordable housing units for low-income families, and the FOGAES in Chile also publicized in 2023, with an initial investment of USD 50 million, are aimed at providing mortgage loans to families for affordable housing and will encourage the construction of new residential units.
Ordinary Portland Cement Industry Overview
The Ordinary Portland Cement Market is fragmented, with the top five companies occupying 34.16%. The major players in this market are Anhui Conch Cement Company Limited, BBMG Corporation, China National Building Material Group Corporation, Heidelberg Materials and Holcim (sorted alphabetically).
Additional Benefits:
- The market estimate (ME) sheet in Excel format
- 3 months of analyst support
TABLE OF CONTENTS
1 EXECUTIVE SUMMARY & KEY FINDINGS
2 REPORT OFFERS
3 INTRODUCTION
- 3.1 Study Assumptions & Market Definition
- 3.2 Scope of the Study
- 3.3 Research Methodology
4 KEY INDUSTRY TRENDS
- 4.1 End Use Sector Trends
- 4.1.1 Commercial
- 4.1.2 Industrial and Institutional
- 4.1.3 Infrastructure
- 4.1.4 Residential
- 4.2 Major Infrastructure Projects (current And Announced)
- 4.3 Regulatory Framework
- 4.4 Value Chain & Distribution Channel Analysis
5 MARKET SEGMENTATION (includes market size, forecasts up to 2030 and analysis of growth prospects.)
- 5.1 End Use Sector
- 5.1.1 Commercial
- 5.1.2 Industrial and Institutional
- 5.1.3 Infrastructure
- 5.1.4 Residential
- 5.2 Region
- 5.2.1 Asia-Pacific
- 5.2.1.1 By Country
- 5.2.1.1.1 Australia
- 5.2.1.1.2 China
- 5.2.1.1.3 India
- 5.2.1.1.4 Indonesia
- 5.2.1.1.5 Japan
- 5.2.1.1.6 Malaysia
- 5.2.1.1.7 South Korea
- 5.2.1.1.8 Thailand
- 5.2.1.1.9 Vietnam
- 5.2.1.1.10 Rest of Asia-Pacific
- 5.2.2 Europe
- 5.2.2.1 By Country
- 5.2.2.1.1 France
- 5.2.2.1.2 Germany
- 5.2.2.1.3 Italy
- 5.2.2.1.4 Russia
- 5.2.2.1.5 Spain
- 5.2.2.1.6 United Kingdom
- 5.2.2.1.7 Rest of Europe
- 5.2.3 Middle East and Africa
- 5.2.3.1 By Country
- 5.2.3.1.1 Saudi Arabia
- 5.2.3.1.2 United Arab Emirates
- 5.2.3.1.3 Rest of Middle East and Africa
- 5.2.4 North America
- 5.2.4.1 By Country
- 5.2.4.1.1 Canada
- 5.2.4.1.2 Mexico
- 5.2.4.1.3 United States
- 5.2.5 South America
- 5.2.5.1 By Country
- 5.2.5.1.1 Argentina
- 5.2.5.1.2 Brazil
- 5.2.5.1.3 Rest of South America
- 5.2.1 Asia-Pacific
6 COMPETITIVE LANDSCAPE
- 6.1 Key Strategic Moves
- 6.2 Market Share Analysis
- 6.3 Company Landscape
- 6.4 Company Profiles
- 6.4.1 Anhui Conch Cement Company Limited
- 6.4.2 BBMG Corporation
- 6.4.3 CEMEX, S.A.B. de C.V.
- 6.4.4 China National Building Material Group Corporation
- 6.4.5 Dangote Cement Plc.
- 6.4.6 Heidelberg Materials
- 6.4.7 Holcim
- 6.4.8 SIG
- 6.4.9 UltraTech Cement Ltd.
- 6.4.10 Votorantim Cimentos
7 KEY STRATEGIC QUESTIONS FOR CONCRETE, MORTARS AND CONSTRUCTION CHEMICALS CEOS
8 APPENDIX
- 8.1 Global Overview
- 8.1.1 Overview
- 8.1.2 Porter's Five Forces Framework (Industry Attractiveness Analysis)
- 8.1.3 Global Value Chain Analysis
- 8.1.4 Market Dynamics (DROs)
- 8.2 Sources & References
- 8.3 List of Tables & Figures
- 8.4 Primary Insights
- 8.5 Data Pack
- 8.6 Glossary of Terms


