


 |
市場調查報告書
商品編碼
1684069
印度錨固與水泥漿:市場佔有率分析、產業趨勢與統計、成長預測(2025-2030 年)India Anchors and Grouts - Market Share Analysis, Industry Trends & Statistics, Growth Forecasts (2025 - 2030) |
||||||
價格
※ 本網頁內容可能與最新版本有所差異。詳細情況請與我們聯繫。
簡介目錄
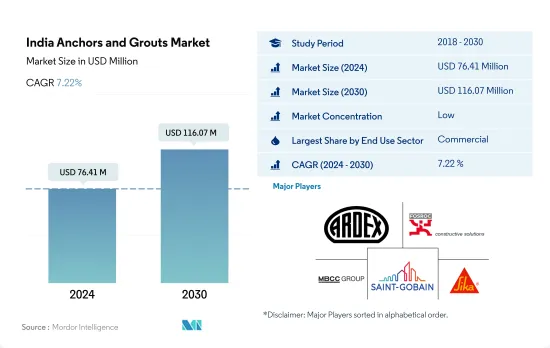
印度錨栓和水泥漿市場規模預計在 2024 年為 7,641 萬美元,預計到 2030 年將達到 1.1607 億美元,預測期內(2024-2030 年)的複合年成長率為 7.22%。
由於製造業的成長,工業部門很可能成為印度錨栓和水泥漿市場成長最快的終端使用領域。
- 預計 2022 年的市場規模與前一年同期比較成長 480 萬美元,反映出終端使用產業的需求增加。考慮到印度建築業的穩定擴張,預計到 2025 年將達到 1.4 兆美元,預計印度錨栓和水泥漿市場在 2023 年將實現大幅金額成長。
- 商業部門仍然是印度錨栓和水泥漿的主要消費者,這主要是由於正在建造的新建築。 2022 年,該行業的占地面積增加了約 4,700 萬平方英尺,反映了經濟的穩定成長。該行業對修復、恢復和抗震加固應用的需求也增加了這種消耗。
- 住宅領域也是印度錨栓和水泥漿的主要用戶,尤其是用於瓷磚接縫填充。這與印度住宅對瓷磚和大理石地板材料的偏好是一致的。印度是第二大瓷磚生產國,預計 2022 年瓷磚產量將達到 23 億平方公尺左右,支撐了瓷磚水泥漿的高需求。
- 預計印度的製造業、醫療保健、技能發展和教育領域將出現重大的建設發展。例如,製造業預計到 2030 年將達到 1 兆美元,工業 4.0 技術的投資預計到 2023 年將達到 13 億美元。工業和設施部門預計將見證市場價值成長最快,預測期內(2023-2030 年)的複合年成長率為 9.1%。
印度錨固和水泥漿市場趨勢
預計到 2030 年,印度甲級辦公室市場將達到 12 億平方英尺,推動商業建築領域的需求
- 2022 年,印度新的商業占地面積比 2021 年增加了 6.2%。零售業需求強勁,尤其是在前七大城市(德里國家首都轄區、班加羅爾、海得拉巴、孟買、普納、清奈和加爾各答),購物中心面積超過 260 萬平方英尺,比 2021 年成長 27%。展望 2023 年,由於外國直接投資 (FDI) 的激增推動了對新辦公、零售和其他設施的需求,該行業的新增占地面積預計將激增 3,800 萬平方英尺。尤其是,預計2023年建築業的外國直接投資流入將達到9,600萬美元。
- 2020 年,印度新建商業占地面積較 2019 年下降 68.3%。下降的主要原因是政府在全國範圍內實施封鎖,導致正在進行的計劃停止,供應鏈緊張,勞動力供應受到影響。然而,隨著 2021 年限制措施的放鬆,出現了強勁復甦,新建占地面積激增約 5.26 億平方英尺。此外,2021 年綠建築舉措顯著增加,約有 55% 的商業計劃採用了永續性,進一步刺激了該領域的需求。
- 展望 2030 年,印度新的商業占地面積預計將達到 3.58 億平方英尺,較 2023 年大幅成長。這一成長帶來了對購物中心、辦公空間和其他商業設施的需求。例如,印度前七大城市的甲級辦公大樓市場到 2026 年將擴大到 10 億平方英尺,到 2030 年將進一步擴大到 12 億平方英尺。因此,預計該國新的商業占地面積在預測期內將實現 5.26% 的強勁成長率。
住宅需求增加和房地產行業的擴張將刺激住宅行業的需求
- 2022年,印度住宅占地面積成長9.4%,高於前一年。印度住宅需求激增,前七大城市(德里國家首都轄區、班加羅爾、海得拉巴、孟買、浦那、普納清奈和加爾各答)總合建造約 402,000 套新房,比 2021 年增加 44%。 2023 年第一季,這些城市的住宅銷售量達到 114,000 套,比上年大幅增加 99,500 多套。因此,預計 2023 年印度新建住宅占地面積將比 2022 年增加約 7,100 萬平方英尺。
- 2020年,印度住宅產業遭遇挫折,新屋占地面積與前一年同期比較%。下降的原因是全國範圍內的封鎖、供應鏈中斷、勞動力短缺、建築生產率放緩以及外國投資下降。不過,印度住宅房地產市場在 2021 年有所復甦,排名前七位的城市增加了約 163,000 套住宅。這一激增導致 2021 年住宅領域的新建占地面積與 2020 年相比大幅增加,達到約 6.49 億平方英尺。
- 展望未來,預計 2023 年至 2030 年間印度住宅產業的複合年成長率將達到 2.95%。這一成長得益於持續的住宅需求、不斷增加的投資和有利的政府政策。特別是到2030年,預計印度40%以上的人口將居住在都市區,這將帶來約2500萬套額外經濟適用住宅的需求。此外,到2030年,主要城市的住宅房地產市場預計將達到150萬套,這將進一步推動該領域的需求。
印度錨固和水泥漿產業概況
印度錨栓和水泥漿市場比較分散,前五大公司佔了33.18%的市佔率。該市場的主要企業是:Ardex Group、Fosroc, Inc.、MBCC Group、Saint-Gobain和Sika AG(按字母順序排列)。
其他福利
- Excel 格式的市場預測 (ME) 表
- 3 個月的分析師支持
目錄
第 1 章執行摘要和主要發現
第2章 報告要約
第 3 章 簡介
- 研究假設和市場定義
- 研究範圍
- 調查方法
第4章 產業主要趨勢
- 終端使用領域趨勢
- 商業的
- 業/設施
- 基礎設施
- 住宅
- 重大基礎設施計劃(目前和已宣布)
- 法律規範
- 價值鏈與通路分析
第 5 章。市場區隔(包括市場規模、2030 年預測、成長前景分析)
- 最終用途領域
- 商業的
- 業/設施
- 基礎設施
- 住宅
- 子產品
- 水泥基固定材料
- 樹脂固定
- 依技術分類
- 環氧水泥漿
- 聚氨酯(PU)水泥漿
- 其他類型
第6章 競爭格局
- 關鍵策略趨勢
- 市場佔有率分析
- 業務狀況
- 公司簡介
- Ardex Group
- Cera-Chem Pvt. Ltd.
- Don Construction Products Ltd.
- Fosroc, Inc.
- LATICRETE International, Inc.
- MAPEI SpA
- MBCC Group
- Saint-Gobain
- Sika AG
- Thermax Limited
第7章:執行長的關鍵策略問題
第 8 章 附錄
- 世界概況
- 概述
- 五力分析框架(產業吸引力分析)
- 全球價值鏈分析
- 市場動態(DRO)
- 資訊來源和進一步閱讀
- 圖片列表
- 關鍵見解
- 資料包
- 詞彙表
簡介目錄
Product Code: 50002022
The India Anchors and Grouts Market size is estimated at 76.41 million USD in 2024, and is expected to reach 116.07 million USD by 2030, growing at a CAGR of 7.22% during the forecast period (2024-2030).
Owing to the growth in manufacturing industries, the industrial sector is likely to be the fastest-growing end-use sector for the Indian anchors and grouts market
- In 2022, the market value increased by USD 4.8 million compared to the previous year, reflecting the growing demand from end-use sectors. Considering the steady expansion of India's construction industry, which is expected to reach USD 1.4 trillion by 2025, the Indian anchors and grouts market was projected to record a significant increase in value in 2023.
- The commercial sector remains the primary consumer of anchors and grouts in India, largely due to the ongoing construction of new buildings. In 2022, the sector added approximately 47 million sq. ft of new floor area, a reflection of the steady economic growth. The sector's need for repair, restoration, and seismic strengthening applications also contributes to this consumption.
- The residential sector is another major user of anchors and grouts in India, particularly for tile joint filling. This is in line with the higher preference for tile or marble flooring in Indian homes. India's status as the second-largest producer of ceramic tiles, with a production volume of around 2.3 billion sq. m in 2022, underscores the high demand for tile joint grouts.
- Significant construction developments are expected in India's manufacturing, healthcare, skill development, and education sectors. The manufacturing sector, for example, is expected to reach a value of USD 1 trillion by 2030, with investments in Industry 4.0 technologies having been projected to reach USD 1.3 billion in 2023. The industrial and institutional sector is expected to experience the most rapid growth in market value, with a CAGR of 9.1% during the forecast period (2023-2030).
India Anchors and Grouts Market Trends
India's Grade A office market is expected to reach 1.2 billion sq. ft by 2030 and is likely to drive the demand for the commercial construction sector
- In 2022, India's new commercial floor area saw a 6.2% volume growth compared to 2021. The retail sector, particularly in the top seven cities (Delhi NCR, Bangalore, Hyderabad, Mumbai, Pune, Chennai, and Kolkata), witnessed robust demand, adding over 2.6 million sq. ft of mall space, a 27% increase from 2021. Looking ahead to 2023, the sector's new floor area is expected to surge by 38 million sq. ft, driven by a surge in foreign direct investment (FDI) fueling the need for new offices, retail outlets, and other facilities. Notably, the FDI equity inflow for construction development in 2023 was projected to hit USD 96 million.
- In 2020, India's commercial new floor area plummeted by 68.3% in volume compared to 2019. This decline was primarily due to a nationwide lockdown imposed by the government, which disrupted ongoing projects, strained supply chains, and impacted labor availability. However, as restrictions eased in 2021, the country witnessed a significant rebound, with the new floor area surging by approximately 526 million sq. ft. Additionally, 2021 saw a notable uptick in green building initiatives, with around 55% of commercial projects embracing sustainability, further bolstering the demand for the sector.
- Looking ahead to 2030, India's commercial new floor area is projected to hit 358 million sq. ft, a significant jump from 2023. This surge drives a growing appetite for shopping malls, office spaces, and other commercial facilities. For instance, India's Grade A office market in the top seven cities is set to expand to 1 billion sq. ft by 2026 and further to 1.2 billion sq. ft by 2030. Consequently, the country's commercial new floor area is poised to witness a robust CAGR of 5.26% during the forecast period.
Rise in demand for housing units and increasing real estate sector to boost residential sector demand
- In 2022, India witnessed a 9.4% growth in residential floor area, outpacing the previous year. The demand for housing in the country surged, with the top seven cities (Delhi NCR, Bangalore, Hyderabad, Mumbai, Pune, Chennai, and Kolkata) collectively adding approximately 402,000 new units, marking a 44% increase from 2021. In Q1 2023, housing sales in these cities reached 1.14 lakh units, a staggering jump of over 99,500 units from the previous year. Consequently, it was projected that the residential new floor area in India would expand by approximately 71 million sq. ft in 2023 compared to 2022.
- In 2020, the residential sector in India faced a setback, witnessing a 6.25% decline in new floor area compared to the previous year. This decline was attributed to the nationwide lockdown, disruptions in the supply chain, labor shortages, reduced construction productivity, and a dip in foreign investments. However, in 2021, the Indian residential real estate market rebounded, adding around 163,000 new residential units across the top seven cities. This surge translated into a significant increase of about 649 million sq. ft in the residential sector's new floor area in 2021 compared to 2020.
- Looking ahead, the residential sector in India is poised to exhibit a CAGR of 2.95% in terms of volume from 2023 to 2030. This growth can be attributed to sustained housing demand, increased investments, and favorable government policies. Notably, by 2030, it is projected that over 40% of India's population will reside in urban areas, driving a demand for approximately 25 million additional affordable housing units. Furthermore, by 2030, the residential real estate market is expected to hit 1.5 million units in key cities, further fueling the demand in the sector.
India Anchors and Grouts Industry Overview
The India Anchors and Grouts Market is fragmented, with the top five companies occupying 33.18%. The major players in this market are Ardex Group, Fosroc, Inc., MBCC Group, Saint-Gobain and Sika AG (sorted alphabetically).
Additional Benefits:
- The market estimate (ME) sheet in Excel format
- 3 months of analyst support
TABLE OF CONTENTS
1 EXECUTIVE SUMMARY & KEY FINDINGS
2 REPORT OFFERS
3 INTRODUCTION
- 3.1 Study Assumptions & Market Definition
- 3.2 Scope of the Study
- 3.3 Research Methodology
4 KEY INDUSTRY TRENDS
- 4.1 End Use Sector Trends
- 4.1.1 Commercial
- 4.1.2 Industrial and Institutional
- 4.1.3 Infrastructure
- 4.1.4 Residential
- 4.2 Major Infrastructure Projects (current And Announced)
- 4.3 Regulatory Framework
- 4.4 Value Chain & Distribution Channel Analysis
5 MARKET SEGMENTATION (includes market size, forecasts up to 2030 and analysis of growth prospects.)
- 5.1 End Use Sector
- 5.1.1 Commercial
- 5.1.2 Industrial and Institutional
- 5.1.3 Infrastructure
- 5.1.4 Residential
- 5.2 Sub Product
- 5.2.1 Cementitious Fixing
- 5.2.2 Resin Fixing
- 5.2.2.1 By Technology
- 5.2.2.1.1 Epoxy Grout
- 5.2.2.1.2 Polyurethane (PU) Grout
- 5.2.3 Other Types
6 COMPETITIVE LANDSCAPE
- 6.1 Key Strategic Moves
- 6.2 Market Share Analysis
- 6.3 Company Landscape
- 6.4 Company Profiles
- 6.4.1 Ardex Group
- 6.4.2 Cera-Chem Pvt. Ltd.
- 6.4.3 Don Construction Products Ltd.
- 6.4.4 Fosroc, Inc.
- 6.4.5 LATICRETE International, Inc.
- 6.4.6 MAPEI S.p.A.
- 6.4.7 MBCC Group
- 6.4.8 Saint-Gobain
- 6.4.9 Sika AG
- 6.4.10 Thermax Limited
7 KEY STRATEGIC QUESTIONS FOR CONCRETE, MORTARS AND CONSTRUCTION CHEMICALS CEOS
8 APPENDIX
- 8.1 Global Overview
- 8.1.1 Overview
- 8.1.2 Porter's Five Forces Framework (Industry Attractiveness Analysis)
- 8.1.3 Global Value Chain Analysis
- 8.1.4 Market Dynamics (DROs)
- 8.2 Sources & References
- 8.3 List of Tables & Figures
- 8.4 Primary Insights
- 8.5 Data Pack
- 8.6 Glossary of Terms
02-2729-4219
+886-2-2729-4219
 灌漿袋市場至2030年的預測:按產品類型、袋子材料、分銷管道、應用、最終用戶、地區的全球分析
 錨固劑和水泥漿市場規模、佔有率、趨勢分析報告:按產品、應用、地區、細分市場預測,2025-2030 年
 瓷磚水泥漿市場規模、佔有率和成長分析(按類型、應用和地區)- 行業預測 2025-2032
 環氧水泥漿市場規模、佔有率、成長分析,按類型、垂直產業、應用、最終使用領域和地區分類 - 2025 年至 2032 年產業預測
 2024 年預製水泥漿和黏合劑全球市場報告
 全球錨固劑和灌漿料市場規模(按產品、應用、地區、範圍和預測)
 錨栓和水泥漿市場:按產品、形式、分銷管道和最終用途 - 2025-2030 年全球預測
 預製灌漿和黏合劑市場:全球產業分析,規模,佔有率,成長,趨勢,預測,2024年~2033年
 全球錨固水泥漿市場:市場佔有率分析、產業趨勢/統計、成長預測(2024-2029)
 錨栓和水泥漿市場報告:2030 年趨勢、預測和競爭分析
▼