


 |
市場調查報告書
商品編碼
1685715
聚甲醛(POM):市場佔有率分析、產業趨勢與成長預測(2024-2029)Polyoxymethylene (POM) - Market Share Analysis, Industry Trends & Statistics, Growth Forecasts (2024 - 2029) |
||||||
價格
※ 本網頁內容可能與最新版本有所差異。詳細情況請與我們聯繫。
簡介目錄
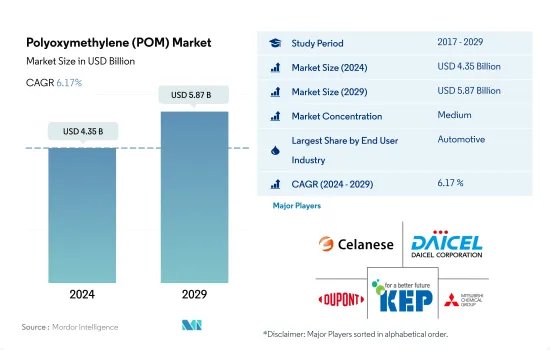
聚甲醛 (POM) 市場規模預計在 2024 年為 43.5 億美元,預計到 2029 年將達到 58.7 億美元,預測期內(2024-2029 年)的複合年成長率為 6.17%。
家電需求成長推動POM市場成長
- POM 樹脂用於現代燃料系統、內裝、泵浦、輸送和其他應用。 2022年聚縮醛樹脂在全球工程塑膠市場的銷售佔有率為3.56%。
- 汽車是POM樹脂的最大消費產業。 2021 年至 2022 年,汽車產量增加了 5% 以上。個人出行需求的不斷成長推動了汽車製造業的成長,尤其是二輪車和汽車的生產。這一趨勢在世界幾乎所有地區都在加劇,尤其是亞太地區。例如,2022年亞太地區的汽車產量佔有率將達到72.44%。
- 電氣和電子產業是POM樹脂的第二大消費產業。該產業2022年的產值約為5.807兆美元,較2021年成長1.16%。預計2023年全球消費性電子產品銷售額將成長至1.103兆美元,可能會推動對聚甲醛樹脂的需求。
- 工業機械是 POM 樹脂的第三大消費產業,由於全球工業機械製造業的成長,2022 年其收益佔有率為 16.93%。例如,2021年全球工具機產量為839億美元,與前一年同期比較成長24%。
- 航太工業是 POM 樹脂成長最快的消費產業。根據收入計算,預計 2023 年至 2029 年的複合年成長率為 6.81%。
亞太地區電子產業蓬勃發展推動市場成長
- 聚甲醛廣泛用於製造需要良好尺寸穩定性和滑動性能的精密零件。 2022 年全球 POM 市場佔整個工程塑膠市場收入的 3.55%。
- 2022年,亞太地區將成為最大的地區,價值佔有率為66.06%。這是由於電氣和電子以及汽車行業在 2022 年分別佔了 39.15% 和 28.83% 的市場佔有率。由於對遊戲機和電子設備的需求不斷增加,該地區對 POM 的需求預計也會增加。
- 2022年,歐洲成為全球第二大POM樹脂消費國。由於該地區汽車和電子設備產量的增加,同年POM市場收益佔有率為17.4%。例如,該地區的汽車產量在2022年將佔全球產量的12.28%。隨著汽車需求的增加,生產的汽車數量也將增加,預計將導致對POM樹脂的需求增加。
- 中東也是汽車產業帶動的消費成長地區之一。該地區的快速成長是由沙烏地阿拉伯等主要經濟體的經濟多元化所推動的。沙烏地阿拉伯目前的目標是到 2030 年減少對進口的依賴並發展國內汽車工業。因此,預計在預測期內汽車產業對 POM 樹脂的需求將大幅成長。
全球聚甲醛(POM)市場趨勢
電子產業的技術進步可能推動成長
- 電子產品技術創新的快速步伐推動著對更新、更快的電氣和電子產品的持續需求。 2022年,全球電氣電子產品銷售額預計將達到5.807兆美元,其中亞太地區佔74%的市場佔有率,其次是歐洲,佔13%。預計預測期內全球電氣和電子設備市場複合年成長率將達到 6.61%。
- 2018年,亞太地區經濟成長強勁,受中國、韓國、日本、印度和東南亞國協快速工業化的推動。 2020年,受疫情影響,晶片短缺、供應鏈效率低等因素導致全球電子電氣生產放緩,營收與前一年同期比較增僅0.1%。由於疫情期間人們被迫待在室內,對遠距工作和家庭娛樂消費性電子產品的需求推動了這一成長。
- 預測期內,對數位化、機器人、虛擬實境、擴增實境、物聯網 (IoT) 和 5G 連接等先進技術的需求預計將成長。預計 2027 年全球電氣和電子設備產量將成長 5.9%。由於技術進步,預測期內對消費性電子產品的需求預計將上升。例如,預計 2027 年全球消費性電子產業收益將達到約 9,046 億美元,而 2023 年將達到 7,191 億美元。因此,預計技術發展將在預測期內推動對電氣和電子產品的需求。
聚甲醛(POM)產業概覽
聚甲醛(POM)市場適度整合,前五大公司佔54.80%的市佔率。市場的主要企業有:塞拉尼斯公司、大賽璐公司、杜邦公司、韓國工程塑膠公司和三菱化學公司。
其他福利
- Excel 格式的市場預測 (ME) 表
- 3個月的分析師支持
目錄
第1章執行摘要和主要發現
第2章 報告要約
第3章 引言
- 研究假設和市場定義
- 研究範圍
- 調查方法
第4章 產業主要趨勢
- 最終用戶趨勢
- 航太
- 車
- 建築與施工
- 電氣和電子
- 包裝
- 進出口趨勢
- 聚甲醛(POM)貿易
- 價格趨勢
- 形狀趨勢
- 法律規範
- 阿根廷
- 澳洲
- 巴西
- 加拿大
- 中國
- EU
- 印度
- 日本
- 馬來西亞
- 墨西哥
- 奈及利亞
- 俄羅斯
- 沙烏地阿拉伯
- 南非
- 韓國
- 阿拉伯聯合大公國
- 英國
- 美國
- 價值鍊和通路分析
第5章市場區隔
- 最終用戶產業
- 航太
- 車
- 電氣和電子
- 工業/機械
- 其他最終用戶產業
- 地區
- 非洲
- 按國家
- 奈及利亞
- 南非
- 其他非洲國家
- 亞太地區
- 按國家
- 澳洲
- 中國
- 印度
- 日本
- 馬來西亞
- 韓國
- 其他亞太地區
- 歐洲
- 按國家
- 法國
- 德國
- 義大利
- 俄羅斯
- 英國
- 其他歐洲國家
- 中東
- 按國家
- 沙烏地阿拉伯
- 阿拉伯聯合大公國
- 其他中東地區
- 北美洲
- 按國家
- 加拿大
- 墨西哥
- 美國
- 南美洲
- 按國家
- 阿根廷
- 巴西
- 南美洲其他地區
- 非洲
第6章 競爭格局
- 關鍵策略趨勢
- 市場佔有率分析
- 商業狀況
- 公司簡介.
- Celanese Corporation
- China BlueChemical Ltd.
- Daicel Corporation
- DuPont
- Henan Energy Group Co., Ltd.
- Kolon BASF innoPOM, Inc.
- Korea Engineering Plastics Co., Ltd.
- Mitsubishi Chemical Corporation
- SABIC
- Yuntianhua Group Co., Ltd.
第7章:CEO面臨的關鍵策略問題
第 8 章 附錄
- 世界概況
- 概述
- 五力分析框架(產業吸引力分析)
- 全球價值鏈分析
- 市場動態(DRO)
- 資訊來源及延伸閱讀
- 圖片列表
- 關鍵見解
- 資料包
- 詞彙表
簡介目錄
Product Code: 46627
The Polyoxymethylene (POM) Market size is estimated at 4.35 billion USD in 2024, and is expected to reach 5.87 billion USD by 2029, growing at a CAGR of 6.17% during the forecast period (2024-2029).
Increasing demand for consumer electronics to aid market growth for POM
- POM resins are used in modern fuel systems, interior appearance, pumping, conveying, and other applications. Polyacetal resins had a revenue share of 3.56% of the global engineering plastics market in 2022.
- Automotive is the largest consumer of POM resins. Automotive production increased by over 5% from 2021 to 2022 by volume. With the increasing demand for private mobility, automotive manufacturing, especially the production of two-wheelers and cars, is on the rise. This trend has increased in almost all global regions, particularly in Asia-Pacific. For instance, vehicle production in Asia-Pacific held a volume share of 72.44% in 2022.
- The electrical and electronics industry is the second-largest consumer of POM resins. The industry had a production revenue of USD 5807 billion in 2022, increasing by 1.16% from 2021. Global consumer electronics revenue is projected to grow to USD 1103 billion in 2023, which may drive the demand for polyacetal resin.
- Industrial machinery is the third-largest consumer of POM resin, accounting for a revenue share of 16.93% in 2022 due to an increase in industrial machinery manufacturing at a global scale. For instance, in 2021, the global production value of machine tools was USD 83.9 billion, a 24% increase over the previous year.
- The aerospace industry is the fastest-growing consumer of POM resins. It is expected to record a CAGR of 6.81% by revenue between 2023 and 2029.
Growing electronics industry in Asia-Pacific to aid market growth
- Polyoxymethylene is widely used in the production of precision parts for applications requiring good dimensional stability and sliding properties. The global POM market held a revenue share of 3.55% of the overall engineering plastics market in 2022.
- In 2022, Asia-Pacific was the largest region, with a 66.06% value share. It witnessed a growth of 10.83% by value in the same year compared to 2021, attributed to the electrical and electronics and automotive industries, which held 39.15% and 28.83% of the market share, respectively, by value in 2022. With an increase in the demand for gaming consoles and electronic devices, the demand for POM is likely to increase in the region.
- Europe was the second-largest consumer of POM resins globally in 2022. The region held a revenue share of 17.4% of the POM market in the same year due to the increasing production of vehicles and electronics in the region. For example, the region's vehicle production held a share of 12.28% of global production in 2022. With the growing demand for vehicles, production is likely to increase, thus increasing the demand for POM resins.
- The Middle East is also one of the growing consumers led by the automotive industry. The rapid growth in the region can be accounted for by the attempts of major countries, like Saudi Arabia, at economic diversification. Saudi Arabia is currently aiming to reduce its import dependence and develop the domestic automotive industry by 2030. As a result, the demand for POM resins from the automotive industry is expected to grow significantly during the forecast period.
Global Polyoxymethylene (POM) Market Trends
Technological advancements in electronics industry may foster the growth
- The rapid pace of technological innovation in electronic products is driving the consistent demand for new and fast electrical and electronic products. In 2022, the global revenue of electrical and electronics stood at USD 5,807 billion, with Asia-Pacific holding a 74% market share, followed by Europe with a 13% share. The global electrical and electronics market is expected to record a CAGR of 6.61% during the forecast period.
- In 2018, the Asia-Pacific region witnessed strong economic growth owing to rapid industrialization in China, South Korea, Japan, India, and ASEAN countries. In 2020, due to the pandemic, there was a slowdown in global electrical and electronics production due to the shortage of chips and inefficiencies in the supply chain, which led to a stagnant growth rate of 0.1% in revenue compared to the previous year. This growth was driven by the demand for consumer electronics for remote working and home entertainment as people were forced to remain indoors during the pandemic.
- The demand for advanced technologies, such as digitalization, robotics, virtual reality, augmented reality, IoT (Internet of Things), and 5G connectivity, is expected to grow during the forecast period. Global electrical and electronics production is expected to register a growth rate of 5.9% in 2027. As a result of technological advancements, the demand for consumer electronics is expected to rise during the forecast period. For instance, the global consumer electronics industry is projected to witness a revenue reach of around USD 904.6 billion in 2027, compared to USD 719.1 billion in 2023. As a result, technological development is projected to lead the demand for electrical and electronic products during the forecast period.
Polyoxymethylene (POM) Industry Overview
The Polyoxymethylene (POM) Market is moderately consolidated, with the top five companies occupying 54.80%. The major players in this market are Celanese Corporation, Daicel Corporation, DuPont, Korea Engineering Plastics Co., Ltd. and Mitsubishi Chemical Corporation (sorted alphabetically).
Additional Benefits:
- The market estimate (ME) sheet in Excel format
- 3 months of analyst support
TABLE OF CONTENTS
1 EXECUTIVE SUMMARY & KEY FINDINGS
2 REPORT OFFERS
3 INTRODUCTION
- 3.1 Study Assumptions & Market Definition
- 3.2 Scope of the Study
- 3.3 Research Methodology
4 KEY INDUSTRY TRENDS
- 4.1 End User Trends
- 4.1.1 Aerospace
- 4.1.2 Automotive
- 4.1.3 Building and Construction
- 4.1.4 Electrical and Electronics
- 4.1.5 Packaging
- 4.2 Import And Export Trends
- 4.2.1 Polyoxymethylene (POM) Trade
- 4.3 Price Trends
- 4.4 Form Trends
- 4.5 Regulatory Framework
- 4.5.1 Argentina
- 4.5.2 Australia
- 4.5.3 Brazil
- 4.5.4 Canada
- 4.5.5 China
- 4.5.6 EU
- 4.5.7 India
- 4.5.8 Japan
- 4.5.9 Malaysia
- 4.5.10 Mexico
- 4.5.11 Nigeria
- 4.5.12 Russia
- 4.5.13 Saudi Arabia
- 4.5.14 South Africa
- 4.5.15 South Korea
- 4.5.16 United Arab Emirates
- 4.5.17 United Kingdom
- 4.5.18 United States
- 4.6 Value Chain & Distribution Channel Analysis
5 MARKET SEGMENTATION (includes market size in Value in USD and Volume, Forecasts up to 2029 and analysis of growth prospects)
- 5.1 End User Industry
- 5.1.1 Aerospace
- 5.1.2 Automotive
- 5.1.3 Electrical and Electronics
- 5.1.4 Industrial and Machinery
- 5.1.5 Other End-user Industries
- 5.2 Region
- 5.2.1 Africa
- 5.2.1.1 By Country
- 5.2.1.1.1 Nigeria
- 5.2.1.1.2 South Africa
- 5.2.1.1.3 Rest of Africa
- 5.2.2 Asia-Pacific
- 5.2.2.1 By Country
- 5.2.2.1.1 Australia
- 5.2.2.1.2 China
- 5.2.2.1.3 India
- 5.2.2.1.4 Japan
- 5.2.2.1.5 Malaysia
- 5.2.2.1.6 South Korea
- 5.2.2.1.7 Rest of Asia-Pacific
- 5.2.3 Europe
- 5.2.3.1 By Country
- 5.2.3.1.1 France
- 5.2.3.1.2 Germany
- 5.2.3.1.3 Italy
- 5.2.3.1.4 Russia
- 5.2.3.1.5 United Kingdom
- 5.2.3.1.6 Rest of Europe
- 5.2.4 Middle East
- 5.2.4.1 By Country
- 5.2.4.1.1 Saudi Arabia
- 5.2.4.1.2 United Arab Emirates
- 5.2.4.1.3 Rest of Middle East
- 5.2.5 North America
- 5.2.5.1 By Country
- 5.2.5.1.1 Canada
- 5.2.5.1.2 Mexico
- 5.2.5.1.3 United States
- 5.2.6 South America
- 5.2.6.1 By Country
- 5.2.6.1.1 Argentina
- 5.2.6.1.2 Brazil
- 5.2.6.1.3 Rest of South America
- 5.2.1 Africa
6 COMPETITIVE LANDSCAPE
- 6.1 Key Strategic Moves
- 6.2 Market Share Analysis
- 6.3 Company Landscape
- 6.4 Company Profiles (includes Global Level Overview, Market Level Overview, Core Business Segments, Financials, Headcount, Key Information, Market Rank, Market Share, Products and Services, and Analysis of Recent Developments).
- 6.4.1 Celanese Corporation
- 6.4.2 China BlueChemical Ltd.
- 6.4.3 Daicel Corporation
- 6.4.4 DuPont
- 6.4.5 Henan Energy Group Co., Ltd.
- 6.4.6 Kolon BASF innoPOM, Inc.
- 6.4.7 Korea Engineering Plastics Co., Ltd.
- 6.4.8 Mitsubishi Chemical Corporation
- 6.4.9 SABIC
- 6.4.10 Yuntianhua Group Co., Ltd.
7 KEY STRATEGIC QUESTIONS FOR ENGINEERING PLASTICS CEOS
8 APPENDIX
- 8.1 Global Overview
- 8.1.1 Overview
- 8.1.2 Porter's Five Forces Framework (Industry Attractiveness Analysis)
- 8.1.3 Global Value Chain Analysis
- 8.1.4 Market Dynamics (DROs)
- 8.2 Sources & References
- 8.3 List of Tables & Figures
- 8.4 Primary Insights
- 8.5 Data Pack
- 8.6 Glossary of Terms


