


 |
市場調查報告書
商品編碼
1685859
生物真菌:市場佔有率分析、行業趨勢和統計、成長預測(2025-2030 年)Biofungicides - Market Share Analysis, Industry Trends & Statistics, Growth Forecasts (2025 - 2030) |
||||||
價格
※ 本網頁內容可能與最新版本有所差異。詳細情況請與我們聯繫。
簡介目錄
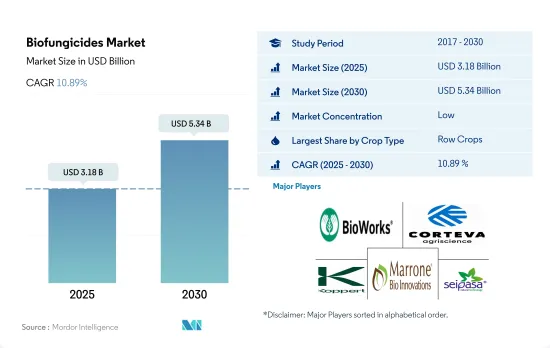
生物殺菌劑市場規模預計在 2025 年將達到 31.8 億美元,預計到 2030 年將達到 53.4 億美元,預測期內(2025-2030 年)的複合年成長率為 10.89%。
- 2022 年全球生物殺菌劑市場主要受連續作物生產的驅動,主要作物為大麥、玉米、小麥、油菜籽、黑麥、向日葵、大豆和水稻。這些作物以以金額為準約佔全球生物殺菌劑市場的84.1%。北美在該領域佔據主導地位,其中美國是領先國家,佔據整個市場的 71.4%。由於美國有大量土地用於連續種植作物,預計連續作物中生物殺菌劑的消費量將持續成長。
- 園藝作物,包括香蕉、蘋果、葡萄、番茄、洋蔥、黃瓜和捲心菜等水果和蔬菜,在 2022 年佔全球生物殺菌劑市場的 12.3%。歐洲地區佔據這一子區隔,佔 68.4% 的佔有率。義大利、法國和西班牙是該地區的主要國家,其中義大利佔39.7%的佔有率。
- 咖啡、茶、可可、棉花、菸草、橡膠和甘蔗等經濟作物佔2022年全球生物殺菌劑總消費量的4.0%。歐洲地區佔據此細分市場的子區隔,佔有42.1%的佔有率。法國、德國和義大利是該地區領先的國家,其中法國佔34.2%的佔有率。
- 由於健康問題,對有機水果和蔬菜的需求不斷增加,預計將在 2023-2029 年期間進一步推動市場作物領域對生物殺菌劑的消費。
- 在農業中,芽孢桿菌、木黴菌、鏈黴菌和假單胞菌是最常被用作生物殺菌劑的微生物。這些微生物已被證明能有效對抗腐霉菌、立枯絲核菌、鐮刀菌、核盤菌、串珠黴、灰黴病和白粉病等病原體。
- 歐洲是生物殺菌劑最大的市場,2022 年以以金額為準計算佔市場佔有率的 41.1%。法國是歐盟的主要農業生產國。小麥、黑麥、大麥、玉米、甜菜和燕麥是該國主要種植的作物。 2022 年,法國佔歐洲生物殺菌劑市場以金額為準的 27.5%。這一高佔有率主要歸功於該國有機種植面積大,到 2022 年將佔該地區有機種植總面積的 17.4%。
- 北美是生物殺菌劑的第二大消費地區,2022 年佔 37.7%,價值 8.268 億美元,預計 2029 年將達到 17.6 億美元。在美國等北美國家,政府推出的有機認證成本分攤計劃、建立成本分攤緩衝區的財政援助以及向有機農民提供低息貸款等舉措加速了生物殺菌劑的使用。預計 2023 年至 2029 年期間生物殺菌劑市場複合年成長率為 11.5%。
- 多種作用方式以及一些生物殺菌劑在生物防治和促進植物生長方面發揮的作用預計將推動全球生物殺菌劑市場的發展。預計 2023 年至 2029 年期間市場複合年成長率為 10.8%。
生物殺菌劑市場的全球趨勢
在北美和歐洲,由於人們對有機農業的認知不斷提高以及政府的舉措,有機農業產量達到了歷史最高水準。
- 有機農業已成為永續糧食系統的主要貢獻者,並已在全球 187 個國家實踐。截至2021年,全球有機農地面積為7,230萬公頃,2018年至2021年間各地區平均成長2.9%。有機種植面積為1,440萬公頃,佔有機農地總面積的19.9%。
- 有機農業最強大的市場是北美和歐洲,這兩個地區佔世界有機種植面積的 41.0%。 2022年,歐洲將擁有650萬公頃有機耕地,佔總有機耕地面積的44.1%。北美和歐洲最重要的有機種植作物是蘋果、草莓、穀物和橄欖。
- 亞太地區的新興國家也正在加入有機農業運動,並在生產和供應新鮮有機農產品方面實現自給自足,以滿足國內需求。有機農業趨勢在亞太地區日益興起,2017 年至 2022 年間,該地區的有機土地面積將增加 18.8%。該地區政府的主要措施也在有機農業擴張趨勢中發揮了關鍵作用。例如,日本的食品、農業和農村基本計畫旨在2030年將有機農場和有機農地的數量增加兩倍。
- 有機農業的成長源於人們對其益處的認知不斷提高,例如促進土壤健康、減少環境影響和生產更健康的食品。
人均有機食品支出的成長主要出現在美國和德國,這是由消費者對更健康、更永續食品的需求所推動的。
- 過去幾年,有機食品市場經歷了顯著成長,全球銷售額預計將從 2012 年的 708 億美元成長到 2020 年的 1,206 億美元。有機食品的趨勢受到多種因素的推動,包括消費者對更健康、更永續的食品選擇的需求不斷成長,以及對傳統農業對環境影響的認知不斷提高。預計未來幾年全球有機食品市場將持續維持成長趨勢。
- 根據有機貿易協會 2021 年的一項調查,當年有機水果和蔬菜的銷售額成長了約 4.5%,佔有機產品總銷售額的 15%。北美在有機產品平均支出方面佔據市場主導地位,2021年美國的人均支出達到186.7美元,是北美國家中最高的。歐洲有機食品市場預計也將強勁成長,其中德國 2021 年的人均有機食品支出最高,達到 75.6 美元。
- 有機食品市場仍由消費者可支配收入較高的已開發國家主導,但有機食品市場在新興國家預計也將成長。例如,亞太地區的工人階級不斷壯大,這使得有機食品更容易取得且價格更便宜,有助於擴大市場。
生物殺菌劑產業概況
生物殺菌劑市場較為分散,前五大企業市佔率合計為1.40%。市場的主要企業是:Bioworks Inc.、Corteva Agriscience、Koppert Biological Systems Inc.、Marrone Bio Innovations Inc. 和 Seipasa SA(按字母順序排列)。
其他福利
- Excel 格式的市場預測 (ME) 表
- 3 個月的分析師支持
目錄
第 1 章執行摘要和主要發現
第2章 報告要約
第 3 章 簡介
- 研究假設和市場定義
- 研究範圍
- 調查方法
第4章 產業主要趨勢
- 有機栽培面積
- 有機產品人均支出
- 法律規範
- 阿根廷
- 澳洲
- 巴西
- 加拿大
- 中國
- 埃及
- 法國
- 德國
- 印度
- 印尼
- 義大利
- 日本
- 墨西哥
- 荷蘭
- 奈及利亞
- 菲律賓
- 俄羅斯
- 南非
- 西班牙
- 泰國
- 土耳其
- 英國
- 美國
- 越南
- 價值鏈與通路分析
第5章 市場區隔
- 作物類型
- 經濟作物
- 園藝作物
- 耕作作物
- 地區
- 非洲
- 按國家
- 埃及
- 奈及利亞
- 南非
- 非洲其他地區
- 亞太地區
- 按國家
- 澳洲
- 中國
- 印度
- 印尼
- 日本
- 菲律賓
- 泰國
- 越南
- 其他亞太地區
- 歐洲
- 按國家
- 法國
- 德國
- 義大利
- 荷蘭
- 俄羅斯
- 西班牙
- 土耳其
- 英國
- 其他歐洲國家
- 中東
- 按國家
- 伊朗
- 沙烏地阿拉伯
- 其他中東地區
- 北美洲
- 按國家
- 加拿大
- 墨西哥
- 美國
- 北美其他地區
- 南美洲
- 按國家
- 阿根廷
- 巴西
- 南美洲其他地區
- 非洲
第6章 競爭格局
- 主要策略趨勢
- 市場佔有率分析
- 業務狀況
- 公司簡介.
- Andermatt Group AG
- Biolchim SPA
- Bioworks Inc.
- Certis USA LLC
- Corteva Agriscience
- Indogulf BioAg LLC(Biotech Division of Indogulf Company)
- Koppert Biological Systems Inc.
- Lallemand Inc.
- Marrone Bio Innovations Inc.
- Seipasa SA
第7章:執行長的關鍵策略問題
第 8 章 附錄
- 世界概況
- 概述
- 五力分析框架
- 全球價值鏈分析
- 市場動態(DRO)
- 資訊來源和進一步閱讀
- 圖片列表
- 關鍵見解
- 資料包
- 詞彙表
簡介目錄
Product Code: 48617
The Biofungicides Market size is estimated at 3.18 billion USD in 2025, and is expected to reach 5.34 billion USD by 2030, growing at a CAGR of 10.89% during the forecast period (2025-2030).
- The global biofungicides market in 2022 was primarily driven by the production of row crops, with the main crops being barley, corn, wheat, rapeseed, rye, sunflower, soybean, and rice. These crops accounted for approximately 84.1% of the global biofungicides market in terms of value. North America dominates this segment of the market, with the United States being the leading country, accounting for 71.4% of the total market value. The consumption of biofungicides in row crops is expected to continue to grow due to the considerable extent of area under the cultivation of these crops in the United States.
- Horticultural crops, including fruits and vegetables such as bananas, apples, grapes, tomatoes, onions, cucumbers, and cabbages, accounted for 12.3% of the global biofungicides market in 2022. The European region dominates this sub-segment of the market, accounting for a share of 68.4%. Italy, France, and Spain are the leading countries in this region, with Italy accounting for a share of 39.7%.
- Cash crops, including coffee, tea, cocoa, cotton, tobacco, rubber, and sugarcane, accounted for 4.0% of the total global consumption of biofungicides in 2022. The European region dominates this sub-segment of the market, accounting for a share of 42.1%. France, Germany, and Italy are the leading countries in this region, with France accounting for a share of 34.2%.
- The increased demand for organically produced fruits and vegetables, driven by health concerns, is expected to further boost the consumption of biofungicides in the crop segment of the market between 2023 and 2029.
- In agriculture, Bacillus, Trichoderma, Streptomyces, and Pseudomonas are the most commonly utilized microorganisms as bio fungicides. They have proven effective against pathogens such as Pythium, Rhizoctonia, Fusarium, Sclerotinia, Thielaviopsis, Botrytis, and powdery mildew.
- Europe is the largest market for biofungicides, accounting for a share of 41.1% in terms of value in 2022. France is the European Union's leading agricultural producer. Wheat, rye, barley, corn, sugar beet, and oats are among the major crops grown in the country. France accounted for a share of 27.5% of the European biofungicides market in terms of value in 2022. The high share percentage was primarily due to the country's extensive area under organic cultivation, accounting for 17.4% of the total organic area in the region in 2022.
- North America is the second-largest consumer of biofungicides; it accounted for a share of 37.7% in 2022, valued at USD 826.8 million, which is expected to reach USD 1.76 billion by 2029. Government initiatives in North American countries like the United States, such as the Organic Certificate cost-share program, providing financial assistance to establish a cost-share buffer zone, and low-interest loans for organic farmers, help accelerate the use of biofungicides. The biofungicides market is anticipated to register a CAGR of 11.5% between 2023 and 2029.
- The multiple modes of action and the role of a few biofungicides in both biocontrol and stimulating plant growth are expected to drive the market for biofungicides globally. The market is estimated to register a CAGR of 10.8% between 2023 and 2029.
Global Biofungicides Market Trends
Organic production is at an all-time high in North America and Europe, due to the increasing awareness and Government initiatives.
- Organic agriculture has emerged as a significant contributor to sustainable food systems, with 187 countries practicing it globally. As of 2021, there was 72.3 million ha of organic agricultural land worldwide, with an average increase of 2.9% across all regions from 2018 to 2021. Organic arable land accounted for 14.4 million ha, representing 19.9% of the total organic agricultural land.
- The strongest markets for organic farming are North America and Europe, accounting for 41.0% of the global organic arable land. In 2022, Europe had 6.5 million ha of organic arable land, equivalent to 44.1% of the overall organic arable agricultural area. The most significant crops grown organically in North America and Europe are apples, strawberries, cereals, and olives.
- Developing countries in Asia-Pacific are also joining the organic agriculture movement and becoming self-sufficient in producing and providing fresh organic produce to meet their domestic demand. The trend of organic farming is gaining momentum in Asia-Pacific, with the region recording an 18.8% increase in organic arable land from 2017 to 2022. The major initiatives by governments in the region also play a vital role in the growing trend of organic farming. For example, Japan's Basic Plan for Food, Agriculture, and Rural Areas aims to triple the number of organic farmers and lands by 2030.
- The growth of organic agriculture is driven by the rising awareness of the benefits of organic farming, such as promoting soil health, reducing environmental impacts, and producing healthier food.
Per capita spending of organic food majorly observed in United States and Germany, attributed to the consumer demand for healthier and sustainable food
- The organic food market experienced significant growth in the past few years, with global sales reaching USD 120.6 billion in 2020, up from USD 70.8 billion in 2012. The trend toward organic food is being driven by several factors, such as increasing consumer demand for healthier, more sustainable food options and a growing awareness of the environmental impact of conventional agriculture. The global organic food market is expected to continue its growth trend over the coming years.
- According to a survey conducted by the Organic Trade Association in 2021, sales of organic fruits and vegetables increased by around 4.5% in the same year, accounting for 15% of the overall organic sales. North America dominates the market in terms of average spending on organic products, with per capita spending in the United States reaching USD 186.7 in 2021, the highest among all North American countries. Europe is also expected to experience significant growth in the organic food market, with Germany accounting for the highest per capita spending of USD 75.6 in 2021.
- While the organic food market is still dominated by developed countries with high consumer disposable incomes, it is also expected to grow in developing nations. For example, the increasing number of working-class people in the Asia-Pacific region may contribute to the market's expansion due to the growing availability and affordability of organic food products.
Biofungicides Industry Overview
The Biofungicides Market is fragmented, with the top five companies occupying 1.40%. The major players in this market are Bioworks Inc., Corteva Agriscience, Koppert Biological Systems Inc., Marrone Bio Innovations Inc. and Seipasa SA (sorted alphabetically).
Additional Benefits:
- The market estimate (ME) sheet in Excel format
- 3 months of analyst support
TABLE OF CONTENTS
1 EXECUTIVE SUMMARY & KEY FINDINGS
2 REPORT OFFERS
3 INTRODUCTION
- 3.1 Study Assumptions & Market Definition
- 3.2 Scope of the Study
- 3.3 Research Methodology
4 KEY INDUSTRY TRENDS
- 4.1 Area Under Organic Cultivation
- 4.2 Per Capita Spending On Organic Products
- 4.3 Regulatory Framework
- 4.3.1 Argentina
- 4.3.2 Australia
- 4.3.3 Brazil
- 4.3.4 Canada
- 4.3.5 China
- 4.3.6 Egypt
- 4.3.7 France
- 4.3.8 Germany
- 4.3.9 India
- 4.3.10 Indonesia
- 4.3.11 Italy
- 4.3.12 Japan
- 4.3.13 Mexico
- 4.3.14 Netherlands
- 4.3.15 Nigeria
- 4.3.16 Philippines
- 4.3.17 Russia
- 4.3.18 South Africa
- 4.3.19 Spain
- 4.3.20 Thailand
- 4.3.21 Turkey
- 4.3.22 United Kingdom
- 4.3.23 United States
- 4.3.24 Vietnam
- 4.4 Value Chain & Distribution Channel Analysis
5 MARKET SEGMENTATION (includes market size in Value in USD and Volume, Forecasts up to 2030 and analysis of growth prospects)
- 5.1 Crop Type
- 5.1.1 Cash Crops
- 5.1.2 Horticultural Crops
- 5.1.3 Row Crops
- 5.2 Region
- 5.2.1 Africa
- 5.2.1.1 By Country
- 5.2.1.1.1 Egypt
- 5.2.1.1.2 Nigeria
- 5.2.1.1.3 South Africa
- 5.2.1.1.4 Rest of Africa
- 5.2.2 Asia-Pacific
- 5.2.2.1 By Country
- 5.2.2.1.1 Australia
- 5.2.2.1.2 China
- 5.2.2.1.3 India
- 5.2.2.1.4 Indonesia
- 5.2.2.1.5 Japan
- 5.2.2.1.6 Philippines
- 5.2.2.1.7 Thailand
- 5.2.2.1.8 Vietnam
- 5.2.2.1.9 Rest of Asia-Pacific
- 5.2.3 Europe
- 5.2.3.1 By Country
- 5.2.3.1.1 France
- 5.2.3.1.2 Germany
- 5.2.3.1.3 Italy
- 5.2.3.1.4 Netherlands
- 5.2.3.1.5 Russia
- 5.2.3.1.6 Spain
- 5.2.3.1.7 Turkey
- 5.2.3.1.8 United Kingdom
- 5.2.3.1.9 Rest of Europe
- 5.2.4 Middle East
- 5.2.4.1 By Country
- 5.2.4.1.1 Iran
- 5.2.4.1.2 Saudi Arabia
- 5.2.4.1.3 Rest of Middle East
- 5.2.5 North America
- 5.2.5.1 By Country
- 5.2.5.1.1 Canada
- 5.2.5.1.2 Mexico
- 5.2.5.1.3 United States
- 5.2.5.1.4 Rest of North America
- 5.2.6 South America
- 5.2.6.1 By Country
- 5.2.6.1.1 Argentina
- 5.2.6.1.2 Brazil
- 5.2.6.1.3 Rest of South America
- 5.2.1 Africa
6 COMPETITIVE LANDSCAPE
- 6.1 Key Strategic Moves
- 6.2 Market Share Analysis
- 6.3 Company Landscape
- 6.4 Company Profiles (includes Global Level Overview, Market Level Overview, Core Business Segments, Financials, Headcount, Key Information, Market Rank, Market Share, Products and Services, and Analysis of Recent Developments).
- 6.4.1 Andermatt Group AG
- 6.4.2 Biolchim SPA
- 6.4.3 Bioworks Inc.
- 6.4.4 Certis USA LLC
- 6.4.5 Corteva Agriscience
- 6.4.6 Indogulf BioAg LLC (Biotech Division of Indogulf Company)
- 6.4.7 Koppert Biological Systems Inc.
- 6.4.8 Lallemand Inc.
- 6.4.9 Marrone Bio Innovations Inc.
- 6.4.10 Seipasa SA
7 KEY STRATEGIC QUESTIONS FOR AGRICULTURAL BIOLOGICALS CEOS
8 APPENDIX
- 8.1 Global Overview
- 8.1.1 Overview
- 8.1.2 Porter's Five Forces Framework
- 8.1.3 Global Value Chain Analysis
- 8.1.4 Market Dynamics (DROs)
- 8.2 Sources & References
- 8.3 List of Tables & Figures
- 8.4 Primary Insights
- 8.5 Data Pack
- 8.6 Glossary of Terms
02-2729-4219
+886-2-2729-4219
 生物殺菌劑市場:按類型、形式、作物類型、物種、申請表分類 - 全球預測 2025-2030
 生物合理殺菌劑市場報告:2030 年趨勢、預測與競爭分析
 亞太地區代森錳鋅市場預測至 2030 年 - 區域分析 - 按形式、應用模式和作物類型
 北美代森錳鋅市場預測至 2030 年 - 區域分析 - 按形式、應用模式和作物類型
 代森錳鋅 2030 年市場預測:按類型、型態、用途、分銷管道、應用和地區進行的全球分析
 全球代森錳鋅市場 - 2023-2030
 代森錳鋅市場規模和預測、全球和地區佔有率、趨勢和成長機會分析報告範圍:按形式、應用模式和作物類型