


 |
市場調查報告書
商品編碼
1850069
自適應安全:市場佔有率分析、行業趨勢、統計數據和成長預測(2025-2030 年)Adaptive Security - Market Share Analysis, Industry Trends & Statistics, Growth Forecasts (2025 - 2030) |
||||||
※ 本網頁內容可能與最新版本有所差異。詳細情況請與我們聯繫。
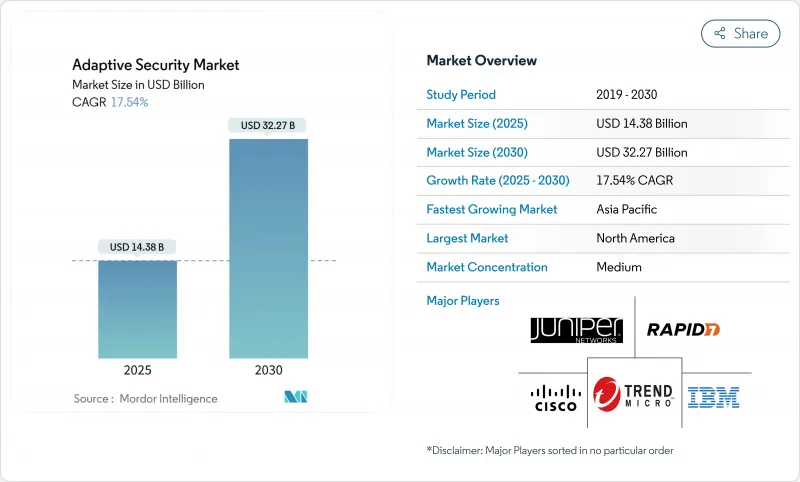
自適應安全市場預計在 2025 年達到 143.8 億美元,到 2030 年將達到 322.7 億美元,複合年成長率高達 17.54%。
這種擴展反映了從以邊界為中心的防禦體係向即時分析使用者行為、資產環境和威脅情報的自學習架構的快速轉變。政府的零信任要求、日益加重的監管處罰以及人工智慧攻擊流量的空前成長,迫使企業放棄靜態控制,並採取持續調整的安全措施。供應商正在將大規模語言模型推理、自動化策略編配和行為分析整合到整合平台中,以加快平均檢測和回應時間,同時降低管理開銷。由於董事會層級對品牌損害和勒索軟體支付的擔憂通常超過主動控制的成本,組織對此類架構的需求正在成長。
全球自適應安全市場趨勢與洞察
人工智慧產生的攻擊流量優於基於規則的防禦
借助人工智慧,攻擊者可以自動化網路釣魚、漏洞發現和橫向移動,產生能夠規避基於簽名的工具的流量模式。 CrowdStrike 將於 2025 年推出基於代理的人工智慧模組,以在端點和雲端工作負載中自主搜尋和遏制前所未見的惡意軟體。 Darktrace 的自主回應引擎已在中途攔截可疑會話,例如在 2025 年緩解 ClickFix 網路釣魚浪潮。 Darktrace 的自主回應引擎已在中途攔截可疑會話,例如在 2025 年緩解 ClickFix 網路釣魚浪潮。
監管要求推動合規主導的安全投資
歐盟的NIS2和DORA法規於2025年生效,規定對網路控制不力的行為處以最高1000萬歐元或相當於全球收入2%的罰款,並要求銀行、公用事業和數位服務供應商實施持續監控和最低權限。美國聯邦機構在第14028號行政命令下也面臨類似的壓力,CISA的零信任成熟度模型詳細列出了截至2027會計年度的階段性目標。美國國防部也對此進行了補充,要求所有網路在2027年前必須採用零信任框架。這些規定產生了乘數效應,推動了自適應安全市場的發展,因為企業正在尋求能夠透過單一控制措施滿足多項法規要求的整合平台。
網路安全人才短缺
根據Varonis的《2025年勞動力概況》,美國約有60萬網路安全負責人失業,而經驗豐富的負責人的失業率為零。亞洲的小型企業和中小企業面臨的困境最為嚴峻,日本的《2024年小型企業調查》指出,人才短缺是網路回應的最大障礙。這一人才缺口正在推動託管偵測和回應服務的發展,預計自適應安全市場服務領域的複合年成長率將達到17.8%。 Fortinet透過將GenAI策略手冊整合到FortiAnalyzer 2025中,解決了技能短缺的問題,使精幹團隊能夠對先前需要高級分析師才能處理的警報進行分類。
細分分析
到 2024 年,應用程式安全的自適應安全市場預計將達到 52.3 億美元,佔總收益的 36.4%,這得益於 API 濫用的增加。根據 Akamai 的《2025 年應用程式和 API》報告,API 佔所有觀察到的流量的 57%,並且日益被武器化。因此,企業正在部署執行時間檢查、模式檢驗和行為基準測試,以阻止繞過外圍閘道器的注入攻擊。同時,隨著零信任策略引擎直接內建到容器編排器和無伺服器執行時間中,為 DevOps 團隊提供原生保護,雲端安全正以 18.1% 的複合年成長率發展。 Syncloop 等供應商透過在 Kubernetes 叢集上提供無監督異常檢測來減少誤報和 SOC 疲勞。網路和端點控制仍然至關重要,但正在整合到平台捆綁包中,使買家能夠簡化遙測管道並自動執行殺傷鏈中斷。
到2024年,解決方案將佔總收入的62.6%,而將檢測、回應和合規報告外包給專家將進一步擴大自適應安全服務市場規模。技能短缺和全天候服務的需求,甚至促使財富500強企業也轉向託管編配。 Ciena對一家光纖網路客戶的案例研究展示了服務供應商如何將人工智慧主導的威脅分析打包到連接交易中,從而降低工業客戶的資本支出和技能負擔。服務供應商正在利用多租戶SIEM和AIOps來降低單位客戶成本並提高毛利率,從而強化了技術買家更重視結果而非工具所有權的循環。
自適應安全市場按應用(應用安全、網路安全等)、產品(解決方案和服務)、部署模式(本地和雲端)、最終用戶(金融服務、保險和保險業、政府、國防等)和地區細分。市場預測以美元計算。
區域分析
北美32.8%的佔有率由早期零信任試點計畫、雄厚的創業投資資金以及聯邦政府支出推動。 14028號行政命令和CISA指南要求聯邦機構持續進行身分驗證,這促使供應鏈中的私部門紛紛跟進。微軟為遷移到Security Copilot的政府機構提供了規範的藍圖,加速了最佳實踐在全部區域。當地人才庫和發達的網路保險市場也支撐了高保額產品的高價。
亞太地區將實現最快的成長速度,到2030年複合年成長率將達到19.3%。日本網路安全戰略委員會已累計1.2兆日圓用於公私合作研發項目,以培育整合後量子密碼技術和威脅資訊共用的國內供應商。新加坡的「智慧國家」計畫正在投資人工智慧系統控制中心(SOC)自動化,而跨國製造商正在將工廠遷往東南亞,並要求針對智慧工廠量身定做的安全措施。中國將在人工智慧安全專利領域佔據主導地位,到2023年將佔全球申請量的70%,促使周邊國家加快區域創新和跨境威脅共用協議的達成。
在監管加強的推動下,歐洲實現了強勁成長。 《國家資訊安全法2》(NIS2)強制能源、水務和運輸業者檢驗其供應鏈的穩健性,而《資料保護條例》(DORA)則將類似的規則擴展到金融機構。 ENISA 2025年的調查發現,政策採用率為86%,但預算分配僅為47%,這顯示對承包託管服務的需求正在增加。即將訂定的《網路彈性法案》將擴大其範圍,涵蓋所有數位產品,這將激發消費性電子產品製造商的新採購活動。
其他福利:
- Excel 格式的市場預測 (ME) 表
- 3個月的分析師支持
目錄
第1章 引言
- 研究假設和市場定義
- 調查範圍
第2章調查方法
第3章執行摘要
第4章 市場狀況
- 市場概況
- 市場促進因素
- 網路攻擊的數量和複雜程度正在增加
- 監理義務(GDPR、CCPA、DORA、NIS2 等)
- 企業雲端和 SaaS 擴充功能需要零信任控制
- 人工智慧產生的攻擊流量優於基於規則的防禦
- 機器對機器身份的擴散需要持續的風險評分
- 5G網路切片推動微分段的採用
- 市場限制
- 網路安全人才短缺
- 棕地IT 資產的高 TCO 和複雜的整合
- 具有專有通訊協定的傳統 OT/ICS 環境
- 多重雲端部署中的資料主權衝突
- 供應鏈分析
- 監管格局
- 技術展望(AI、UEBA、SSE、微分段、PQC)
- 波特五力分析
- 供應商的議價能力
- 買方的議價能力
- 新進入者的威脅
- 替代品的威脅
- 競爭對手之間的競爭
- 宏觀經濟趨勢的市場評估
第5章市場規模及成長預測
- 按用途
- 應用程式安全
- 網路安全
- 端點安全
- 雲端安全
- 其他
- 按報價
- 解決方案
- 服務
- 按部署模型
- 本地部署
- 雲端基礎
- 按最終用戶
- BFSI
- 政府和國防
- 製造業(工業4.0)
- 醫療保健和生命科學
- 能源和公共產業
- 其他
- 按地區
- 北美洲
- 美國
- 加拿大
- 墨西哥
- 南美洲
- 巴西
- 阿根廷
- 南美洲其他地區
- 歐洲
- 英國
- 德國
- 法國
- 瑞典
- 其他歐洲地區
- 亞太地區
- 中國
- 日本
- 印度
- 澳洲
- 韓國
- 其他亞太地區
- 中東和非洲
- 沙烏地阿拉伯
- 阿拉伯聯合大公國
- 土耳其
- 南非
- 其他中東和非洲地區
- 北美洲
第6章 競爭態勢
- 市場集中度
- 策略性舉措(MandA、資金籌措、產品發布)
- 市佔率分析
- 公司簡介
- Cisco Systems
- IBM Corp.
- Fortinet
- Palo Alto Networks
- Trend Micro
- Rapid7
- Check Point Software
- Juniper Networks
- Trellix
- CrowdStrike
- Zscaler
- Illumio
- Lumen Technologies
- Aruba(HPE)
- Microsoft Security
- Okta
- Netskope
- Darktrace
- Akamai/Guardicore
- WatchGuard(Panda)
第7章 市場機會與未來展望
The adaptive security market is valued at USD 14.38 billion in 2025 and is forecast to reach USD 32.27 billion by 2030, advancing at a robust 17.54% CAGR.
This expansion mirrors the rapid shift from perimeter-centric defenses to self-learning architectures that analyze user behavior, asset context, and threat intelligence in real time. Government zero-trust mandates, sharper regulatory penalties, and an unprecedented rise in AI-driven attack traffic are forcing enterprises to retire static controls and adopt continuously tuned safeguards. Vendors are embedding large-language-model reasoning, automated policy orchestration, and behavior analytics into unified platforms, reducing mean time to detect and respond while lowering administrative overhead. Organic demand is amplified by mounting board-level concern over brand damage and ransomware payouts that routinely exceed the cost of proactive controls.
Global Adaptive Security Market Trends and Insights
AI-Generated Attack Traffic Outpacing Rule-Based Defenses
AI-enabled adversaries now automate phishing, vulnerability discovery, and lateral movement, generating traffic patterns that evade signature-based tools. CrowdStrike launched agentic AI modules in 2025 that autonomously hunt and contain never-seen malware across endpoints and cloud workloads.Darktrace's autonomous response engine already blocks suspicious sessions mid-stream, such as its 2025 mitigation of ClickFix phishing waves. These proof points illustrate how real-time behavior models supersede static rule sets, cementing demand for adaptive security market solutions that refine policies without human tuning.
Regulatory Mandates Driving Compliance-Driven Security Investments
The EU NIS2 and DORA regulations that took effect in 2025 impose fines up to EUR 10 million or 2% of global turnover for inadequate cyber controls, forcing banks, utilities, and digital service providers to implement continuous monitoring and least-privilege access. U.S. federal agencies face identical pressure under Executive Order 14028, with CISA's Zero-Trust Maturity Model detailing phased milestones through fiscal 2027.The U.S. Department of Defense complements this with a mandatory zero-trust framework for all networks by 2027. Together, these mandates create a multiplier effect that boosts the adaptive security market as firms seek unified platforms capable of mapping a single control to multiple regulations.
Shortage of Skilled Cybersecurity Talent
There are nearly 600,000 unfilled U.S. cybersecurity roles, and experienced practitioners enjoy zero percent unemployment, according to Varonis' 2025 labor snapshot. Small firms and Asian SMEs struggle most, with Japan's 2024 SME survey showing staff shortages as the top cyber-readiness barrier. This gap encourages managed detection and response services and fuels the 17.8% CAGR forecast for the Services segment within the adaptive security market. Fortinet answered the skills crunch by embedding GenAI playbooks into FortiAnalyzer 2025, enabling lean teams to triage alerts that formerly required senior analysts.
Other drivers and restraints analyzed in the detailed report include:
- Enterprise Cloud and SaaS Sprawl Necessitating Zero-Trust Controls
- Surge in Machine-to-Machine Identities Requiring Continuous Risk Scoring
- High TCO and Integration Complexity for Brownfield IT Estates
For complete list of drivers and restraints, kindly check the Table Of Contents.
Segment Analysis
Adaptive security market size for Application Security stood at USD 5.23 billion in 2024 and preserved a 36.4% slice of revenue owing to heightened API exploitation. Akamai's 2025 Apps and API report revealed that APIs account for 57% of all observed traffic and are increasingly weaponized. Enterprises therefore deploy runtime inspection, schema validation, and behavior baselining to block injection attacks that bypass perimeter gateways. Cloud Security, meanwhile, advances at an 18.1% CAGR as zero-trust policy engines embed directly into container orchestrators and serverless runtimes, giving DevOps teams native safeguards. Vendors such as Syncloop layer unsupervised anomaly detection over Kubernetes clusters, reducing false positives and easing SOC fatigue. Network and endpoint controls remain essential but converge into platform bundles so buyers can streamline telemetry pipelines and automate kill-chain disruption.
Despite Solutions retaining 62.6% of 2024 sales, the adaptive security market size for Services will grow faster as boards outsource detection, response, and compliance reporting to experts. Skills shortages and 24X7 coverage needs push even Fortune 500 firms toward managed orchestration. Ciena's case study on optical network customers shows service providers packaging AI-driven threat analytics into connectivity deals, offloading capex and skill burdens for industrial clients. Service providers leverage multitenant SIEMs and AIOps to reduce per-customer cost and expand gross margin, reinforcing a cycle where technology buyers prefer outcomes over tool ownership.
Adaptive Security Market is Segmented by Application (Application Security, Network Security, and More), Offering (Solutions and Services), Deployment Model (On-Premises and Cloud-Based), End User (BFSI, Government and Defense, and More), and by Geography. The Market Forecasts are Provided in Terms of Value (USD).
Geography Analysis
North America's 32.8% share stems from early zero-trust pilots, venture funding depth, and federal spending. Executive Order 14028 and CISA guidance obligate federal agencies to deploy continuous authentication, spurring private-sector imitation in supply chains. Microsoft provides prescriptive blueprints for agencies migrating to Security Copilot, accelerating best-practice diffusion across the region. Local talent pools and a well-developed cyber-insurance market also sustain premium pricing for high-assurance products.
Asia-Pacific is set for the fastest climb at a 19.3% CAGR through 2030. Japan's Cybersecurity Strategy Council earmarked JPY 1.2 trillion for public-private R&D programs, fostering domestic vendors that integrate post-quantum cryptography and threat-intel sharing. Singapore's Smart Nation blueprint injects funding for AI SOC automation, while multinational manufacturers relocate facilities to Southeast Asia and demand adaptive safeguards for smart factories. China's dominance in AI security patents, accounting for 70% of 2023 global filings, puts pressure on neighbors to accelerate local innovation and cross-border threat-sharing pacts.
Europe records solid growth on the back of regulatory heft. NIS2 forces energy, water, and transport operators to verify supply-chain hardening, while DORA extends similar rules to financial entities. ENISA's 2025 survey showed 86% policy adoption but only 47% budget allocation, implying pent-up demand for turnkey managed services. The upcoming Cyber Resilience Act broadens coverage to all digital products, fueling fresh procurements among consumer-electronics manufacturers.
- Cisco Systems
- IBM Corp.
- Fortinet
- Palo Alto Networks
- Trend Micro
- Rapid7
- Check Point Software
- Juniper Networks
- Trellix
- CrowdStrike
- Zscaler
- Illumio
- Lumen Technologies
- Aruba (HPE)
- Microsoft Security
- Okta
- Netskope
- Darktrace
- Akamai / Guardicore
- WatchGuard (Panda)
Additional Benefits:
- The market estimate (ME) sheet in Excel format
- 3 months of analyst support
TABLE OF CONTENTS
1 INTRODUCTION
- 1.1 Study Assumptions and Market Definition
- 1.2 Scope of the Study
2 RESEARCH METHODOLOGY
3 EXECUTIVE SUMMARY
4 MARKET LANDSCAPE
- 4.1 Market Overview
- 4.2 Market Drivers
- 4.2.1 Escalating volume and sophistication of cyber-attacks
- 4.2.2 Regulatory mandates (GDPR, CCPA, DORA, NIS2, etc.)
- 4.2.3 Enterprise cloud and SaaS sprawl needing zero-trust controls
- 4.2.4 AI-generated attack traffic outpacing rule-based defenses
- 4.2.5 Surge in machine-to-machine identities requiring continuous risk scoring
- 4.2.6 5G network-slicing driving micro-segmentation adoption
- 4.3 Market Restraints
- 4.3.1 Shortage of skilled cyber-security talent
- 4.3.2 High TCO and integration complexity for brown-field IT estates
- 4.3.3 Legacy OT/ICS environments with proprietary protocols
- 4.3.4 Data-sovereignty conflicts in multi-cloud deployments
- 4.4 Supply-Chain Analysis
- 4.5 Regulatory Landscape
- 4.6 Technological Outlook (AI, UEBA, SSE, micro-segmentation, PQC)
- 4.7 Porter's Five Force Analysis
- 4.7.1 Bargaining Power of Suppliers
- 4.7.2 Bargaining Power of Buyers
- 4.7.3 Threat of New Entrants
- 4.7.4 Threat of Substitutes
- 4.7.5 Competitive Rivalry
- 4.8 Assesment of Macroeconomic Trends on the Market
5 MARKET SIZE AND GROWTH FORECASTS (VALUE)
- 5.1 By Application
- 5.1.1 Application Security
- 5.1.2 Network Security
- 5.1.3 Endpoint Security
- 5.1.4 Cloud Security
- 5.1.5 Others
- 5.2 By Offering
- 5.2.1 Solutions
- 5.2.2 Services
- 5.3 By Deployment Model
- 5.3.1 On-premise
- 5.3.2 Cloud-based
- 5.4 By End User
- 5.4.1 BFSI
- 5.4.2 Government and Defense
- 5.4.3 Manufacturing (Industry 4.0)
- 5.4.4 Healthcare and Life Sciences
- 5.4.5 Energy and Utilities
- 5.4.6 Others
- 5.5 By Geography
- 5.5.1 North America
- 5.5.1.1 United States
- 5.5.1.2 Canada
- 5.5.1.3 Mexico
- 5.5.2 South America
- 5.5.2.1 Brazil
- 5.5.2.2 Argentina
- 5.5.2.3 Rest of South America
- 5.5.3 Europe
- 5.5.3.1 United Kingdom
- 5.5.3.2 Germany
- 5.5.3.3 France
- 5.5.3.4 Sweden
- 5.5.3.5 Rest of Europe
- 5.5.4 Asia-Pacific
- 5.5.4.1 China
- 5.5.4.2 Japan
- 5.5.4.3 India
- 5.5.4.4 Australia
- 5.5.4.5 South Korea
- 5.5.4.6 Rest of Asia-Pacific
- 5.5.5 Middle East and Africa
- 5.5.5.1 Saudi Arabia
- 5.5.5.2 United Arab Emirates
- 5.5.5.3 Turkey
- 5.5.5.4 South Africa
- 5.5.5.5 Rest of Middle East and Africa
- 5.5.1 North America
6 COMPETITIVE LANDSCAPE
- 6.1 Market Concentration
- 6.2 Strategic Moves (MandA, funding, product launches)
- 6.3 Market Share Analysis
- 6.4 Company Profiles (includes Global level Overview, Market level overview, Core Segments, Financials as available, Strategic Information, Market Rank/Share, Products and Services, Recent Developments)
- 6.4.1 Cisco Systems
- 6.4.2 IBM Corp.
- 6.4.3 Fortinet
- 6.4.4 Palo Alto Networks
- 6.4.5 Trend Micro
- 6.4.6 Rapid7
- 6.4.7 Check Point Software
- 6.4.8 Juniper Networks
- 6.4.9 Trellix
- 6.4.10 CrowdStrike
- 6.4.11 Zscaler
- 6.4.12 Illumio
- 6.4.13 Lumen Technologies
- 6.4.14 Aruba (HPE)
- 6.4.15 Microsoft Security
- 6.4.16 Okta
- 6.4.17 Netskope
- 6.4.18 Darktrace
- 6.4.19 Akamai / Guardicore
- 6.4.20 WatchGuard (Panda)
7 MARKET OPPORTUNITIES AND FUTURE OUTLOOK
- 7.1 White-space and Unmet-need Assessment


