


 |
市場調查報告書
商品編碼
1687075
天然纖維增強複合材料:市場佔有率分析、行業趨勢和成長預測(2025-2030)Natural Fiber Reinforced Composites - Market Share Analysis, Industry Trends & Statistics, Growth Forecasts (2025 - 2030) |
||||||
※ 本網頁內容可能與最新版本有所差異。詳細情況請與我們聯繫。
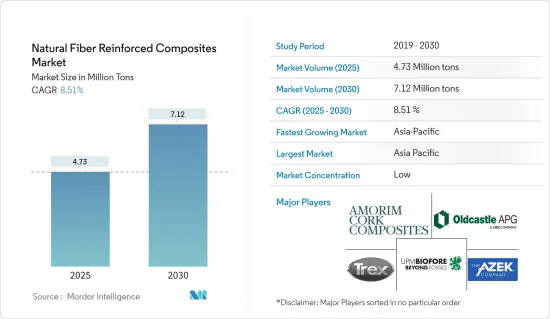
預計 2025 年天然纖維增強複合材料市場規模為 473 萬噸,到 2030 年將達到 712 萬噸,預測期內(2025-2030 年)的複合年成長率為 8.51%。
從中期來看,生物基複合材料需求增加以及全球汽車產業成長等因素預計將在 2024-2029 年期間推動天然纖維增強複合材料市場的發展。
關鍵亮點
- 然而,水分吸附、有限的加工溫度、與大多數聚合物基質的不相容性以及由於暴露於外部環境而導致的劣化問題可能是限制因素。
- 其在建築業日益成長的受歡迎程度預計將為市場帶來新的機會。
- 預計亞太地區將主導市場,並在 2024 年至 2029 年期間實現最高複合年成長率。
天然纖維增強複合材料的市場趨勢
建築業可望主導市場
- 建築材料產業對環保材料的需求一直很大。基於天然纖維增強聚合物的複合材料由於其眾多優點,擴大被用於土木工程和建築應用。
- 複合材料在建築業中發揮著至關重要的作用。工業柱、儲槽、大跨距屋蓋結構、高層建築、輕型門窗、家具、輕型建築、橋樑零件和完整的橋樑系統都採用複合材料。複合材料在建築業實現長期永續性變得越來越重要。
- 近年來,建築業的投資大幅增加。根據牛津經濟研究院預測,2020年至2030年間,全球建築業規模預計將成長4.5兆美元(42%),達到15.2兆美元。此外,預計2020年至2030年間,中國、印度、美國和印尼將佔全球建築業成長的58.3%。
- 此外,建築業是中國持續經濟發展和天然纖維增強複合材料產品需求的主要貢獻者。中國正在經歷建築業的蓬勃發展。此外,根據住宅及城鄉建設部的預測,到2025年,中國建築業預計仍將佔GDP的6%。
- 建築業是中國持續經濟發展的關鍵因素。根據中國國家統計局的數據,建築業產值將從2021年的29.3兆元(4.2兆美元)成長到2022年的31.2兆元(4.5兆美元)。預計到2030年,中國在建築上的支出將接近13兆美元,這為天然纖維增強複合材料提供了光明的前景。
- 在北美,美國佔據建築業的很大佔有率。除美國外,加拿大和墨西哥對建築業的投資也貢獻巨大。根據美國人口普查局的資料,2022年美國公共住宅年價值為91.5億美元,較2017年的67.4億美元成長35.7%。
- 同樣,根據歐盟統計局的數據,2023年歐元區建設業年均產值與2022年相比成長了0.2%,歐盟建築業年均產值成長了0.1%。建設業年產量增加最多的國家是羅馬尼亞(+30.7%)、波蘭(+18.9%)和比利時(+10.7%)。
- 因此,預計上述趨勢將在 2024-2029 年期間影響建築領域天然纖維增強複合材料的成長。
亞太地區可望主導市場
- 預計亞太地區將主導全球市場。中國、印度和日本等國家建設活動的增加推動了該地區天然纖維增強複合材料的使用增加。
- 據住宅和城鄉建設部稱,預計到2025年,中國建築業佔GDP的比重仍將維持在6%。為了響應這項預測,中國政府於2022年1月發布了一項五年計劃,旨在使建築業更加永續、更加主導品質。
- 同樣,天然纖維增強複合材料在電子工業中的應用迅速擴大,也可能支持該國的工業成長。根據印度品牌資產基金會(IBEF)預測,到2025年,印度電子製造業規模預計將達到5,200億美元。
- 此外,汽車是天然纖維增強複合材料的主要消費者之一。印度汽車工業在技術進步和宏觀經濟擴張中發揮關鍵作用,因此是印度經濟表現的關鍵指標。
- 此外,印度政府正在透過「加快採用和製造(混合動力汽車和)電動車」計畫鼓勵採用電動車(EV),並在某些領域強制使用電動車,從而創造發展勢頭,目標是到 2030 年實現 30% 的電動車普及率。該計劃將為電動車創造需求獎勵,並支持在城市中心部署充電技術和充電站。印度政府設定的目標是,到 2030 年,印度銷售的 70% 商用車、30% 私家車、40% 公車和 80% 兩輪和三輪車都將電動化。
- 因此,預計在2024-2029年期間,新的政府措施和投資將推動亞太其他地區天然纖維增強複合材料市場的需求。
天然纖維增強複合材料產業概況
天然纖維增強複合材料市場較為分散。主要參與企業(不分先後順序)包括 Trex Company Inc.、The AZEK Company Inc.、Oldcastle APG Inc.、UPM 和 Amorim Cork Composites SA。
其他福利
- Excel 格式的市場預測 (ME) 表
- 3個月的分析師支持
目錄
第1章 引言
- 調查前提條件
- 研究範圍
第2章調查方法
第3章執行摘要
第4章 市場動態
- 驅動程式
- 對生物基複合材料的需求不斷增加
- 全球汽車產業的成長
- 限制因素
- 吸濕性、加工溫度受限、與大多數聚合物基質不相容
- 因暴露於外在環境而導致的劣化問題
- 產業價值鏈分析
- 波特五力分析
- 供應商的議價能力
- 買家的議價能力
- 新進入者的威脅
- 替代品的威脅
- 競爭程度
第5章市場區隔
- 纖維
- 木纖維複合材料
- 非木纖維複合材料
- 棉布
- 亞麻
- 紅麻
- 麻
- 其他非木纖維複合材料(黃麻、劍麻、馬尼拉麻、椰殼纖維、鳳梨、香蕉)
- 聚合物
- 熱固性樹脂
- 熱塑性塑膠
- 聚乙烯
- 聚丙烯
- 聚氯乙烯
- 其他熱塑性塑膠(聚碳酸酯、聚醯胺、聚丁烯對苯二甲酸酯(PBT))
- 最終用戶產業
- 航太
- 車
- 海洋
- 建築與施工
- 電氣和電子
- 運動的
- 其他終端用戶產業(電力業(風力發電機)、醫療等)
- 地區
- 亞太地區
- 中國
- 印度
- 日本
- 韓國
- 馬來西亞
- 泰國
- 印尼
- 越南
- 其他亞太地區
- 北美洲
- 美國
- 加拿大
- 墨西哥
- 歐洲
- 德國
- 英國
- 法國
- 義大利
- 西班牙
- 北歐國家
- 土耳其
- 俄羅斯
- 其他歐洲國家
- 南美洲
- 巴西
- 阿根廷
- 哥倫比亞
- 南美洲其他地區
- 中東和非洲
- 沙烏地阿拉伯
- 卡達
- 阿拉伯聯合大公國
- 奈及利亞
- 埃及
- 南非
- 其他中東和非洲地區
- 亞太地區
第6章競爭格局
- 併購、合資、合作與協議
- 市場排名分析
- 主要企業策略
- 公司簡介
- Amorim Cork Composites SA
- Beologic
- BPREG Composites
- Fiberon
- FKuR
- Flexform Technologies
- Green Dot Bioplastics
- GreenGran BN
- JELU-WERK J. Ehrler GmbH & Co. KG
- Oldcastle APG
- TECNARO GmbH
- The AZEK Company Inc.
- Trex Company Inc.
- UFP Technologies Inc.
- UPM
- Wuhu Haoxuan Wood Plastic Composite Co. Ltd
第7章 市場機會與未來趨勢
- 在建築業越來越受歡迎
The Natural Fiber Reinforced Composites Market size is estimated at 4.73 million tons in 2025, and is expected to reach 7.12 million tons by 2030, at a CAGR of 8.51% during the forecast period (2025-2030).
In the medium term, factors such as the increasing demand for bio-based composites and the growth of the global automotive industry are likely to drive the natural fiber-reinforced composites market between 2024 and 2029.
Key Highlights
- However, moisture adsorption, restricted processing temperature, incompatibility with most polymer matrices, and degradation issues due to exposure to the external environment are likely to act as restraints for the market.
- Nevertheless, increasing popularity in the building and construction industry is expected to provide new opportunities for the market.
- Asia-Pacific is expected to dominate the market and is likely to witness the highest CAGR from 2024 to 2029.
Natural Fiber Reinforced Composites Market Trends
The Construction Industry is Expected to Dominate the Market
- There is always a continuous requirement for eco-friendly materials in the building materials industry. Natural fiber-reinforced polymer-based composites are increasingly used in civil engineering construction applications due to their numerous advantages.
- In the building and construction industry, composite materials are extremely significant. Industrial supports, tanks, long-span roof structures, high-rise buildings and lightweight doors, windows, furnishings, lightweight buildings, bridge components, and complete bridge systems have all employed composite materials. Composite materials are becoming increasingly essential in the construction industry to achieve long-term sustainability.
- The construction sector has witnessed major investments in recent years. According to Oxford Economics, the global construction industry is expected to grow by USD 4.5 trillion, or 42%, between 2020 and 2030 to reach USD 15.2 trillion. Also, China, India, the United States, and Indonesia are expected to account for 58.3% of global growth in construction between 2020 and 2030.
- Additionally, the construction sector is a key contributor to China's continued economic development and demand for natural fiber-reinforced composite products. China is amid a construction mega-boom. Moreover, as per the forecast given by the Ministry of Housing and Urban-Rural Development, the Chinese construction sector is expected to maintain a 6% share of the country's GDP going into 2025.
- The construction sector is a key player in China's continued economic development. According to the National Bureau of Statistics of China, the value of construction output accounted for CNY 31.2 trillion (USD 4.5 trillion) in 2022, up from CNY 29.3 trillion (USD 4.2 trillion) in 2021. China is expected to spend nearly USD 13 trillion on buildings by 2030, creating a positive outlook for natural fiber-reinforced composites.
- In North America, the United States has a major share in the construction industry. Besides the United States, Canada and Mexico contribute significantly to investments in the construction sector. According to the United States Census Bureau Data, the annual value of public residential construction in the United States was valued at USD 9.15 billion in 2022, an increase of 35.7% compared to USD 6.74 billion in 2017.
- Similarly, as per the Eurostat, the annual average production in construction for 2023, compared to 2022, increased by 0.2% in the euro area and by 0.1% in the European Union. The highest annual increases in construction production were recorded in Romania (+30.7%), Poland (+18.9%), and Belgium (+10.7%).
- Hence, the aforementioned trends are projected to influence the growth of natural fiber-reinforced composites in the construction sector between 2024 and 2029.
Asia-Pacific is Expected to Dominate the Market
- Asia-Pacific is expected to dominate the global market. With growing construction activities in countries such as China, India, and Japan, the usage of natural fiber-reinforced composites is increasing in the region.
- As per the Ministry of Housing and Urban-Rural Development, the Chinese construction sector is expected to maintain a 6% share of the country's GDP going into 2025. With the given forecasts, the Chinese government unveiled a five-year plan in January 2022 to make the construction sector more sustainable and quality-driven.
- Similarly, the surging application of natural fiber-reinforced composites in the electronics industry is likely to support the country's industry growth. According to the India Brand Equity Foundation (IBEF), the Indian electronics manufacturing industry is expected to reach USD 520 billion by 2025.
- Furthermore, automotive is among the major consumers of natural fiber-reinforced composites. The automotive industry in India is an important indicator of the Indian economic performance, as this sector plays a vital role in both technological advancements and macroeconomic expansion.
- Additionally, the Indian government has created momentum through its Faster Adoption and Manufacturing of (Hybrid and) Electric Vehicles schemes that encourage, and in some segments, mandate the adoption of electric vehicles (EV), intending to reach 30% EV penetration by 2030. The scheme creates demand incentives for EVs and supports the deployment of charging technologies and stations in urban centers. The government has set a target of 70% of all commercial cars, 30% of private cars, 40% of buses, and 80% of two-wheelers and three-wheelers sold in India by 2030 to be electric.
- Hence, the new policies and investments made by different governments are expected to boost the demand for the natural fiber-reinforced composites market in the rest of Asia-Pacific between 2024 and 2029.
Natural Fiber Reinforced Composites Industry Overview
The natural fiber reinforced composites market is fragmented in nature. Major players (not in any particular order) include Trex Company Inc., The AZEK Company Inc., Oldcastle APG Inc., UPM, and Amorim Cork Composites SA.
Additional Benefits:
- The market estimate (ME) sheet in Excel format
- 3 months of analyst support
TABLE OF CONTENTS
1 INTRODUCTION
- 1.1 Study Assumptions
- 1.2 Scope of the Study
2 RESEARCH METHODOLOGY
3 EXECUTIVE SUMMARY
4 MARKET DYNAMICS
- 4.1 Drivers
- 4.1.1 Increasing Demand for Bio-based Composites
- 4.1.2 Growth in the Automotive Industry Worldwide
- 4.2 Restraints
- 4.2.1 Moisture Adsorption, Restricted Processing Temperature, and Incompatibility with Most of the Polymer Matrices
- 4.2.2 Degradation Issue Due to Exposure to the External Environment
- 4.3 Industry Value Chain Analysis
- 4.4 Porter's Five Forces Analysis
- 4.4.1 Bargaining Power of Suppliers
- 4.4.2 Bargaining Power of Buyers
- 4.4.3 Threat of New Entrants
- 4.4.4 Threat of Substitute Products and Services
- 4.4.5 Degree of Competition
5 MARKET SEGMENTATION (Market Size in Volume)
- 5.1 Fiber
- 5.1.1 Wood Fiber Composites
- 5.1.2 Non-wood Fiber Composites
- 5.1.2.1 Cotton
- 5.1.2.2 Flax
- 5.1.2.3 Kenaf
- 5.1.2.4 Hemp
- 5.1.2.5 Other Non-wood Fiber Composites (Jute, Sisal, Abaca, Coir, Pineapple, and Banana)
- 5.2 Polymer
- 5.2.1 Thermosets
- 5.2.2 Thermoplastics
- 5.2.2.1 Polyethylene
- 5.2.2.2 Polypropylene
- 5.2.2.3 Poly Vinyl Chloride
- 5.2.2.4 Other Thermoplastics (Polycarbonate, Polyamide, and Polybutylene Terephthalate (PBT))
- 5.3 End-user Industry
- 5.3.1 Aerospace
- 5.3.2 Automotive
- 5.3.3 Marine
- 5.3.4 Building and Construction
- 5.3.5 Electrical and Electronics
- 5.3.6 Sports
- 5.3.7 Other End-user Industries (Power Industry (Wind Turbines), Medical, etc.)
- 5.4 Geography
- 5.4.1 Asia-Pacific
- 5.4.1.1 China
- 5.4.1.2 India
- 5.4.1.3 Japan
- 5.4.1.4 South Korea
- 5.4.1.5 Malaysia
- 5.4.1.6 Thailand
- 5.4.1.7 Indonesia
- 5.4.1.8 Vietnam
- 5.4.1.9 Rest of Asia-Pacific
- 5.4.2 North America
- 5.4.2.1 United States
- 5.4.2.2 Canada
- 5.4.2.3 Mexico
- 5.4.3 Europe
- 5.4.3.1 Germany
- 5.4.3.2 United Kingdom
- 5.4.3.3 France
- 5.4.3.4 Italy
- 5.4.3.5 Spain
- 5.4.3.6 Nordic Countries
- 5.4.3.7 Turkey
- 5.4.3.8 Russia
- 5.4.3.9 Rest of Europe
- 5.4.4 South America
- 5.4.4.1 Brazil
- 5.4.4.2 Argentina
- 5.4.4.3 Colombia
- 5.4.4.4 Rest of South America
- 5.4.5 Middle East and Africa
- 5.4.5.1 Saudi Arabia
- 5.4.5.2 Qatar
- 5.4.5.3 United Arab Emirates
- 5.4.5.4 Nigeria
- 5.4.5.5 Egypt
- 5.4.5.6 South Africa
- 5.4.5.7 Rest of Middle East and Africa
- 5.4.1 Asia-Pacific
6 COMPETITIVE LANDSCAPE
- 6.1 Mergers and Acquisitions, Joint Ventures, Collaborations, and Agreements
- 6.2 Market Ranking Analysis
- 6.3 Strategies Adopted by Leading Players
- 6.4 Company Profiles
- 6.4.1 Amorim Cork Composites SA
- 6.4.2 Beologic
- 6.4.3 BPREG Composites
- 6.4.4 Fiberon
- 6.4.5 FKuR
- 6.4.6 Flexform Technologies
- 6.4.7 Green Dot Bioplastics
- 6.4.8 GreenGran BN
- 6.4.9 JELU-WERK J. Ehrler GmbH & Co. KG
- 6.4.10 Oldcastle APG
- 6.4.11 TECNARO GmbH
- 6.4.12 The AZEK Company Inc.
- 6.4.13 Trex Company Inc.
- 6.4.14 UFP Technologies Inc.
- 6.4.15 UPM
- 6.4.16 Wuhu Haoxuan Wood Plastic Composite Co. Ltd
7 MARKET OPPORTUNITIES AND FUTURE TRENDS
- 7.1 Increasing Popularity in the Building and Construction Industry
 全球雙組分纖維市場研究報告 - 產業分析、規模、佔有率、成長、趨勢和預測 2025 年至 2033 年
 連續纖維增強熱塑性塑膠 (CFR-TP) 市場,按纖維類型、按樹脂類型、按製造流程、按最終用戶、按國家和地區分類 - 2025 年至 2032 年全球行業分析、市場規模、市場佔有率和預測
 2025-2033 年連續纖維複合材料市場(按樹脂類型、產品類型、增強類型、垂直產業和地區分類)
 全球纖維增強複合材料市場(2018-2034)航太和國防 CF 纖維市場報告:2030 年趨勢、預測和競爭分析CFRTP 市場:依樹脂類型、產品類型、應用分類 - 2025-2030 年全球預測
 全球雙組分纖維市場(2024-2028)纖維增強複合材料市場:按纖維類型、基體類型和應用分類 - 2025-2030 年全球預測雙組分纖維市場:按類型、材料、最終產業、結構、應用、技術分類 - 2025-2030 年全球預測
 熱塑性碳複合材料市場規模、佔有率、趨勢分析報告:按原料、按應用、按地區、細分市場預測,2024-2030年