


 |
市場調查報告書
商品編碼
1687403
智慧電網資料分析-市場佔有率分析、產業趨勢與統計、成長預測(2025-2030)Smart Grid Data Analytics - Market Share Analysis, Industry Trends & Statistics, Growth Forecasts (2025 - 2030) |
||||||
※ 本網頁內容可能與最新版本有所差異。詳細情況請與我們聯繫。
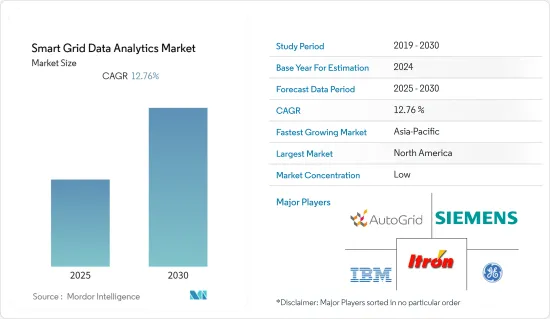
預測期內,智慧電網資料分析市場預計將以 12.76% 的複合年成長率成長
主要亮點
- 預計智慧電網資料分析市場的巨大需求將源於電力需求的不斷成長。根據國際能源總署 (IEA) 的數據,到 2030 年,全球電力需求在既定政策情境 (STEPS) 下將增加 5,900兆瓦時 (TWh),在宣布的承諾情境 (APS) 下將增加 7,000 多兆瓦。這相當於美國和歐盟目前的需求總和。
- 此外,該組織還計劃投資擴大、現代化和分散其電力基礎設施,以提高彈性。隨著時代的變化,電網基礎設施變得數位化和互聯化,確保關鍵數位通訊可靠且安全地流動。印度半島也啟動了許多計劃來解決電力問題。
- 海量資料的湧入正在推動市場成長。據 IEEE 稱,為了變得更加智慧,電網組件和管理它們的企業系統之間正在交換大量資料。基於該應用,交換的資訊有助於經濟地最佳化公用事業公司與其客戶之間的雙向電力流。
- 此外,智慧電網收集的資料比手動能源計量系統多得多。由於考慮到了更多的變量,這使我們能夠使用資料分析技術來創建非常現實的消費預測。因此,可用於開發分析模型的資料量呈指數級成長,擴大了智慧電網分析的機會。
- 然而,智慧電網系統的高成本以及對更多熟練專業人員的需求正在抑制市場成長。智慧電錶最顯著的限制是確保資本資金。智慧型系統比大多數服務供應商和使用者採用的標準計量設備相對昂貴。此外,不同的智慧電錶根據操作和消費者要求設計有不同的參數,從而避免使用需要技術純熟勞工進行操作和安裝的複雜設備。
- 新冠肺炎疫情對全球經濟帶來沉重打擊,尤其對電力產業的許多企業造成了重創,並導致其他許多產業的生產停擺。自從新冠疫情爆發以來,電價下跌,給許多能源電力產業的公司帶來了衝擊。此外,根據美國國防安全保障部(DHS)的數據,電力產業是受新冠疫情嚴重影響的16個關鍵基礎設施產業之一。
智慧電網資料分析市場趨勢
加大智慧電網計劃投資
- 隨著對智慧電網的資金投入以及再生能源來源被添加到現有電網,全球智慧電錶分析市場預計將成長。此外,由於新興經濟體研發更新不斷增加,預計市場將會成長。
- 例如,根據國際能源總署的數據,2021年輸配電網路中智慧電錶的投資將達到約214億美元,比前一年(2020年)成長13.8%。投資的大幅增加表明對數位基礎設施的需求日益成長,這反過來又為在市場上營運的供應商帶來了巨大的利益。
- 住宅、商業和工業領域安裝率的上升是由於政府框架和政策的不斷變化。包括中國和美國在內的幾個新興國家正在大規模推廣智慧電錶,這主要得益於各自政府的持續支持。預計上述因素將推動對分析解決方案的需求,以處理智慧電錶產生的大量資料。
- 在美國,ConEd 和 Duke 等私人公司擴大使用智慧電錶。事實證明,到 2021 年,美國公用事業公司將安裝約 1.11 億個先進(智慧)計量基礎設施 (AMI),佔所有電錶安裝量的 69% 以上。
此外,印度政府的智慧電錶國家計畫(SMNP)計畫在2022年6月前用新電錶取代2.5億個舊電錶。這將改善能源消耗和監控效率,並增加Discum的年收入。這可能導致每年產生更多的資料。 2022年,中國已宣布擴大投資計劃,國家電網公司將投入超過5,000億元人民幣,專注於建造特高壓計劃,升級配電網,提高電網數位化水準。由於這些因素,預計市場在預測期內將會成長。
亞太地區成長強勁
- 中國、日本和印度等地的人口成長正在增加對住宅基礎設施和電力使用的需求。因此,支持使用智慧電網的國家對電力的需求正在增加,這可能會為智慧電網資料分析創造市場。
- 智慧城市的發展有望提高該地區的市場競爭力。韓國宣布計劃向約 300 家公司投資 3.5 億美元,以協助發展該國的物聯網生態系統。三星電子和 SK 電訊合作啟動一項試點項目,在首爾東南部的一個城鎮建立基於物聯網的可再生能源基礎設施。
- 中國、印度和日本等國家的電力消耗不斷增加,推動了製定高效生產、分配和消費電力的新政策的需求。根據國際能源總署的報告,過去二十年東南亞能源消費量平均每年成長約3%。根據國際能源總署的報告,過去20年東南亞能源消費量平均每年成長約3%。在現行的 STEPS 政策設定下,這一趨勢預計將持續到 2030 年。
- 隨著更多創新能源儲存技術的使用,亞太地區的智慧電網市場可能會成長。亞太地區的能源公司現在越來越依賴智慧電網技術和基礎設施發展。例如,2022年2月,光寶科技與新加坡南洋理工大學合作,打造更節能的智慧電網和智慧家庭技術。光寶新加坡是台灣家電企業光寶科技的子公司,專注於半導體研發以及智慧汽車和電力設備的開發。
- 因此,所有上述因素結合起來可能會推動智慧電網資料分析市場的發展,進而可能在預測期內推動亞太地區的智慧電網資料分析市場的發展。
智慧電網資料分析產業概況
智慧電網資料分析市場分散且競爭激烈。新興企業不斷湧現,提供各種創新解決方案以滿足不同產業的需求,導致市場競爭加劇。此外,規模較大的公司被視為卓越績效的代名詞,因此有望享有競爭優勢。主要企業包括西門子股份公司、Itron 公司和 IBM 公司。
2022年12月,西門子宣布計畫在尼羅河Delta的達米埃塔地區提供175,000台智慧電錶和先進的配電管理系統。該訂單價值超過 4000 萬歐元(4,200 萬美元),授予北Delta電力配送公司 (NDEDC),作為其電網現代化和改進舉措的一部分。
2022 年 9 月,Itron 將把其工業物聯網 (IIoT) 網路解決方案與三星的 SmartThings 服務相結合,為公用事業公司提供改善分散式能源資源管理 (DERMS)、減少碳排放和吸引客戶的系統。該夥伴關係將使用 SmartThings Energy 服務,透過 Itron 的分散式智慧 (DI) 網路提供即時能源測量和使用趨勢。
其他福利:
- Excel 格式的市場預測 (ME) 表
- 3個月的分析師支持
目錄
第1章 引言
- 研究假設和市場定義
- 研究範圍
第2章調查方法
第3章執行摘要
第4章 市場洞察
- 市場概覽
- 產業價值鏈分析
- 產業吸引力-波特五力分析
- 供應商的議價能力
- 消費者議價能力
- 新進入者的威脅
- 替代品的威脅
- 競爭對手之間的競爭強度
- COVID-19 市場影響評估
第5章市場動態
- 市場促進因素
- 擴大智慧電網計劃投資
- 大量資料湧入
- 市場挑戰
- 智慧電網系統高成本,專業技術人員缺乏
- 監管問題、資料安全風險和技術要求可能會限制市場
第6章市場區隔
- 按部署
- 雲端基礎
- 本地
- 按解決方案
- 輸配電 (T&D) 網路
- 計量
- 客戶分析
- 按應用
- 進階測量基礎設施分析
- 需量反應分析
- 電網最佳化分析
- 按最終用戶產業
- 私營部門(中小企業和大型企業)
- 公共部門
- 按地區
- 北美洲
- 歐洲
- 亞太地區
- 拉丁美洲
- 中東和非洲
第7章競爭格局
- 公司簡介
- Siemens AG
- Itron Inc.
- AutoGrid Systems Inc.
- General Electric Company
- IBM Corporation
- SAP SE
- Tantalus System Corporation
- SAS Institute Inc.
- Hitachi Ltd
- Uplight Inc.
- Landis & Gyr Group AG
- Uptake Technologies Inc.
- Schneider Electric SE
- Oracle Corporation
- Amdocs Corporation
- Sensus USA Inc.(Xylem Inc.)
第8章投資分析
第9章 市場機會與未來趨勢
The Smart Grid Data Analytics Market is expected to register a CAGR of 12.76% during the forecast period.
Key Highlights
- A big need for a smart grid data analytics market is likely to come from the growing need for electricity. According to the International Energy Agency (IEA), the world's electricity demand will rise by 5,900 terawatt-hours (TWh) in the Stated Policies Scenario (STEPS) and by over 7,000 TWh in the Announced Pledges Scenario (APS) by 2030. This is the same as adding the current demand in the United States and the European Union.
- Moreover, organizations plan to invest in the expansion, modernization, and decentralization of the electricity infrastructure for improved resiliency. The infrastructure of the power grid has been getting more digitalized and connected over time, making it possible for important digital communications to flow reliably and safely. Across the Indian subcontinent, there have also been the beginnings of a number of projects that will help people with their electricity problems.
- An enormous influx of data has been driving market growth. According to the IEEE, to enable being smart, a massive amount of data has been exchanged between grid components and the enterprise systems that manage these components. Based on the application, the information exchanged helps economically optimize the bidirectional power flow between a utility and its customers.
- Furthermore, smart grids collect much more data than the manual energy meter reading system. This permits the use of data analysis techniques and the preparation of highly realistic consumption forecasts, as many more variables are taken into account. Therefore, the opportunities for smart grid analytics have been expanding because there has been an exponential increase in the amount of data available in order to develop analytical models.
- However, the high costs of smart grid systems and the need for more skilled professionals have been restraining the market's growth. The most prominent limitation of smart metering is the availability of capital funding. Smart systems are comparatively more expensive than the standard metering equipment that most service providers and users employ. Furthermore, different smart meters have been designed with various parameters based on operational and consumer requirements, inhibiting the use of complicated equipment that needs skilled labor for handling and installation.
- The COVID-19 epidemic hurt the world economy because it hurt a lot of businesses, especially in the electricity sector, and stopped work in a lot of other sectors. After COVID-19 broke out, the price of electricity went down, which hurt a lot of companies in the energy and power industries. Additionally, according to the US Department of Homeland Security (DHS), the utility sector was one of the 16 essential infrastructure sectors that the COVID-19 epidemic severely impacted.
Smart Grid Data Analytics Market Trends
Growing Investments in Smart Grid Projects
- The global smart metering analytics market is expected to grow because more money is being spent on smart grids and more renewable energy sources are being added to existing grids. Also, R&D is being updated more in developed economies, which should help the market grow.
- For instance, according to the IEA, in 2021, investments in smart meters in transmission and distribution electricity grids were valued at around USD 21.4 billion, a 13.8% rise in investments compared to the previous year, 2020. Such a significant rise in investments may indicate the growing need for digital infrastructure, thereby providing substantial profits to the vendors operating in the market.
- The rate of installations in the residential, commercial, and industrial sectors has been going up because of how the government framework and policies are always changing.Several emerging nations, including China and the United States, have witnessed a high-scale deployment of smart meters, mainly due to the continuous support of their respective governments. The factors above are expected to drive the demand for analytic solutions to handle the vast data from these smart meters.
- Smart meters are being used more and more by private utility companies in the United States, like ConEd and Duke.This is evident by the fact that, with smart meters deployed by utilities in the United States, about 111 million advanced (smart) metering infrastructure (AMI) installations were made in 2021, accounting for over 69% of all electric meter installations.
Additionally, the government of India's national initiative for smart meters (SMNP) intends to replace 250 million outdated meters with new ones in June 2022. It would improve the effectiveness of energy consumption and monitoring and enhance discoms' yearly income. This may result in the generation of more data per year. In 2022, China announced plans to increase investment, with the State Grid Corporation of China budgeting for more than CNY 500 billion and concentrating on ultra-high-voltage projects, upgrading the distribution network, and increasing levels of digitalization of its grids. Owing to these factors, the market studied is expected to witness growth during the forecast period.
Asia-Pacific to Witness the Significant Growth Rates
- Two highly populated nations, namely India and China, significantly dominate the Asia-Pacific region.Rising populations in places like China, Japan, and India have increased the demand for residential infrastructure and electricity use. This has increased the demand for electricity in countries that support the use of smart grids, which may create a market for smart grid data analytics.
- The growth of smart cities is anticipated to increase the region's market competencies. South Korea announced plans to invest USD 350 million in around 300 companies to help develop an IoT ecosystem within the country. A pilot is being launched in a town southeast of Seoul, in partnership with Samsung Electronics and SK Telecom, to set up IoT-based infrastructure for renewable energy.
- Power consumption has increased in nations like China, India, and Japan, which has increased the demand for new policies to create, distribute, or consume electricity effectively. Smart grid technology is used a lot in China, India, Japan, Australia, South Korea, and other countries in the area.According to IEA reports, Southeast Asia's energy consumption has grown by around 3% annually over the last twenty years on average. This trend is expected to continue until 2030 with STEPS' current policy settings.
- Because more innovative energy storage technologies are being used, the market for smart grids in APAC will grow.Energy companies in APAC nowadays are increasingly dependent on smart grid technologies and infrastructure development. For instance, in February 2022, LITE-ON and NTU Singapore collaborated to create a more energy-efficient smart grid and smart home technologies. LITE-ON Singapore is a subsidiary of the Taiwanese consumer electronics business LITEON, which focuses on semiconductor R&D as well as smart vehicle and power device development.
- Therefore, all the above factors combined may fuel the smart grid data analytics market, which, in turn, may boost the smart grid data analytics market in the Asia-Pacific region during the forecast period.
Smart Grid Data Analytics Industry Overview
The smart grid data analytics market is fragmented and highly competitive in nature. Owing to the emergence of new startups offering a broad range of innovative solutions catering to diverse industry requirements, the market has been witnessing intensifying competitive rivalry. Also, as the major players have been considered synonymous with good performance, they are expected to have a competitive edge. Key players include Siemens AG, Itron Inc., and IBM Corporation, among others.
In December 2022, Siemens announced plans to provide 175,000 smart meters and an advanced distribution management system in the Damietta area of the Nile Delta. The order, valued at over EUR 40 million (USD 42 million), was given to the North Delta Electricity Distribution Company (NDEDC) as part of the grid modernization and improvement initiative.
In September 2022, Itron combined its Industrial Internet of Things (IIoT) network solution with Samsung's SmartThings services to give utilities access to a system that improves distributed energy resource management (DERMS), cuts carbon emissions, and engages customers. The partnership will use the SmartThings Energy service to give real-time energy readings and usage trends using Itron's distributed intelligence (DI) network, which the business claims has millions of linked endpoints.
Additional Benefits:
- The market estimate (ME) sheet in Excel format
- 3 months of analyst support
TABLE OF CONTENTS
1 INTRODUCTION
- 1.1 Study Assumptions and Market Definition
- 1.2 Scope of the Study
2 RESEARCH METHODOLOGY
3 EXECUTIVE SUMMARY
4 MARKET INSIGHTS
- 4.1 Market Overview
- 4.2 Industry Value Chain Analysis
- 4.3 Industry Attractiveness - Porter's Five Forces Analysis
- 4.3.1 Bargaining Power of Suppliers
- 4.3.2 Bargaining Power of Consumers
- 4.3.3 Threat of New Entrants
- 4.3.4 Threat of Substitute Products
- 4.3.5 Intensity of Competitive Rivalry
- 4.4 Assessment of the Impact of COVID-19 on the Market
5 MARKET DYNAMICS
- 5.1 Market Drivers
- 5.1.1 Growing Investments in Smart Grid Projects
- 5.1.2 Enormous Influx of Data
- 5.2 Market Challenges
- 5.2.1 High Costs of Smart Grid Systems and Lack of Skilled Professionals
- 5.2.2 Regulatory Issues, Data Security Risks, and Technical Requirements may Restrain the Market
6 MARKET SEGMENTATION
- 6.1 By Deployment
- 6.1.1 Cloud-based
- 6.1.2 On-premise
- 6.2 By Solution
- 6.2.1 Transmission and Distribution (T&D) Network
- 6.2.2 Metering
- 6.2.3 Customer Analytics
- 6.3 By Application
- 6.3.1 Advanced Metering Infrastructure Analysis
- 6.3.2 Demand Response Analysis
- 6.3.3 Grid Optimization Analysis
- 6.4 By End-user Vertical
- 6.4.1 Private Sector (SMEs and Large Enterprises)
- 6.4.2 Public Sector
- 6.5 Geography
- 6.5.1 North America
- 6.5.2 Europe
- 6.5.3 Asia-Pacific
- 6.5.4 Latin America
- 6.5.5 Middle East & Africa
7 COMPETITIVE LANDSCAPE
- 7.1 Company Profiles
- 7.1.1 Siemens AG
- 7.1.2 Itron Inc.
- 7.1.3 AutoGrid Systems Inc.
- 7.1.4 General Electric Company
- 7.1.5 IBM Corporation
- 7.1.6 SAP SE
- 7.1.7 Tantalus System Corporation
- 7.1.8 SAS Institute Inc.
- 7.1.9 Hitachi Ltd
- 7.1.10 Uplight Inc.
- 7.1.11 Landis & Gyr Group AG
- 7.1.12 Uptake Technologies Inc.
- 7.1.13 Schneider Electric SE
- 7.1.14 Oracle Corporation
- 7.1.15 Amdocs Corporation
- 7.1.16 Sensus USA Inc. (Xylem Inc.)
8 INVESTMENT ANALYSIS
9 MARKET OPPORTUNITIES AND FUTURE TRENDS
 智慧電網數據分析市場報告,按解決方案(輸配電網路、計量、客戶分析)、部署、應用、最終用途垂直領域(私營部門、公共部門)和地區,2025 年至 2033 年電網最佳化解決方案市場報告,按類型(軟體、硬體)、應用(政府和公共部門、教育機構等)和地區,2025 年至 2033 年智慧電網分析市場:按服務產品、應用、部署、公共事業類型、組織規模分類 - 2025-2030 年全球預測
 全球智慧電網分析市場 2024-2031
 全球智慧電網分析市場評估:依部署類型、服務、應用、地區、機會、預測,2017-2031年
 智慧電網分析的全球市場:市場規模、佔有率、成長分析、按產品細分、按應用、按分析類型、按地區 - 預測(截至 2029 年)2024-2032 年智慧電網數據分析市場報告(按解決方案(輸電和配電網路、計量、客戶分析)、部署、應用、最終用途垂直領域(私營部門、公共部門)和區域)