


 |
市場調查報告書
商品編碼
1687869
捕碳封存:市場佔有率分析、行業趨勢和統計、成長預測(2025-2030 年)Carbon Capture And Storage - Market Share Analysis, Industry Trends & Statistics, Growth Forecasts (2025 - 2030) |
||||||
價格
※ 本網頁內容可能與最新版本有所差異。詳細情況請與我們聯繫。
簡介目錄
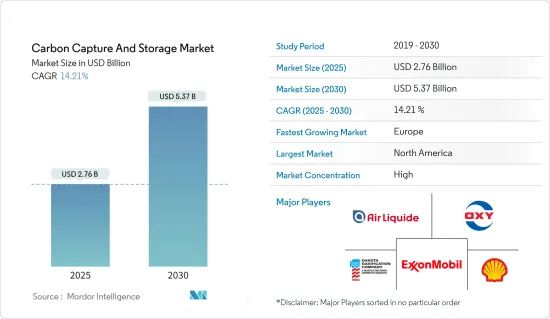
2025 年捕碳封存市場規模預估為 27.6 億美元,預計到 2030 年將達到 53.7 億美元,預測期內(2025-2030 年)的複合年成長率為 14.21%。
主要亮點
- 推動捕碳封存市場的主要因素是提高採收率(EOR)對二氧化碳注入技術的需求增加,以及政府對溫室氣體排放的嚴格監管。
- 另一方面,引入CCS技術的巨額成本和增加頁岩投資預計將阻礙市場成長。
- 人們對生質能源捕碳封存(BECCS)的興趣日益濃厚,這可能是未來的一個機會。
- 北美可能會主導市場,並預計在預測期內保持其主導地位,這主要是由於美國和加拿大的技術採用率不斷提高。
捕碳封存市場趨勢
石油和天然氣領域佔市場主導地位
- 儲存在陸地或海上深層地質構造中的二氧化碳將被利用,並利用石油和天然氣行業開發的 CCS 技術來提高石油採收率。
- 二氧化碳在石油工業中被廣泛用於提高採收率(EOR)。當二氧化碳注入油田時,它會與原油混合併膨脹,從而降低原油的黏度並維持或增加油藏內的壓力。這些過程的結合使得更多的石油流入生產井。
- 在其他情況下,二氧化碳不溶於油。在這種情況下,注入二氧化碳會增加儲存的壓力,使石油被沖向生產井。
- 二氧化碳在美國德克薩斯州的提高採收率作業中已有30多年的歷史。提高石油採收率(EOR)佔石油總產量的20%以上,有些油田的採收率接近70%。
- 此外,作為永續的一部分,石油和天然氣產業正在向碳捕獲和封存技術發展。
- 根據國際能源總署(IEA)的數據,到2022年,全球石油和天然氣能源相關的二氧化碳排放將增加2.5%至2.68億噸,達到11.2億噸以上。
- 能源燃燒、洩漏和排放產生的甲烷佔另外 10%,主要來自陸上石油和天然氣作業以及蒸氣生產。儘管天然氣價格上漲使得甲烷減量技術更具成本效益,但到 2022 年,甲烷排放仍將增加到約 1.35 億噸甲烷和約 40 億噸二氧化碳當量。
- 因此,印度公共石油和天然氣公司正積極採用碳捕獲、利用和儲存(CCUS) 等排放策略,以實現印度到 2070 年實現淨零排放的目標。
北美可能主導市場
- 北美在全球捕碳封存市場佔據主導地位。由於二氧化碳在 EOR 中的使用不斷增加,對乾淨科技的需求不斷增加,從而推動了美國和加拿大等國家的 CCS 市場的發展。
- 化學品生產、氫氣生產、肥料生產、天然氣加工和發電是美國捕獲和注入二氧化碳的產業之一。這些設施將捕獲並注入二氧化碳,儲存在地質構造中,或用於提高老化油田的石油產量。
- 根據美國預算辦公室的數據,截至 2023 年,美國將運作大約 15 個 CCS 設施投入營運,主要位於加工天然氣或生產燃料乙醇或肥料氨的工廠。
- 這15座設施每年將可捕獲約2,200萬噸二氧化碳,相當於美國年度二氧化碳排放總量的約0.4%。此外,美國有 121 個 CCS 設施正在建設或開發中,總合為每年捕獲 1.34 億噸二氧化碳。
- 根據國際能源總署的數據,在2023年運作中的2,200萬噸/年的CCS產能中,天然氣加工/液化天然氣將佔總量的約60%,即1,310萬噸/年,其次是燃料轉換,約佔18%,即390萬噸/年。
- 美國政府在《基礎建設投資與就業法案》(IIJA)下已撥款121億美元用於碳管理技術,其中25.4億美元將用於2022年至2025年的捕碳封存(CCS)示範計劃。
- 加拿大擁有豐富的煤炭、石油和天然氣蘊藏量,因此加拿大領先的清潔能源研究和技術組織CanmetENERGY正在探索如何將目前佔加拿大能源供應很大一部分的石化燃料燃燒技術對環境的影響降至最低。一種選擇是捕碳封存(CCS)。
- 根據《聯合國氣候變遷綱要公約》,加拿大同意在 2030 年將排放在 2005 年的基礎上減少 30%,即每年減少約 2 億噸二氧化碳。加拿大的四個主要 CCS計劃(兩個運作,兩個正在開發中)的總合高達 640 萬噸/年,相當於實現 2030 年目標所需減排量的 3%。
捕碳封存產業概況
捕碳封存市場本質上是一體化的。市場上主要企業(不分先後順序)包括西方石油公司、埃克森美孚公司、達科他氣化公司、殼牌公司和液化空氣集團。
其他福利:
- Excel 格式的市場預測 (ME) 表
- 3 個月的分析師支持
目錄
第 1 章 簡介
- 調查前提條件
- 研究範圍
第2章調查方法
第3章執行摘要
第4章 市場動態
- 市場促進因素
- 提高採收率(EOR) 對二氧化碳注入技術的需求不斷成長
- 政府對溫室氣體排放制定嚴格的標準
- 市場限制
- 引入CCS技術成本龐大
- 增加對頁岩層的投資
- 產業價值鏈分析
- 波特五力分析
- 供應商的議價能力
- 消費者議價能力
- 新進入者的威脅
- 替代品的威脅
- 競爭程度
第5章 市場區隔
- 依技術分類
- 燃燒前捕獲
- 富氧燃料回收
- 燃燒後回收
- 按最終用戶產業
- 石油和天然氣
- 煤炭和生質能發電廠
- 鋼
- 化學
- 水泥
- 按地區
- 亞太地區
- 中國
- 印度
- 日本
- 澳洲
- 其他亞太地區
- 北美洲
- 美國
- 加拿大
- 墨西哥
- 歐洲
- 德國
- 英國
- 法國
- 挪威
- 荷蘭
- 其他歐洲國家
- 世界其他地區
- 亞太地區
第6章 競爭格局
- 合併、收購、合資、合作和協議
- 市場排名分析
- 主要企業策略
- 公司簡介
- Air Liquide
- Aker Solutions
- Baker Hughes Company
- Dakota Gasification Company
- Exxon Mobil Corporation
- Fluor Corporation
- General Electric
- Halliburton
- Honeywell International Inc.
- Japan CCS Co. Ltd
- JX Nippon Oil & Gas Exploration Corporation
- Linde PLC
- Mitsubishi Heavy Industries Ltd
- Occidental Petroleum Corporation
- Shell PLC
- Siemens Energy
- SLB
第7章 市場機會與未來趨勢
- 生質能源捕碳封存(BECCS)日益受到關注
簡介目錄
Product Code: 66575
The Carbon Capture And Storage Market size is estimated at USD 2.76 billion in 2025, and is expected to reach USD 5.37 billion by 2030, at a CAGR of 14.21% during the forecast period (2025-2030).
Key Highlights
- The major factors driving the carbon capture and storage market are the emerging demand for CO2 injection techniques for enhanced oil recovery (EOR) and strict government norms toward GHG emissions.
- On the flip side, huge CCS technology implementation costs and increases in shale investments are expected to hinder the market's growth.
- Augmenting prominence for bioenergy carbon capture and storage (BECCS) is likely to be an opportunity in the future.
- North America is likely to dominate the market, and it is expected to remain in a dominant position over the forecast period, owing to the increasing implementation of technology, mainly in the United States and Canada.
Carbon Capture And Storage Market Trends
Oil and Gas Segment to Dominate the Market
- Carbon dioxide stored in deep, onshore, or offshore geological formations uses CCS technologies for enhanced oil recovery that have been developed in the oil and gas industry.
- Carbon dioxide is extensively used in the oil industry for enhanced oil recovery (EOR) from mature oilfields. When carbon dioxide is inserted into an oilfield, it can mix with the crude oil, triggering it to swell and drop its viscosity, helping to maintain or raise the pressure in the reservoir. The combination of these processes permits more crude oil to flow to the production wells.
- In other circumstances, the carbon dioxide is not soluble in the oil. Here, the injection of carbon dioxide raises the pressure in the reservoir, helping to sweep the oil toward the production well.
- For more than three decades in Texas (United States), carbon dioxide has been used in enhanced oil recovery projects. EOR constitutes over 20% of total oil production, and some fields achieve recoveries of nearly 70%.
- Moreover, as part of sustainable development, the oil and gas industry is moving toward carbon capturing and storage technologies.
- According to the International Energy Agency (IEA), global energy-related CO2 emissions from oil and gas grew by 2.5% or 268 million tons (Mt) in 2022, reaching over 11.2 gigatons (Gt).
- Methane from energy combustion, leaks, and venting represented another 10%, mostly from onshore oil and gas operations and steam coal production. Methane emissions rose to nearly 135 Mt CH4 or around 4 Gt CO2-eq in 2022 despite high natural gas prices that increased the cost-effectiveness of methane abatement technologies.
- Therefore, public sector oil and gas companies in India are actively embracing emission-reduction strategies such as Carbon Capture, Utilization, and Storage (CCUS) as India targets net zero by 2070.
North America is Likely to Dominate the Market
- North America dominates the global carbon capture and storage market. The growing demand for clean technology, accompanied by the growing use of CO2 in EOR practices, is likely to drive the CCS market in countries like the United States and Canada.
- Chemical production, hydrogen production, fertilizer production, natural gas processing, and power generation are among the industries in the United States where CO2 is captured and injected. These facilities capture and inject CO2 to store it underground in geologic formations or to use it to boost oil production from aging oil fields, a process known as enhanced oil recovery (EOR).
- According to the Congressional Budget Office of the federal government of the United States, as of 2023, the country has about 15 operating CCS facilities, with the majority of these located at plants that process natural gas or produce ethanol for fuel or ammonia for fertilizer.
- These 15 facilities can capture about 22 million metric tons of CO2 per year, which is about 0.4% of the total annual CO2 emissions in the United States. Furthermore, the country has about 121 under-construction or being-developed CCS facilities with a combined capacity of 134 million tons of CO2 per year.
- According to IEA, in 2023, out of the operational 22 million metric tons of CO2 per year capacity of CCS, natural gas processing/LNG accounted for the largest share of about 60% of the total capacity and was valued at 13.1 million metric tons of CO2 per year, followed by fuel transformation with a share of about 18% and capacity of 3.9 million metric tons of CO2 per year.
- Under the Infrastructure Investments and Jobs Act (IIJA), the US government allocated USD 12.1 billion for carbon management technologies, of which USD 2.54 billion is appropriated for carbon capture and storage (CCS) demonstration projects from 2022 to 2025.
- As Canada has a rich supply of coal, oil reserves, and natural gas, CanmetENERGY, Canada's leading research and technology organization in the field of clean energy, is finding ways to minimize the environmental impact of fossil fuel combustion technologies, which currently comprise a substantial portion of the Canadian energy supply. One of the options is carbon capture and storage (CCS).
- Canada has agreed to reduce emissions by 30% below 2005 levels by 2030, or approximately 200 million tonnes of carbon dioxide per year, under the UN Framework Convention on Climate Change. The combined capacity of the four major CCS projects in Canada (two operational and two in development) will be up to 6.4 Mtpa, representing 3% of the reduction needed to meet the 2030 target.
Carbon Capture And Storage Industry Overview
The carbon capture and storage market is consolidated in nature. The major players in the market (not in a particular order) include Occidental Petroleum Corporation, Exxon Mobil Corporation, Dakota Gasification Company, Shell PLC, and Air Liquide, among others.
Additional Benefits:
- The market estimate (ME) sheet in Excel format
- 3 months of analyst support
TABLE OF CONTENTS
1 INTRODUCTION
- 1.1 Study Assumptions
- 1.2 Scope of the Study
2 RESEARCH METHODOLOGY
3 EXECUTIVE SUMMARY
4 MARKET DYNAMICS
- 4.1 Market Drivers
- 4.1.1 Emerging Demand for CO2 Injection Technique for Enhanced Oil Recovery (EOR)
- 4.1.2 Strict Government Norms Toward GHG Emissions
- 4.2 Market Restraints
- 4.2.1 Huge CCS Technology Implementation Costs
- 4.2.2 Growth in Shale Investments
- 4.3 Industry Value Chain Analysis
- 4.4 Porter's Five Forces Analysis
- 4.4.1 Bargaining Power of Suppliers
- 4.4.2 Bargaining Power of Consumers
- 4.4.3 Threat of New Entrants
- 4.4.4 Threat of Substitute Products and Services
- 4.4.5 Degree of Competition
5 MARKET SEGMENTATION (Market Size in Value)
- 5.1 By Technology
- 5.1.1 Pre-combustion Capture
- 5.1.2 Oxy-fuel Combustion Capture
- 5.1.3 Post-combustion Capture
- 5.2 By End-user Industry
- 5.2.1 Oil and Gas
- 5.2.2 Coal and Biomass Power Plant
- 5.2.3 Iron and Steel
- 5.2.4 Chemical
- 5.2.5 Cement
- 5.3 By Geography
- 5.3.1 Asia-Pacific
- 5.3.1.1 China
- 5.3.1.2 India
- 5.3.1.3 Japan
- 5.3.1.4 Australia
- 5.3.1.5 Rest of Asia-Pacific
- 5.3.2 North America
- 5.3.2.1 United States
- 5.3.2.2 Canada
- 5.3.2.3 Mexico
- 5.3.3 Europe
- 5.3.3.1 Germany
- 5.3.3.2 United Kingdom
- 5.3.3.3 France
- 5.3.3.4 Norway
- 5.3.3.5 Netherlands
- 5.3.3.6 Rest of Europe
- 5.3.4 Rest of the World
- 5.3.1 Asia-Pacific
6 COMPETITIVE LANDSCAPE
- 6.1 Mergers, Acquisitions, Joint Ventures, Collaborations, and Agreements
- 6.2 Market Ranking Analysis
- 6.3 Strategies Adopted by Leading Players
- 6.4 Company Profiles
- 6.4.1 Air Liquide
- 6.4.2 Aker Solutions
- 6.4.3 Baker Hughes Company
- 6.4.4 Dakota Gasification Company
- 6.4.5 Exxon Mobil Corporation
- 6.4.6 Fluor Corporation
- 6.4.7 General Electric
- 6.4.8 Halliburton
- 6.4.9 Honeywell International Inc.
- 6.4.10 Japan CCS Co. Ltd
- 6.4.11 JX Nippon Oil & Gas Exploration Corporation
- 6.4.12 Linde PLC
- 6.4.13 Mitsubishi Heavy Industries Ltd
- 6.4.14 Occidental Petroleum Corporation
- 6.4.15 Shell PLC
- 6.4.16 Siemens Energy
- 6.4.17 SLB
7 MARKET OPPORTUNITIES AND FUTURE TRENDS
- 7.1 Augmenting Prominence for Bioenergy Carbon Capture and Storage (BECCS)
02-2729-4219
+886-2-2729-4219
 二氧化碳捕集、利用和儲存市場 - 全球和區域分析:按應用、產品和區域 - 分析和預測(2025-2034)
 2025年捕碳封存技術全球市場報告
 點源碳捕獲設備 (PSCD) 市場:2031 年預測
 全球發電碳捕獲與儲存市場研究報告 - 產業分析、規模、佔有率、成長、趨勢與預測 2025 年至 2033 年
 2025 年捕碳封存全球市場報告
 按技術、應用、服務和地區分類的捕碳封存市場
 碳捕獲、利用和儲存 (CCUS) 技術
 碳捕獲與儲存市場機會、成長動力、產業趨勢分析及 2025-2034 年預測
 碳回收·利用(CCU)的全球市場:2031年為止的預測
 碳回收·利用·儲存(CCUS)的全球市場(2025年~2045年)
▼