


 |
市場調查報告書
商品編碼
1690711
分散式能源來源管理系統:市場佔有率分析、產業趨勢與統計、成長預測(2025-2030 年)Distributed Energy Resource Management System - Market Share Analysis, Industry Trends & Statistics, Growth Forecasts (2025 - 2030) |
||||||
價格
※ 本網頁內容可能與最新版本有所差異。詳細情況請與我們聯繫。
簡介目錄
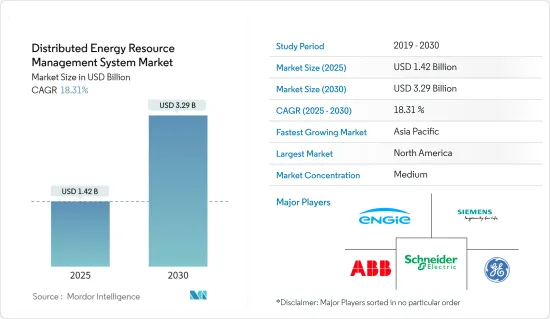
分散式能源來源管理系統市場規模預計在 2025 年為 14.2 億美元,預計到 2030 年將達到 32.9 億美元,預測期內(2025-2030 年)的複合年成長率為 18.31%。
主要亮點
- 從中期來看,預計預測期內分散式能源來源管理系統 (DERGMS) 市場最重要的驅動力包括向基於可再生能源的分散式發電的轉變以及智慧電網投資的增加等因素。
- 另一方面,安裝 DERMS 需要較高的初始成本。這可能會對預測期內分散式能源來源管理系統 (DERMS) 市場構成威脅。
- 然而,亞太和非洲電氣化程度較低地區採用分散式發電以及微電網即服務的發展預計將為市場帶來機會。
- 由於政府對分散式發電技術的支持政策以及可再生能源在能源結構中的佔有率不斷增加,預計北美將在預測期內成為最大的市場。
分散式能源來源管理系統市場趨勢
太陽能光伏 (PV) 領域佔據市場主導地位
- 太陽能光電發電可以安裝在屋頂或地面,是世界上最大的分散式能源之一。由於裝置容量不斷增加且平均安裝成本(美元/千瓦)下降,該領域預計將引領分散式能源來源管理系統市場。分散式能源來源管理系統即時限制光伏(PV)輸出,以防止逆向電流和局部高電壓。
- 分散式發電具有經濟可行性,所需資本比同類傳統設施少得多。對太陽能發電場和分散式太陽能發電的稅收激勵措施正在推動全球分散式太陽能發電。
- 根據國際可再生能源機構預測,2022年全球太陽能發電裝置容量將達到1,046.61吉瓦,與前一年同期比較成長率達22.4%,加上政府扶持太陽能發電的目標,太陽能發電容量預計將持續增加,有可能帶動分散式能源來源管理系統市場。
- 預計未來幾年太陽能光電(PV)技術將成為再生能源中年新增裝置容量最大的技術,大幅超過風能和水力發電。國際能源總署預計,2022年太陽能發電量將成長26%,達到1,300TWh,是所有可再生技術中發電量絕對增幅最大的。隨著太陽能裝置大量湧入市場,過去六年來太陽能成本也大幅下降。太陽能板的價格也大幅下降,導致全球太陽能發電系統的安裝量上升。
- 在住宅和商業及工業 (C&I) 領域,太陽能發電通常透過最終用戶安裝的屋頂光伏 (PV) 來實現。發電的光電系統安裝在使用能源的住宅、商業建築和工業廠房的屋頂上。個人生產的多餘能源也可以出售給電力公司。
- 世界各國政府已推出多項措施和政策,以增加太陽能在國家能源結構中的佔有率。預計這些政策將對研究市場產生正面影響。例如在印度,印度新可再生能源部於2019年宣布了併網屋頂太陽能發電計畫(第二階段),該計畫旨在透過在住宅屋頂安裝太陽能發電面板來發電。印度政府先前已設定了2022年安裝40,000兆瓦屋頂太陽能(RTS)的目標。
- 不過,2023年1月,印度屋頂太陽能(RTS)計畫獲得四年延期,旨在實現2026年3月增加40吉瓦RTS容量的目標。該計劃預計將大大幫助印度實現其太陽能總容量目標。
- 因此,預計對太陽能的投資增加、政府法規的變化以及即將實施的計劃將推動太陽能領域在預測期內成為最大的市場。
北美佔據市場主導地位
- 預計在預測期內,北美 DERMS 市場將成為最大的市場,這主要得益於美國和加拿大,這兩個國家都擁有超過一百萬個分散式發電裝置。
- 儘管發電量充足且輸配電網路可用,但該地區的一些地區仍因洪水和風暴等自然災害而停電。使用 DERMS 等遠端電力系統來協調分散式能源系統可能會緩解這個問題。
- 美國已經制定了實現可再生能源目標的藍圖。聯邦政府和許多州政府都實施了鼓勵採用太陽能的政策和計畫。這些激勵措施包括稅額扣抵、補貼、回扣和可再生能源組合標準,要求公用事業公司從太陽能等再生能源來源中購買一定比例的能源。
- 此外,隨著太陽能發電工程的興起,國家對分散式能源來源管理系統的需求也日益增加。
- 根據美國能源資訊署 (EIA) 的數據,到 2022 年,美國的小型太陽能發電容量將從 2014 年該機構開始發布估計值的 7.3 吉瓦成長到 39.5 吉瓦。小型太陽能發電約占美國所有太陽能發電容量的三分之一。
- 根據國際能源總署 (IEA) 的數據,2021 年至 2022 年,該國電動車銷量近年來大幅成長。插電式混合動力車和純電動車的累積銷量增加了 27,000 多輛,顯示該國電動車的普及率不斷提高,而過去十年的銷量成長了約 60 倍。
- 同樣,根據 Electric Autonomy 彙編的資料,加拿大可公開使用的電動車 (EV) 充電基礎設施正在穩步增加。截至 2023 年 3 月 1 日,加拿大自然資源部 (NRCan) 的統計數據顯示,加拿大電動車用戶可在全國 8,732 個充電站使用至少 20,478 個充電連接器。這意味著自 2022 年初以來,這一數字大幅增加了 30%。
- 因此,由於這些因素,北美很可能在預測期內成為分散式能源來源管理系統最大的市場。
分散式能源來源管理系統 (DERMS) 產業概況
分散式能源來源管理系統市場較為分散。市場的主要企業(不分先後順序)包括通用電氣公司、西門子股份公司、ABB 有限公司、施耐德電氣 SE 和 Engie SA。
其他福利:
- Excel 格式的市場預測 (ME) 表
- 3 個月的分析師支持
目錄
第 1 章 簡介
- 研究範圍
- 市場定義
- 調查前提
第 2 章執行摘要
第3章調查方法
第4章 市場概況
- 介紹
- 2029 年市場規模與需求預測
- 最新趨勢和發展
- 政府法規和政策
- 市場動態
- 驅動程式
- 擴大轉向基於可再生能源的分散式發電
- 增加對智慧電網的投資
- 限制因素
- 集中式電網擴建與升級
- 驅動程式
- 供應鏈分析
- 波特五力分析
- 供應商的議價能力
- 消費者議價能力
- 新進入者的威脅
- 替代品的威脅
- 競爭對手之間的競爭強度
第5章 市場區隔
- 依技術分類
- 光伏 (PV)
- 電動車
- 微型電網
- 其他技術
- 按最終用戶
- 產業
- 住宅
- 商業的
- 按地區
- 北美洲
- 美國
- 加拿大
- 北美其他地區
- 歐洲
- 德國
- 義大利
- 法國
- 英國
- 其他歐洲國家
- 亞太地區
- 印度
- 中國
- 日本
- 韓國
- 其他亞太地區
- 南美洲
- 巴西
- 阿根廷
- 南美洲其他地區
- 中東和非洲
- 阿拉伯聯合大公國
- 沙烏地阿拉伯
- 沙烏地阿拉伯
- 其他中東和非洲地區
- 北美洲
第6章 競爭格局
- 併購、合資、合作、協議
- 主要企業策略
- 公司簡介
- General Electric Company
- Siemens AG
- ABB Ltd
- Schneider Electric SE
- Oracle Corporation
- Uplight Inc.
- Doosan Corporation
- Open Access Technology International Inc.
- Mitsubishi Electric Corporation
- Emerson Electric Co.
- Engie SA
第7章 市場機會與未來趨勢
- Micro Grid As A Service
簡介目錄
Product Code: 71080
The Distributed Energy Resource Management System Market size is estimated at USD 1.42 billion in 2025, and is expected to reach USD 3.29 billion by 2030, at a CAGR of 18.31% during the forecast period (2025-2030).
Key Highlights
- Over the medium term, factors such as an increasing shift toward renewables-based distributed power generation and rising investments in smart grid are expected to be some of the most significant drivers for the distributed energy resource management system (DERMS) market during the forecast period.
- On the other hand, there is a high initial cost of setting up DERMS. This may pose a threat to the distributed energy resource management system (DERMS) market during the forecast period.
- Nevertheless, the adoption of distributed power generation in the low-electrified areas of Asia-Pacific and Africa and the development of microgrids as a service are expected to act as opportunities in the market.
- North America is expected to be the largest market during the forecast period, owing to supportive government policies for distributed power generation technology and the increasing share of renewables in the energy mix.
Distributed Energy Resource Management System Market Trends
Solar Photovoltaic (PV) Segment to Dominate the Market
- Solar PV can be located on rooftops or ground-mounted and is one of the largest distributed power sources globally. This segment is expected to drive the distributed energy resources management system with increased installed capacity supported by decreasing average installed cost (USD/kilowatt). Distributed energy resource management systems limit real-time photovoltaic (PV) output to prevent reverse flows and high local voltages.
- Distributed generation is economically viable, requiring significantly less capital than an equivalent traditional facility. Tax incentives for both solar stations and distributed solar generation are driving distributed solar PV globally.
- According to the International Renewable Energy Agency, the global solar PV installed capacity accounted for 1,046.61 GW in 2022. With an annual growth rate of 22.4% compared to the previous year and supportive solar PV targets of the government, solar PV capacity is expected to increase in the future, which, in turn, may drive the distributed energy resource management system market.
- Solar photovoltaic (PV) technology is expected to account for renewables' most considerable annual capacity additions in the coming years, well above wind and hydro as well. According to IEA, solar PV generation increased by 26% in 2022, reaching 1300 TWh, representing the largest absolute generation growth of all renewable technologies. The cost of solar photovoltaics has also reduced dramatically in the past six years as the market was flooded with equipment. The cost of solar panels also dropped exponentially, leading to increased solar PV system installations globally.
- In the residential and commercial & industrial (C&I) sector, solar power is often generated by rooftop solar photovoltaics (PV) deployed by end users. Solar PV systems for power generation are installed on rooftops of houses and commercial buildings or industrial plants that use the energy. Excess energy produced by individual owners is sometimes sold to power companies.
- Several governments around the world have introduced several initiatives and policies to increase the contribution of solar energy to the country's energy mix. Such policies are expected to have a positive impact on the market studied. For instance, in India, the Ministry of New and Renewable Energy announced the Grid-connected Rooftop Solar Scheme (Phase II) in 2019. The scheme aims to produce solar power by installing solar PV panels on the roofs of houses. The Government of India previously set the goal of installing 40,000 MW of Rooftop Solar (RTS) Power by 2022.
- However, in January 2023, India's Rooftop Solar (RTS) program received a four-year extension and aimed to accomplish its target of 40 GW rooftop solar (RTS) capacity addition by March 2026. This program is expected to achieve India's total solar energy capacity target significantly.
- Therefore, with increased investment in solar PV and changing government regulations, coupled with upcoming projects, the solar PV segment is expected to be the largest market during the forecast period.
North America to Dominate the Market
- The North American DERMS market is further expected to be the largest market during the forecast period, supported by the United States and Canada, which have more than a million distributed generation units.
- Despite enough power generation and accessibility of transmission and distribution networks, power outages are caused in some areas of the region due to natural disasters, such as flooding and storms. The use of remote power systems, such as DERMS, to regulate distributed energy systems is likely to mitigate the issue.
- The United States has set a road map to achieve renewable energy targets. The federal government and many state governments have implemented policies and programs to promote the adoption of solar energy. These incentives include tax credits, grants, rebates, and renewable portfolio standards that need utilities to receive a certain percentage of their energy from renewable sources like solar.
- Moreover, as the number of solar projects increases, the companies increase demand for distributed energy resources management systems in the country.
- According to the US Energy Information Administration (EIA), the country's small-scale solar capacity grew from 7.3 GW in 2014, when they began publishing these estimates, to 39.5 GW in 2022. Small-scale solar accounts for approximately one-third of all solar capacity in the United States.
- According to the International Energy Agency (IEA), electric vehicle sales in the country have increased significantly in recent years between 2021 and 2022; the cumulative sales of PHEV and BEV increased by more than 27,000 units, whereas in the past decade, sales increased by almost 60 folds signifying the increasing adoption of electric vehicles in the country.
- Similarly, Canada's publicly available electric vehicle (EV) charging infrastructure is on a steady rise, as indicated by data compiled by Electric Autonomy. As of March 1, 2023, Natural Resources Canada (NRCan) statistics revealed that Canadian EV users can avail themselves of at least 20,478 charging connectors distributed across 8,732 charging station sites nationwide. This represents a substantial percentage growth rate of 30% since the beginning of 2022.
- Therefore, based on these factors, North America is likely to be the largest market for distributed energy resource management systems during the forecast period.
Distributed Energy Resource Management System (DERMS) Industry Overview
The distributed energy resource management system market is semi-fragmented. Some of the major players in the market (in no particular order) include General Electric Company, Siemens AG, ABB Ltd, Schneider Electric SE, and Engie SA.
Additional Benefits:
- The market estimate (ME) sheet in Excel format
- 3 months of analyst support
TABLE OF CONTENTS
1 INTRODUCTION
- 1.1 Scope of the Study
- 1.2 Market Definition
- 1.3 Study Assumptions
2 EXECUTIVE SUMMARY
3 RESEARCH METHODOLOGY
4 MARKET OVERVIEW
- 4.1 Introduction
- 4.2 Market Size and Demand Forecast, till 2029
- 4.3 Recent Trends and Developments
- 4.4 Government Policies and Regulations
- 4.5 Market Dynamics
- 4.5.1 Drivers
- 4.5.1.1 Increasing Shift Toward Renewables-based Distributed Power Generation
- 4.5.1.2 Rising Investments in Smart Grid
- 4.5.2 Restraints
- 4.5.2.1 Expansion and Upgradation of Centralized Grid
- 4.5.1 Drivers
- 4.6 Supply Chain Analysis
- 4.7 Porter's Five Forces Analysis
- 4.7.1 Bargaining Power of Suppliers
- 4.7.2 Bargaining Power of Consumers
- 4.7.3 Threat of New Entrants
- 4.7.4 Threat of Substitute Products and Services
- 4.7.5 Intensity of Competitive Rivalry
5 MARKET SEGMENTATION
- 5.1 By Technology
- 5.1.1 Solar Photovoltaic (PV)
- 5.1.2 Electric Vehicles
- 5.1.3 Microgrids
- 5.1.4 Other Technologies
- 5.2 By End User
- 5.2.1 Industrial
- 5.2.2 Residential
- 5.2.3 Commercial
- 5.3 By Geography
- 5.3.1 North America
- 5.3.1.1 United States
- 5.3.1.2 Canada
- 5.3.1.3 Rest of North America
- 5.3.2 Europe
- 5.3.2.1 Germany
- 5.3.2.2 Italy
- 5.3.2.3 France
- 5.3.2.4 United Kingdom
- 5.3.2.5 Rest of Europe
- 5.3.3 Asia-Pacific
- 5.3.3.1 India
- 5.3.3.2 China
- 5.3.3.3 Japan
- 5.3.3.4 South Korea
- 5.3.3.5 Rest of Asia-Pacific
- 5.3.4 South America
- 5.3.4.1 Brazil
- 5.3.4.2 Argentina
- 5.3.4.3 Rest of South America
- 5.3.5 Middle East and Africa
- 5.3.5.1 United Arab Emirates
- 5.3.5.2 Saudi Arabia
- 5.3.5.3 Saudi Arabia
- 5.3.5.4 Rest of Middle East and Africa
- 5.3.1 North America
6 COMPETITIVE LANDSCAPE
- 6.1 Mergers and Acquisitions, Joint Ventures, Collaborations, and Agreements
- 6.2 Strategies Adopted by Leading Players
- 6.3 Company Profiles
- 6.3.1 General Electric Company
- 6.3.2 Siemens AG
- 6.3.3 ABB Ltd
- 6.3.4 Schneider Electric SE
- 6.3.5 Oracle Corporation
- 6.3.6 Uplight Inc.
- 6.3.7 Doosan Corporation
- 6.3.8 Open Access Technology International Inc.
- 6.3.9 Mitsubishi Electric Corporation
- 6.3.10 Emerson Electric Co.
- 6.3.11 Engie SA
7 MARKET OPPORTUNITIES AND FUTURE TRENDS
- 7.1 Micro Grid As A Service
02-2729-4219
+886-2-2729-4219
 分散式能源資源管理系統市場按組件、技術、連接、應用和部署模式分類 - 2025-2030 年全球預測
 分散式能源管理系統 (DERMS) 的全球市場:按產品、按應用、按最終用戶、按地區 - 預測至 2029 年
 分散式能源管理系統的全球市場(按組件、按應用、按最終用戶、按地區):趨勢分析、競爭格局、未來預測(2019-2030)
 分散式能源管理系統 (DERMS) 市場,按組件、按應用、最終用戶、按國家和地區分類 - 2024-2032 年行業分析、市場規模、市場佔有率和預測
 併網戶用微型逆變器市場機會、成長動力、產業趨勢分析及2024年至2032年預測
 分散式能源資源管理系統 (DERMS) 市場規模(按地區、範圍和預測)
 2024 年分散式能源管理系統 (DERMS) 全球市場報告
 分散式能源管理系統市場規模、佔有率和成長分析:按組件、最終用途、應用、地區 - 產業預測,2024-2031 年到 2030 年分散式能源管理系統市場預測 - 按組件、應用、最終用戶和地理位置進行的全球分析
 Guidehouse Insights Leaderboard Report-DERMS提供者:評估 10家Grid DERMS供應商和15家Grid Edge DERMS平台供應商策略.執行情況
▼