


|
市場調查報告書
商品編碼
1619729
網路規模網路營運商市場回顧(2024 年第三季):資本支出年增 58%,推動 12 個月總額超過 2,500 億美元前景強勁,但生成式人工智慧面臨現實需求Webscale Network Operators - 3Q24 Market Review: Capex Jumps 58% YoY in 3Q24, Pushing 12 mo. Total Over $250 Billion, Outlook Remains Strong, but Reality Check is Needed for GenAI |
|||||||
2024 年第三季的資本支出將年增 58%,12 個月累計總額將超過 2,500 億美元
對21 家Web 規模網路營運商(WNO) 的調查發現,在過去12 個月內(2023 年第4 季- 2024 年第3 季),Web 規模網路營運商預計將創造2 萬億美元的收入,收入為5,300 億美元,成長9.1%年比來看,研發費用3,070億美元,成長6.5%,資本支出2,540億美元,成長32.5%。截至2024年9月,帳面現金及短期投資為6,310億美元(年減11.3%),總負債為5,380億美元(年減4.1%)。此外,截至 2024 年 9 月,Webscaler 的淨 PP&E 帳面價值為 8,540 億美元,比去年同期成長 25.9%。截至第三季末,Webscaler 擁有約 422.6 萬名員工,較 2023 年 9 月的 413 萬名成長 2.3%。
本報告回顧了自 2011 年以來 Webscale 網路營運商 (WNO) 市場的成長和發展。
視覺
報告重點:
- 營收:2024 年第三季單季營收為 6,386 億美元,年增 10.6%。這使得年收入達到 25,270 億美元。推動營收成長的主要力量是四大巨頭: AAlphabet、Amazon、Meta (FB)、Microsoft。這些公司已連續五個季度實現兩位數的營收成長,遙遙領先同業。從截至2024 年第三季的年化期間來看,Meta 將成為成長最快的公司,從2022 年第四季到2023 年第三季成長23.1%,其次是印度(成長16.4%)和Alphabet(成長14.4%),以及Amazon(成長11.9%)。 2024年第三季成長的最大貢獻者將是亞馬遜,預計其單季營收將較2023年第三季增加158億美元,2024年第三季年增11.0%,達到1,589億美元。日本IT服務和雲端運算供應商Fujitsu的營收年減4.92億美元,至58億美元,降幅7.8%。
- 資本支出:在 2023 年下降 5% 之後,網路規模資本支出在 2024 年以令人驚訝的快速和不可持續的速度增長。 2012年第三季資本支出為756億美元,年化總額達2,539億美元,比去年同期成長32.5%,創歷史新高。投資者對生成式人工智慧的興趣正在迅速增長,並推動了資料中心的 GPU 投資。
- 獲利能力:Webscale 的自由現金流利潤率預計在 2024 年第三季平均年化為 17.6%,略低於去年同期(17.9%),但預計將成長2022 年第三季的複合年增長率為1.4%。 2023年4季至2024年3季的平均淨利率為18.9%,略高於2023年3季的16.9%。這兩項獲利指標與疫情之前的水平大致相同。
- 員工人數:到 2024 年 9 月,網路規模市場的員工人數將達到 423 萬,略高於 2023 年 9 月的 413 萬。考慮到一些網路擴展器的規模以及員工人數的變化速度(尤其是對於電子商務專家而言),這種差異很小。
- 區域趨勢:亞太地區已經連續幾季拖累市場,而這種趨勢一直延續到第三季。美洲和歐洲、中東和非洲地區的 Webscale 營收在過去幾季一直以兩位數的低速成長,但亞太地區表現不佳,預計 2024 年第三季營收年增 5%。幾季的成長率一直保持在個位數的低點。
調查主題
WNO 前 8 名
|
|
目錄
- 1. 報告重點
- 2. 展望 3. 分析
- 4.關鍵統計數據
- 5.公司詳細信息
- 6.WNO 前 8 大公司
- 7. 企業標竿管理
- 8. 依地區細分
- 9.原始數據 10. 匯率
- 11.關於本書
Capex jumps 58% YoY in 3Q24, pushing 12 mo. total over $250 billion; outlook remains strong, but reality check is needed for GenAI
This report reviews the growth and development of the webscale network operator (WNO, or webscale) market since 2011. It covers 21 companies. In the most recent 12 months (4Q23-3Q24), webscalers represented $2.53 trillion (T) in revenues (+9.1% YoY), $307 billion (B) in R&D spending (+6.5% YoY), and $254B in capex (+32.5% YoY). They had $631B of cash and short-term investments (-11.3% YoY) on the books as of September 2024, and $538B in total debt (-4.1% YoY). The value of webscalers' net plant, property & equipment (net PP&E) on the books as of September 2024 was $854B, up 25.9% YoY. Webscalers employed approximately 4.226 million (M) people at the end of 3Q24, up 2.3% from the Sept. 2023 total of 4.130M.
VISUALS
Below are highlights from the report:
- Revenues: Single quarter revenues in 3Q24 were $638.6 billion (B), up 10.6% YoY. That pushed annualized revenues to $2.527 trillion. Topline growth has been driven by the big 4: Alphabet, Amazon, Meta (FB) and Microsoft. For five straight quarters, all of these companies have recorded double digit revenue growth, well above the rest of the pack. For the 3Q24 annualized period, the fastest growth came from Meta, up 23.1% versus 4Q22-3Q23, followed by Microsoft (+16.4%), Alphabet (14.4%), and Amazon (11.9%). The biggest dollar impact on growth in 3Q24 came from Amazon, as its single quarter revenues grew $15.8 billion from 3Q23 to end 3Q24 at $158.9B, up 11.0% YoY. The only curb on growth in 3Q24 was Japanese IT services & cloud vendor Fujitsu, which recorded 3Q24 revenues of $5.8B, down $492 million (M) YoY (-7.8%).
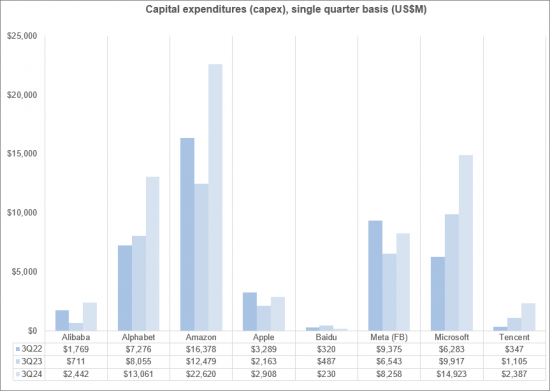
- Capex: After declining 5% in 2023, webscale capex has grown at incredibly fast, unsustainable rates in 2024: up by 25%, 51%, and 58% YoY in the first three quarters of the year. 3Q24 capex of $75.6B pushed the annualized total to $253.9B, up 32.5% YoY, and another all-time high. Investor interest in generative AI has spread rapidly, driving GPU spend in the data center. The current investment spike would seem to be inspired by a mix of hype and fear of missing out, as GenAI brings with it a plethora of legal & regulatory risks and relative lack of proven business models. Most recent webscale capex is focused on outfitting existing data centers: from 46% of annualized capex in 3Q22, Network/IT and software capex was 53% of total capex for the latest annualized period. The biggest capex outlays in 3Q24 came from Amazon ($22.6B), Microsoft ($14.9B), Alphabet ($13.1B), and Meta (FB) ($8.3B). These four account for about 80% of single quarter spending. They are the reason behind the unsustainable surge in the price of NVIDIA stock.
- Profitability: Webscale free cash flow margins averaged out to 17.6% for the 3Q24 annualized period, a bit lower than a year prior (17.9%) but higher than the 14.1% booked in 3Q22. Average net profit margin for 4Q23-3Q24 was 18.9%, a bit higher than 16.9% in 3Q23. Both profitability metrics are around the same level as in the year before COVID. Meta, Tencent and Microsoft are regularly near or at the top of the heap on both metrics, and this was again the case in 3Q24. The ecommerce specialists Amazon and Alibaba are the laggards, as usual. The biggest drops in free cash flow margins came at the companies with surging capex: Alphabet and Amazon. The biggest decline in net profitability was Apple, which was fined 13 billion Euros in September 2024 for taking illegal profits from a tax scheme in Ireland over two decades. This tax scheme has been widely known about and criticized for many years. While 13 billion sounds like a lot, it hardly impacted Apple's market trajectory at all. Apple's stock price is around 14% higher now than on 1 July 2024. Consumers and taxpayers are losing out, while big tech uses political friends to secure victories. This will get worse with new political leadership in the US.
- Employees: Headcount in the webscale market totaled to 4.23 million in September 2024, slightly up from 4.13 million in September 2023. This difference is negligible, considering the size of some of the webscalers and how quickly the ecommerce specialists in particular can change workforce levels. Amazon's workforce grew by 51,000 between September 2023 and 2024, for instance. Total webscale headcount has been approximately 4.1 to 4.2 million or so steadily since late 2021. Some of the biggest webscalers are investing heavily in AI and GenAI, with one clear goal being to improve their internal cost efficiencies. This inevitably will mean fewer employees. Even within the ecommerce space, there is a rising use of robots and autonomous vehicles in the logistics chain. Per our latest forecast, we expect webscale employment to rise slightly in 2025 but decline thereafter due to greater use of robotics, automation and AI.
- Regional trends: The Asia-Pacific region has been a drag on the market for several quarters, and that continued in 3Q24. Webscale revenues in the Americas, Europe, and MEA have been growing in the low double digit range for a few quarters, but AP has been weak: 3Q24 revenue growth was 5% YoY, in line with the last few quarters of low single digit percentage growth. Weak Asian currencies and a very competitive 'big tech' market in China account for the gap. Another factor is TikTok. This company, owned by ByteDance, has grown at explosive rates for the last few years, but remains private. We have no reasonable way to include TikTok figures in our database. The ByteDance surge also ate into the 2022-23 growth of some western webscalers, notably Meta (FB), but that effect has ebbed.
Coverage
Top 8 WNOs
|
|
Other WNOs
|
|
Table of Contents
- 1. Report highlights
- 2. Outlook
- 3. Analysis
- 4. Key Stats
- 5. Company Drilldown
- 6. Top 8 WNOs
- 7. Company Benchmarking
- 8. Regional Breakouts
- 9. Raw Data
- 10. Exchange Rates
- 11. About
List of Figures
- 1. Key Metrics: Growth rates, Annualized 3Q24/3Q23 vs. 2019-23
- 2. WNO Revenues: Single-quarter & annualized (US$M)
- 3. Top 8 WNOs: YoY revenue growth in 3Q24
- 4. Annualized profitability: WNOs
- 5. Free cash flow per employee, 3Q24 annualized (US$)
- 6. FCF Margins vs. Net Margins, 3Q24 annualized
- 7. Advertising revenues as % total (FY2023)
- 8. Annualized capex and R&D spending: WNOs (% revenues)
- 9. WNO capex by type, Annualized: 3Q15-3Q24 (US$M)
- 10. Network & IT capex as share of revenues, 3Q24 annualized
- 11. R&D expenses as % revenues, Top 8 WNOs (3Q24 annualized)
- 12. Acquisition spending vs. capex spending, annualized (US$M)
- 13. Net PP&E per employee (US$' 000) - 3Q24
- 14. Ranking the Webscale Network Operators: Revenues; R&D; Capex; Network & IT capex - 2023 & 3Q24 (US$B)
- 15. Annualized spending share for key webscalers since 2011 Capex: Network, IT and software
- 16. Share of webscale spending by company, 3Q24 and 3Q23 annualized (Capex: Network, IT and software)
- 17. Energy consumption vs. Net PP&E for key webscalers in 2023
- 18. USA: Webscale capex total ($M) and % of global market, 2011-23
- 19. Webscale vs. Telco Market: Annualized Capex (US$B)
- 20. Webscale vs. Telco Market: Annualized capital intensity
- 21. Revenues: annual, single-quarter, and annualized (US$M)
- 22. Profitability (Net Profit; Cash from operations; Free cash flow): annual, single-quarter, and annualized (US$M)
- 23. Spending (R&D; M&A; Capex; Network & IT capex; Lease): annual, single-quarter, and annualized (US$M)
- 24. Cash & Short-term Investments: annual and single-quarter (US$M)
- 25. Debt (Total debt; Net debt): annual and single-quarter (US$M)
- 26. Property, Plant & Equipment: annual and single-quarter (US$M)
- 27. Key Ratios: Net margin; R&D/revenues; Capex/revenues; Network & IT capex/revenues; Free cash flow/revenues; Lease costs/revenues - annual and annualized (%)
- 28. Total employees
- 29. Revenue per employee, annualized (US$K)
- 30. FCF per employee, annualized (US$K)
- 31. Net PP&E per employee, annualized (US$K)
- 32. Revenues & Spending (US$M)
- 33. Webscale Business Mix by Revenues (FY2023) - MTN Consulting estimates
- 34. Top 10 recent acquisitions & investments
- 35. Data center footprint
- 36. Revenues (US$M) & YoY revenue growth (%), single-quarter: by company
- 37. Revenues, annualized (US$M): by company
- 38. Annualized profitability margins: by company
- 39. Annualized capex and capital intensity: by company
- 40. Annualized capex and R&D spending as % of revenues: by company
- 41. Share of WNO network & IT capex, Annualized: by company
- 42. Total employees: by company
- 43. Annualized per-employee metrics (US$000s): by company
- 44. Net debt (debt minus cash & stock) (US$M): by company
- 45. Top 10 webscale employers in 3Q24: Global market
- 46. Headcount changes in 3Q24 (YoY %): Global market
- 47. Net PP&E: USA vs. RoW (by company)
- 48. Net PP&E: total in $M and % global webscale market (by company)
- 49. Energy consumption, MWh and % webscale total (by company)
- 50. Share of webscale energy consumption, net PP&E, and capex (by company)
- 51. Energy intensity relative to webscale average and select data center-focused CNNOs (by company)
- 52. Energy intensity in webscale sector, 2023: MWh consumed per $M in revenue
- 53. Capex/revenues (annualized): Company vs. Webscale average
- 54. Revenue per employee (US$000s) (annualized): Company vs. Webscale average
- 55. 2017 vs. 2023: company benchmark by KPI (Revenues, R&D, Net profit, Cash from operations, Capex, Free cash flow, Cash & short-term investments, Net PP&E, Total debt)
- 56. 2017 vs. 2023: company benchmark by key ratio (Capex/revenues; R&D/revenues; Net margin; FCF margin)
- 57. Top 8 WNO's share vs. Rest of the market: by KPI (Revenues, R&D, Net profit, Cash from operations, Capex, Free cash flow, Cash & short-term investments, Net PP&E, Total debt)
- 58. Top 8 WNOs benchmarking by Key ratio: Capex/revenues; R&D/revenues; Net margin; FCF margin)
- 59. Total WNO Market Revenues, by region: Latest CY; Latest Quarter; Annual trend (2011-23); Single quarter (3Q15-3Q24 )
- 60. WNO Market: Revenues, single-quarter (YoY % change)
- 61. Regional revenues by operator: Latest CY; Latest Quarter; Annual trend (2011-23); Single quarter (3Q15-3Q24)
- 62. Top 10 operators by region: Latest CY; Latest Quarter

