


 |
市場調查報告書
商品編碼
1688514
邁向更綠色的網路-營運商提升流量效率:2023 年營運商每 PB 的能耗將比 2022 年降低 15.4%,同時排放量和再生能源採用率仍將維持在較低水平Greener Networks - Telcos Power Up Traffic Efficiency: Telcos Consumed 15.4% Less Energy in 2023 per Petabyte of Traffic Carried than 2022, Emissions and Renewables Adoption Remain Dismal |
||||||
2023 年末,MTN Consulting 發布了第一份關於電信營運商網路中流量成長與能源消耗之間關係的評論。此次審查涵蓋了 16 家營運商的數據,重點關注 2020-22 年的數據。在此次更新版本中,目標電信業者數量擴大至30家,並增加了2019年、2023年兩年的數據。我們的分析目前涵蓋 2019-23 年的時間範圍。
視覺
本次分析涵蓋的 30 個營運商集團按收入計算約佔全球市場的 55%。到 2023 年,電信業者每 100 萬美元收入將平均承載 2.06PB 的流量,比 2019 年每 100 萬美元 1.00PB 的流量增加一倍以上。這是因為營運商不斷進行改進,旨在降低流量承載成本。能源是成本的很大一部分。那麼,網路在單位能耗方面的傳輸流量效率是否變得更高了?
從 2019 年到 2023 年,30 家電信業者的網路流量將以 19.7% 的複合年增長率成長,而其總能源消耗將以 2.8% 的複合年增長率增長。因此,電信業者的能源消耗將在 2023 年平均為 90.0 MWh/PB,低於 2019 年的 165.5 MWh/PB。這意味著每 PB 兆瓦時的複合年增長率為 14.1%。這意味著,營運商平均每年所需的能源比前一年減少 14.1% 即可承載相同的流量負荷。這些改進符合營運商及其供應商長期提高網路能源效率的目標。自 2019 年以來,MWh/PB 指標進步最大的是 BT、Entel、Rogers、Tele2 和 Veon。
目標範圍
刊載組織
|
|
目錄
- 摘要
- 提高通訊網路的能源效率:年度14%
- 資料集:概要
- 收益和流量的難題:依然持續的
- 每消費能源單位的流量
- 供應商擔挑著改善在持續的上中心性的作用
- 總論
- 附錄
In late 2023, MTN Consulting published an initial review of the relationship between traffic growth and energy consumption in telco networks. That review included data for 16 telcos, and focused on 2020-22 data. This updated analysis extends coverage to 30 telcos, and adds two years (2019 and 2023) of data. Our analysis now addresses the 2019-23 timeframe.
VISUALS
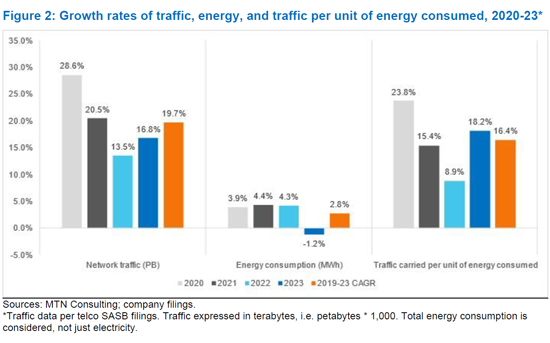
The group of 30 telcos included in this analysis represent about 55% of the global market, based on revenues. Our data verify the well-known revenue-traffic conundrum, where traffic rises faster than revenues: in 2023, the average telco carried 2.06 Petabytes of traffic per US$1M in revenue, over double the 1.00 Petabytes per $M carried in 2019. This is possible because telcos make constant improvements aimed at carrying traffic more cheaply. Energy is a big part of the cost story. So, are networks getting more efficient in their carriage of traffic per unit of energy consumed? In the 2019-23 timeframe, our group of 30 telcos increased network traffic at an average annual rate (CAGR) of 19.7%, while their total energy consumption grew at a CAGR of 2.8%. As a result, in 2023 the average telco consumed 90.0 MWh of energy per Petabyte of traffic, down from 165.5 MWh/PB in 2019. That works out to an annual average (CAGR) improvement in MWh per Petabyte of 14.1%. Meaning, on average, telcos need 14.1% less energy per year to carry the same traffic load as the prior year. This improvement is in line with the stated goal of both telcos and their vendors: to improve the network's energy efficiency over time. The biggest improvements in the MWh/Petabyte metric since 2019 are BT, Entel, Rogers, Tele2, and Veon. The worst result came from Saudi Telecom (STC), which used 104 MWh/PB in 2023, from 90 in 2019. The poorest result in 2023 alone was reported by Vodafone, which improved (lowered) its MWh/PB ratio by just 3.8% YoY.
For climate change watchers, an important metric is greenhouse gas emissions (GHG), as measured in CO2 equivalent metric tons. We don't address emissions in this report, but we did in a December 2024 report. That report found that telco emissions in 2023 were about the same level (per unit of revenue) as in 2019, and that renewables accounted for only about 20% of energy used in 2023. Both findings were disappointing. So, this current report's conclusion is a welcome bit of good news.
Telco sustainability reports emphasize the importance of adopting energy efficient technologies and network designs. Vendors consider the energy efficiency of their solutions a crucial differentiator. As telcos attempt to lower energy costs and reduce their carbon footprints, vendors have an opportunity to support further improvements.
Coverage
Organizations mentioned:
|
|
Table of Contents
- Summary
- Telco network energy efficiency rising 14% per year
- Overview of the dataset
- The revenue-traffic conundrum persists
- Traffic carried per unit of energy consumed
- Vendors have a central role in sustaining improvements
- Conclusion
- Appendix
List of Tables and Figures
- Table 1: Summary metrics for the "Group of 30" telcos
- Figure 1: Petabytes of traffic on network per US$M in revenue, 2019-23*
- Figure 2: Growth rates of traffic, energy, and traffic per unit of energy consumed, 2020-23*
- Figure 3: Terabytes of traffic per MWh of energy consumed*
 2025-2029年全球獨木舟設備市場
 人形機器人 6D 扭力感測器市場(按感測器類型、感測器位置和應用)-全球預測,2025-2030 年
 2025年全球節能馬達市場報告
 2025 年至 2033 年中壓馬達市場按產品(交流馬達、直流馬達)、最終用戶(製程工業、離散工業、暖通空調)和地區分類
 全球開關磁阻馬達市場研究報告-產業分析、規模、佔有率、成長、趨勢和預測 2025 年至 2033 年
 2025年全球高速馬達市場報告
 AC馬達市場規模、佔有率和成長分析(按類型、電壓、最終用途和地區)- 產業預測 2025-2032
 2025-2033 年低壓電動馬達市場報告(按效率、最終用途產業、應用和地區分類)
 按類型(一般維修、大修)、服務(現場服務、非現場服務)、最終用途行業(公用事業、暖通空調、食品和飲料、採礦等)和地區分類的汽車維修和保養市場報告 2025- 2033
 船用馬達市場機會、成長動力、產業趨勢分析與 2025 - 2034 年預測