


 |
市場調查報告書
商品編碼
1597047
ADC受託製造的全球市場:各開發階段,各流程零件,各標的適應症,抗體世代,抗體來源,抗體同型,有效負載類別,連接試劑類別,各主要地區:2035年前的產業趨勢與全球預測ADC Contract Manufacturing Market by Stage of Development, Process Component, Target Indication, Antibody Generation, Antibody Isotype, Type of Payload, Type of Linker, Key Geographical Regions: Industry Trends and Global Forecasts, Till 2035 |
||||||
預計到 2035 年,全球 ADC 合約製造市場規模將從目前的 17.9 億美元增長到 68.8 億美元,到 2035 年的預測期間複合年增長率為 13%。
ADC 合約製造市場預計將顯著成長,這主要是由於對抗體藥物偶聯物等先進療法的需求不斷增長所推動。值得注意的是,已有超過20個ADC治療方案獲得各監管機構的批准。此外,針對多種癌症(包括實體瘤和血癌)的臨床試驗正在評估 260 多種藥物療法。這表明利益相關者在該領域做出了廣泛的開發努力。然而,與 ADC 製造相關的課題,例如藥物/接頭副反應、毒性暴露、污染、擴大規模以及製造設施的高資本投資,正在推動藥物開發公司外包關鍵活動。
隨著藥物開發商加大對這些創新療法的投資,ADC 合約製造市場預計將進一步擴大。此外,憑藉健康的早期研發管線,預計該領域的成長將長期持續。考慮到對 ADC 的需求不斷增長以及藥物開發公司的外包偏好,ADC 合約製造市場在預測期內可能會出現顯著的市場成長。
本報告提供全球ADC受託製造市場相關調查,提供市場概要,以及各開發階段,各流程零件,各標的適應症,抗體世代,抗體來源,抗體同型,有效負載類別,連接試劑類別,各地區的趨勢,及加入此市場的主要企業簡介等資訊。
目錄
第1章 序文
第2章 調查手法
第3章 經濟以及其他的計劃特有的考慮事項
第4章 摘要整理
第5章 簡介
第6章 ADC受託製造商:市場形勢
第7章 企業簡介
- 章概要
- MabPlex
- Lonza
- Abzena
- GBI
- CARBOGEN AMCIS
- Millipore Sigma
- WuXi Biologics
- Catalent Pharma Solutions
- Cerbios-Pharma
- Formosa Laboratories
- Sterling Pharma Solutions
- Piramal Pharma Solutions
- AbbVie Contract Manufacturing
第8章 企業競爭力分析
- 章概要
- 前提和鑰匙
- 調查手法
- ADC受託製造商:企業競爭力分析
- 大ADC契約製造商能力基準
第9章 ADC受託製造商:最近的擴大
第10章 ADC受託製造商:夥伴關係和合作
第11章 製造還是購買決策
第12章 價值鏈分析
第13章 ADC製造:能力分析
第14章 ADC治療藥:市場概要
第15章 臨床試驗的分析
第16章 有希望合作夥伴的分析
第17章 ADC治療藥:需求分析
第18章 地區能力分析
第19章 魅力和競爭力的矩陣
第20章 ADC受託製造市場
第21章 ADC受託製造市場,各開發階段
第22章 ADC受託製造市場,各流程零件
第23章 ADC受託製造市場,各標的適應症
第24章 ADC受託製造市場,抗體世代
第25章 ADC受託製造市場,抗體來源
第26章 ADC受託製造市場,抗體同型
第27章 ADC受託製造市場,有效負載類別
第28章 ADC受託製造市場,連接試劑類別
第29章 ADC受託製造市場,各主要地區
第30章 商用ADC受託製造市場
第31章 臨床ADC受託製造市場
第32章 市場影響分析:促進因素,阻礙因素,機會,課題
第33章 結論
第34章 採訪記錄
第35章 附錄I:表格形式資料
第36章 附錄II:企業及團體一覽
ADC CONTRACT MANUFACTURING MARKET: OVERVIEW
As per Roots Analysis, the global ADC contract manufacturing market is estimated to grow from USD 1.79 billion in the current year to USD 6.88 billion by 2035, at a CAGR of 13% during the forecast period, till 2035.
The market sizing and opportunity analysis has been segmented across the following parameters:
Stage of Development
- Phase I
- Phase II
- Phase III
- Commercial
Process Component
- Antibody
- HPAPI / Cytotoxic Payload
- Conjugation / Linker
- Fill / Finish
Target Indication
- Solid Tumors
- Hematological Tumors
- Others
Antibody Generation
- Second Generation
- Third Generation
- Fourth Generation
- Next Generation
Antibody Origin
- Humanized
- Chimeric
- Murine
- Others
Antibody Isotype
- IgG1
- IgG4
- Others
Type of Payload
- Auristatin
- Camptothecin
- DNA Topoisomerase I Inhibitor
- Maytansinoid
- Others
Type of Linker
- Maleimide
- SMCC
- Tetrapeptide-based linker
- Valine-citrulline
- Others
Key Geographical Regions
- North America
- Europe
- Asia-Pacific and Rest of the World
ADC CONTRACT MANUFACTURING MARKET: GROWTH AND TRENDS
The ADC contract manufacturing market is poised for significant growth, primarily driven by the growing demand for advanced therapeutic modalities, such as antibody drug conjugates. It is worth highlighting that more than 20 ADC therapeutic programs have already been approved by various regulatory agencies. In addition, more than 260 drug therapies targeting a wide range of cancers including solid tumors and hematological tumors are being evaluated in clinical trials. This demonstrates the extensive development efforts being undertaken by stakeholders in this domain. However, the challenges associated with ADC manufacturing, including drug / linker side reactions, exposure to toxicity, contamination, scale-up, and high capital investments in manufacturing facilities, have driven drug developers to outsource key operations.
As drug developers invest more in these innovative therapies, the market for ADC contract manufacturing is anticipated to expand further. Moreover, owing to the healthy early-stage pipeline, growth in this domain is expected to continue in the long-term as well. Given the increasing demand for ADCs and preference for outsourcing operations by drug developers, the ADC contract manufacturing market is likely to witness substantial market growth during the forecast period.
ADC CONTRACT MANUFACTURING MARKET: KEY INSIGHTS
The report delves into the current state of the ADC contract manufacturing market and identifies potential growth opportunities within the industry. Some key findings from the report include:
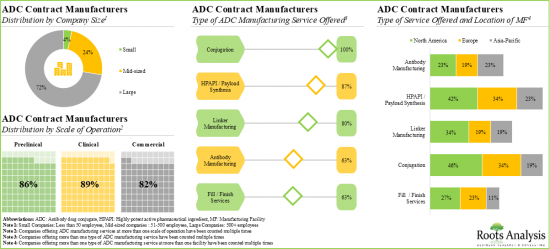
- 1. Currently, over 30 manufacturers claim to have the required capabilities to offer contract manufacturing and conjugation services for antibody drug conjugates, worldwide.
- 2. Majority of the large contract manufacturers (50%) offer a wide range of ADC manufacturing services across all scales of operation; more than 45% of the ADC conjugation facilities are based in North America.
- 3. In pursuit of building a competitive edge, industry stakeholders are actively upgrading their existing capabilities and augmenting their service portfolios to become one-stop shops for ADC manufacturing.
- 4. Majority of the trials focused on ADC therapeutics were registered in the last two years; 57% of the total clinical trial studies are being conducted across different sites in the US.
- 5. 75% of the manufacturing agreements inked in this domain were focused on clinical and commercial manufacturing of ADCs, across different geographical regions.
- 6. ADC therapeutic developers are anticipated to forge strategic alliances with contract manufacturing service providers in order to outsource complex manufacturing operations.
- 7. Driven by the expanding pipeline of ADC therapeutics and manufacturing expertise available with contract service providers, the ADC contract manufacturing market is poised to witness significant growth in the future.
- 8. Over 80% of the current demand for ADC therapeutics is generated by commercialized therapeutics targeted for solid tumors, 45% of the demand is likely to be generated in North America.
- 9. The global installed contract ADC manufacturing capacity is spread across various geographies; over 90% of the current installed capacity is available with large contract manufacturers.
- 10. With nearly 70% of the ADC manufacturing operations currently being outsourced, we expect the market to grow at an annualized rate of over 13.8% over the next decade.
- 11. With the rise in demand for ADC therapeutics, the opportunity for ADC components including antibody, payload and linker is estimated to increase significantly during the forecast period.
ADC CONTRACT MANUFACTURING MARKET: KEY SEGMENTS
By Stage of Development, Commercial Scale is Likely to Dominate the ADC Contract Manufacturing Market During the Forecast Period
Based on the stage of development, the global ADC contract manufacturing market is segmented into phase I, phase II, phase III and commercial. It is worth highlighting that majority of the current ADC contract manufacturing market is captured by the commercial phase (approved drug therapies) and this trend is likely to remain the same in the forthcoming years.
Currently, Antibody Segment Occupies the Largest Share in the ADC contract Manufacturing Market
Based on type of component, the global ADC contract manufacturing market is segmented into antibody, HPAPI / cytotoxic payload, conjugation / linker and fill / finish. It is worth highlighting that the antibody segment is likely to dominate the market in the coming decade.
Solid Tumors Segment is Likely to Capture the Largest Share of the ADC Contract Manufacturing Market During the Forecast Period
Based on the target indications, the global ADC contract manufacturing market is segmented into solid tumors, hematological tumors and others. The anticipated success of late-stage ADC therapeutics intended for the treatment of solid tumors is likely to drive the market in the forthcoming years.
At Present, Third Generation Antibodies Occupies the Largest Share in the ADC contract Manufacturing Market
Based on the antibody generation, the antibody market is segmented into second generation, third, fourth and next generation. It is worth highlighting that the market is primarily driven by revenues generated from the manufacturing of third-generation antibodies, followed by fourth-generation antibodies. This can be attributed to the fact that 40% of the approved ADCs and most clinical-stage ADCs contain third-generation components. This trend is unlikely to change in the near future.
Chimeric Origin ADCs Segment is the Fastest Growing Segment in the ADC contract Manufacturing Market
Based on the antibody origin, the ADC contract manufacturing market is segmented into humanized, chimeric, murine and others. It is worth highlighting that, currently, ADCs utilizing human origin antibodies holds the larger share in the ADC contract manufacturing market.
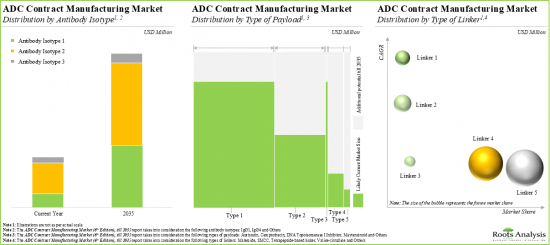
IgG1 Antibody Isotype Segment is Likely to Dominate the ADC Contract Manufacturing Market During the Forecast Period
Based on the type of antibody isotype, the ADC contract manufacturing market is segmented into IgG1, IgG4 and others. Currently, the market is dominated by IgG1 antibody isotype. This can be attributed to the fact that IgG1 is the most common isotype available in the serum. Additionally, it plays a significant role in triggering an immune response through the Fc-mediated effector function, which is the primary mode of action for tumor targeting therapies.
By Type of Payload, Camptothecin Segment Occupies the Largest Share in the ADC Contract Manufacturing Market among HPAPI / Cytotoxic Payloads
Based on the type of payload, the HPAPI / payload market is segmented into auristatin, camptothecin, DNA topoisomerase I inhibitor, maytansinoid and others. Whilst the camptothecin as an ADC payload/ warheads will be the primary driver of the overall market, it is worth highlighting that the market share for maytansinoid-based ADCs among HPAPI / cytotoxic payloads is likely to grow at a relatively higher CAGR.
By Type of Linker, Maleimide is Likely to Dominate the ADC Contract Manufacturing Market During the Forecast Period
Based on the type of linker, the conjugation / linker market is segmented into Maleimide, SMCC, tetrapeptide-based linker, valine-citrulline and others. Currently, Maleimide (as an ADC linker) captures the largest share in the market and this trend is unlikely to change in the near future.
North America Accounts for the Largest Share of the Market
Based on key geographical regions, the market is segmented into North America, Europe, Asia-Pacific and Rest of the World. It is worth highlighting that over the years, the market in Europe is expected to grow at a higher CAGR.
Example Players in the ADC Contract Manufacturing Market
- AbbVie Contract Manufacturing
- Abzena
- CARBOGEN AMCIS
- Catalent Pharma Solutions
- Cerbios-Pharma
- Formosa Laboratories
- GBI
- Lonza
- MabPlex
- Millipore Sigma
- Piramal Pharma Solutions
- Sterling Pharma Solutions
- WuXi Biologics
Primary Research Overview
The opinions and insights presented in this study were influenced by discussions conducted with multiple stakeholders. The research report features detailed transcripts of interviews held with the following industry stakeholders:
- Chief Executive Officer, BSP Pharmaceuticals
- Technical Business Development Manager, BSP Pharmaceuticals
- Chief Executive Officer & Founder, Oxford BioTherapeutics
- Ex-Chief Executive Officer, Abzena
- Chief Executive Officer & Co-Founder, Syndivia
- Chief Commercial Officer, Cerbios-Pharma
- Chief Business Officer, NBE-Therapeutics
- Executive Director, Eisai
- Chief Innovation Officer, Eisai
- Director, Business Development, Synaffix
- Ex-Director of CDMO, Pierre Fabre
- Director Corporate Development, Goodwin Biotechnology
- Director, Business Development, Catalent Pharma Solutions
- Ex-Group Product Manager, Catalent Pharma Solutions
- Business Development Manager, Cerbios-Pharma
- Ex-Head of Bioconjugates Commercial Development, Lonza
- Ex-Site Head, Piramal Pharma Solutions
- Associate Scientist, Ajinomoto Bio-Pharma Services
ADC CONTRACT MANUFACTURING MARKET: RESEARCH COVERAGE
- The report features an in-depth analysis of the ADC contract manufacturing market, focusing on key market segments, including stage of development, process component, target indication, antibody generation, antibody origin, antibody isotype, type of payload, type of linker and key geographical regions.
- The report analyzes various factors such as drivers, restraints, opportunities, and challenges affecting market growth.
- A comprehensive evaluation of companies involved in ADC contract manufacturing, considering various parameters, such as year of establishment, company size (in terms of number of employees), location of headquarters, type of ADC manufacturing service offered (antibody manufacturing, cytotoxic drugs and HPAPI manufacturing and payload synthesis, linker manufacturing, conjugation and fill / finish services), type of additional service offered (proof-of-concept studies, process development and scale-up and analytical development), scale of operation (Preclinical, clinical and commercial) and location of manufacturing facility.
- A comprehensive competitive analysis of ADC contract manufacturers, examining factors such as manufacturing strength (in terms of scale of operation and number of ADC manufacturing facilities), service strength and supplier strength.
- In-depth profiles of key industry players in ADC contract manufacturing market, focusing on company overviews, financial information (if available), manufacturing services portfolio, location of production facilities, and an insightful recent development and future outlook.
- An examination of the different expansion efforts made by ADC contract manufacturers in this field to enhance their manufacturing capabilities, since 2019. This analysis considers various factors, including the year of expansion, type of expansion, purpose of expansion (manufacturing, analytical / development and fill / finish), scale of operation (preclinical, clinical and commercial), location of expanded facility, type of facility and most active players (based on number of expansion initiatives).
- An analysis of partnerships established in this sector, since 2019, based on several parameters, such as year of partnership, type of partnership (acquisitions, joint ventures, licensing agreements, manufacturing agreements, mergers, product development agreements, product development and manufacturing agreements, research agreements, technology integration agreements and others), purpose of agreement, scale of operation and most active players (in terms of number of partnerships). This section also highlights the regional distribution of partnership activity in this market.
- An insightful framework that emphasizes the key indicators and factors that need to be considered by ADC developers to determine whether to manufacture their respective products in-house or outsource the manufacturing operation to contract service providers.
- A comprehensive overview of the different stages involved in the production of antibody-drug conjugates (ADCs), including antibody manufacturing, payload production, linker creation, conjugation, and fill/finish processes, along with insights into the cost implications at each stage.
- Estimation of global ADC manufacturing / bioconjugation capacity, derived from data provided by various stakeholders in the public domain. This analysis emphasizes the distribution of the available capacity on the basis of company size (small, mid-sized and large), key geographical regions (North America, Europe and Asia-Pacific) and key players (in terms of highest bioconjugation capacity).
- An overview of the current market landscape of antibody-drug conjugates (ADCs), along with an in-depth analysis of the ADC pipeline. This analysis considers various relevant parameters, including status of development, target disease indication, therapeutic area, line of treatment, dosing frequency, type of therapy, target antigen, antibody isotype, payload / cytotoxin / warhead, type of payload and type of linker.
- Examination of completed, ongoing, and planned clinical studies of various drug conjugates based on parameters like trial registration year, trial status, trial phase, enrolled patient population, type of sponsor / collaborator, target population, study design, most active industry players, and non-industry players (in terms of number of trials) and key geographical regions.
- A detailed evaluation of over 140 antibody-drug conjugate (ADC) therapy developers that are most likely to collaborate with ADC contract manufacturers. This analysis considers various relevant parameters, including developer strength (in terms of company size and its experience), pipeline maturity (in terms of number of drugs in pipeline, their stage of development and type of target indication) and manufacturing capabilities.
- Informed estimates of the annual commercial and clinical demand for ADC therapeutics (in kilograms) based on several relevant parameters, such as target patient population, dosing frequency and dose strength of approved products and clinical stage candidates.
- A comprehensive regional capability assessment framework that evaluates key geographies by various parameters, including number of ADC contract manufacturers, number of ADC manufacturing facilities, number of facility expansions, installed ADC bioconjugation capacity, number of registered clinical trials and demand for ADCs in that particular geographical region.
- A detailed assessment of the current market scenario (in terms of existing competition and growth opportunities) across emerging and established market segments, plotted on a 2X2 matrix.
KEY QUESTIONS ANSWERED IN THIS REPORT
- How many companies are currently engaged in this market?
- Which are the leading companies in this market?
- What kind of partnership models are commonly adopted by industry stakeholders?
- What is the current annual demand for ADC therapeutics?
- What are the factors that are likely to influence the evolution of this market?
- What is the current and future market size?
- What is the CAGR of this market?
- How is the current and future market opportunity likely to be distributed across key market segments?
REASONS TO BUY THIS REPORT
- The report provides a comprehensive market analysis, offering detailed revenue projections of the overall market and its specific sub-segments. This information is valuable to both established market leaders and emerging entrants.
- Stakeholders can leverage the report to gain a deeper understanding of the competitive dynamics within the market. By analyzing the competitive landscape, businesses can make informed decisions to optimize their market positioning and develop effective go-to-market strategies.
- The report offers stakeholders a comprehensive overview of the market, including key drivers, barriers, opportunities, and challenges. This information empowers stakeholders to stay abreast of market trends and make data-driven decisions to capitalize on growth prospects.
ADDITIONAL BENEFITS
- Complimentary PPT Insights Packs
- Complimentary Excel Data Packs for all Analytical Modules in the Report
- 10% Free Content Customization
- Detailed Report Walkthrough Session with Research Team
- Free Updated report if the report is 6-12 months old or older
TABLE OF CONTENTS
1. PREFACE
- 1.1. ADC Contract Manufacturers: Market Overview
- 1.2. Market Share Insights
- 1.3. Market Segmentation Overview
- 1.4. Key Market Insights
- 1.5. Report Coverage
- 1.6. Key Questions Answered
- 1.7. Chapter Outlines
2. RESEARCH METHODOLOGY
- 2.1. Chapter Overview
- 2.2. Research Assumptions
- 2.3. Project Methodology
- 2.4. Forecast Methodology
- 2.5. Robust Quality Control
- 2.6. Key Market Segmentations
- 2.7. Key Considerations
- 2.7.1. Demographics
- 2.7.2. Economic Factors
- 2.7.3. Government Regulations
- 2.7.4. Supply Chain
- 2.7.5. COVID Impact / Related Factors
- 2.7.6. Market Access
- 2.7.7. Healthcare Policies
- 2.7.8. Industry Consolidation
3. ECONOMIC AND OTHER PROJECT SPECIFIC CONSIDERATIONS
- 3.1. Chapter Overview
- 3.2. Market Dynamics
- 3.2.1. Time Period
- 3.2.1.1. Historical Trends
- 3.2.1.2. Current and Forecasted Estimates
- 3.2.2. Currency Coverage
- 3.2.2.1. Overview of Major Currencies Affecting the Market
- 3.2.2.2. Impact of Currency Fluctuations on the Industry
- 3.2.3. Foreign Exchange Impact
- 3.2.3.1. Evaluation of Foreign Exchange Rates and Their Impact on Market
- 3.2.3.2. Strategies for Mitigating
- 3.2.1. Time Period
Foreign Exchange Risk
- 3.2.4. Recession
- 3.2.4.1. Historical Analysis of Past Recessions and Lessons Learnt
- 3.2.4.2. Assessment of Current Economic Conditions and Potential Impact on the Market
- 3.2.5. Inflation
- 3.2.5.1. Measurement and Analysis of Inflationary Pressures in the Economy
- 3.2.5.2. Potential Impact of Inflation on the Market Evolution
4. EXECUTIVE SUMMARY
5. INTRODUCTION
- 5.1. Chapter Overview
- 5.2. Key Components of ADCs
- 5.2.1. Antibody
- 5.2.2. Cytotoxin (Payloads)
- 5.2.3. Linker
- 5.3. ADC Manufacturing
- 5.3.1. Key Steps
- 5.3.2. Technical Challenges
- 5.3.3. Need for Outsourcing
- 5.4. Challenges Associated with Supply Chain and Method Transfer
- 5.4.1. Growing Demand for One-Stop Shops and Integrated Service Providers
- 5.5. Selecting a CMO Partner
- 5.6. Future Perspective
6. ADC CONTRACT MANUFACTURERS: MARKET LANDSCAPE
- 6.1. Chapter Overview
- 6.2. ADC Contract Manufacturers: Overall Market Landscape
- 6.2.1. Analysis by Year of Establishment
- 6.2.2. Analysis by Company Size
- 6.2.3. Analysis by Location of Headquarters
- 6.2.4. Analysis by Type of ADC Manufacturing Service Offered
- 6.2.5. Analysis by Type of Additional Service Offered
- 6.2.6. Analysis by Scale of Operation
- 6.2.7. Analysis by Location of Manufacturing Facilities
7. COMPANY PROFILES
- 7.1. Chapter Overview
- 7.2. MabPlex
- 7.2.1. Company Overview
- 7.2.2. ADC Related Services
- 7.2.3. Manufacturing Facilities
- 7.2.4. Recent Developments and Future Outlook
- 7.3. Lonza
- 7.3.1. Company Overview
- 7.3.2. Financial Information
- 7.3.3. ADC Related Services
- 7.3.4. Manufacturing Facilities
- 7.3.5. Recent Developments and Future Outlook
- 7.4. Abzena
- 7.4.1. Company Overview
- 7.4.2. ADC Related Services
- 7.4.3. Manufacturing Facilities
- 7.4.4. Recent Developments and Future Outlook
- 7.5. GBI
- 7.5.1. Company Overview
- 7.5.2. ADC Related Services
- 7.5.3. Manufacturing Facilities
- 7.5.4. Recent Developments and Future Outlook
- 7.6. CARBOGEN AMCIS
- 7.6.1. Company Overview
- 7.6.2. ADC Related Services
- 7.6.3. Manufacturing Facilities
- 7.6.4. Recent Developments and Future Outlook
- 7.7. Millipore Sigma
- 7.7.1. Company Overview
- 7.7.2. ADC Related Offerings
- 7.7.3. Manufacturing Facilities
- 7.7.4. Recent Developments and Future Outlook
- 7.8. WuXi Biologics
- 7.8.1. Company Overview
- 7.8.2. Financial Information
- 7.8.3. ADC Related Services
- 7.8.4. Manufacturing Facilities
- 7.8.5. Recent Developments and Future Outlook
- 7.9. Catalent Pharma Solutions
- 7.9.1. Company Overview
- 7.9.2. Financial Information
- 7.9.3. ADC Related Services
- 7.9.4. Manufacturing Facilities
- 7.9.5. Recent Developments and Future Outlook
- 7.10. Cerbios-Pharma
- 7.10.1. Company Overview
- 7.10.2. ADC Related Services
- 7.10.3. Manufacturing Facilities
- 7.10.4. Recent Developments and Future Outlook
- 7.11. Formosa Laboratories
- 7.11.1. Company Overview
- 7.11.2. ADC Related Services
- 7.11.3. Manufacturing Facilities
- 7.11.4. Recent Developments and Future Outlook
- 7.12. Sterling Pharma Solutions
- 7.12.1. Company Overview
- 7.12.2. ADC Related Services
- 7.12.3. Manufacturing Facilities
- 7.12.4. Recent Developments and Future Outlook
- 7.13. Piramal Pharma Solutions
- 7.13.1. Company Overview
- 7.13.2. ADC Related Services
- 7.13.3. Manufacturing Facilities
- 7.13.4. Recent Developments and Future Outlook
- 7.14. AbbVie Contract Manufacturing
- 7.14.1. Company Overview
- 7.14.2. ADC Related Services
- 7.14.3. Manufacturing Facilities
- 7.14.4. Recent Developments and Future Outlook
8. COMPANY COMPETITIVENESS ANALYSIS
- 8.1. Chapter Overview
- 8.2. Assumptions and Key
Parameters
- 8.3. Methodology
- 8.4. ADC Contract Manufacturers: Company Competitiveness Analysis
- 8.3.1. ADC Contract Manufacturers based in North America (Peer Group I)
- 8.3.2. ADC Contract Manufacturers based in Europe (Peer Group II)
- 8.3.3. ADC Contract Manufacturers based in Asia-Pacific (Peer Group III)
- 8.4. Capability Benchmarking of Top ADC Contract Manufacturers
9. ADC CONTRACT MANUFACTURERS: RECENT EXPANSIONS
- 9.1. Chapter Overview
- 9.2. ADC Contract Manufacturers: Recent Expansions
- 9.2.1. Analysis by Year of Expansion
- 9.2.2. Analysis by Type of Expansion
- 9.2.3. Analysis by Purpose of Expansion
- 9.2.4. Analysis by Scale of Operation
- 9.2.5. Analysis by Location of Expanded Facility
- 9.2.6. Most Active Players: Analysis by Number of Expansions
10. ADC CONTRACT MANUFACTURERS: PARTNERSHIPS AND COLLABORATIONS
- 10.1. Chapter Overview
- 10.2. Partnership Models
- 10.3. ADC Contract Manufacturers: Partnerships and Collaborations
- 10.3.1. Analysis by Year of Partnership
- 10.3.2. Analysis by Type of Partnership
- 10.3.3. Analysis by Purpose of Partnership
- 10.3.4. Analysis by Scale of Operation
- 10.3.5. Most Active Players: Analysis by Number of Partnerships
- 10.3.6. Analysis by Geography
- 10.3.6.1. Intercontinental and Intracontinental Agreements
- 10.3.6.2. Local and International Agreements
11. MAKE VERSUS BUY DECISION MAKING
- 11.1. Chapter Overview
- 11.2. Assumptions and Key Parameters
- 11.2.1. Scenario 1
- 11.2.2. Scenario 2
- 11.2.3. Scenario 3
- 11.2.4. Scenario 4
- 11.3. Concluding Remarks
12. VALUE CHAIN ANALYSIS
- 12.1. Chapter Overview
- 12.2. ADC Development Value Chain
- 12.3. Cost Distribution across the Value Chain
- 12.3.1. Cost Associated with Antibody Manufacturing
- 12.3.2. Cost Associated with Payload and Linker Manufacturing
- 12.3.3. Cost Associated with Conjugation
- 12.3.4. Cost Associated with Fill / Finish
13. ADC MANUFACTURING: CAPACITY ANALYSIS
- 13.1. Chapter Overview
- 13.2. Key Assumptions and Methodology
- 13.3. ADC Manufacturing: Global Installed Capacity
- 13.3.1. Analysis by Company Size
- 13.3.2. Analysis by Location of Headquarters
- 13.3.3. Analysis by Location of Manufacturing Facilities
- 13.3.3.1 Analysis by Region
- 13.3.3.2. Analysis by Country
- 13.3.4. Analysis by Key Players
14. ADC THERAPEUTICS: MARKET OVERVIEW
- 14.1. Chapter Overview
- 14.2. Antibody Drug Conjugates: Therapies Pipeline
- 14.2.1. Analysis by Status of Development
- 14.2.2. Analysis by Target Disease Indication
- 14.2.3. Analysis by Therapeutic Area
- 14.2.4. Analysis by Line of Treatment
- 14.2.5. Analysis by Dosing Frequency
- 14.2.6. Analysis by Type of Therapy
- 14.2.7. Analysis by Target Antigen
- 14.2.8. Analysis by Antibody Isotype
- 14.2.9. Analysis by Payload / Cytotoxin / Warhead
- 14.2.10. Analysis by Type of Payload
- 14.2.11. Analysis by Linker
- 14.2.12. Analysis by Type of Linker (Cleavable / Non-Cleavable)
- 14.3. Antibody Drug Conjugates: Therapies to Watch
- 14.4. Concluding Remarks
15. CLINICAL TRIAL ANALYSIS
- 15.1. Chapter Overview
- 15.2. Scope and Methodology
- 15.3. Antibody Drug Conjugates: Clinical Trial Analysis
- 15.3.1. Analysis by Trial Registration Year
- 15.3.2. Analysis by Trial Status
- 15.3.3. Analysis of Enrolled Patient Population by Trial Status
- 15.3.4. Analysis by Trial Registration Year and Trial Status
- 15.3.5. Analysis of Enrolled Patient Population by Trial Registration Year
- 15.3.6. Analysis by Trial Phase
- 15.3.7. Analysis of Enrolled Patient Population by Trial Phase
- 15.3.8. Analysis by Type of Sponsor / Collaborator
- 15.3.9. Analysis by Target Population
- 15.3.10. Analysis by Study Design
- 15.3.11. Most Active Industry Players: Analysis by Number of Trials
- 15.3.12. Most Active Non-Industry Players: Analysis by Number of Trials
- 15.3.13. Analysis of Clinical Trials by Geography
- 15.3.14. Analysis of Enrolled Patient
Population by Geography
16. LIKELY PARTNER ANALYSIS
- 16.1. Chapter Overview
- 16.2. Scoring Criteria and Key Assumptions
- 16.3. Scope and Methodology
- 16.4. Potential Strategic Partners based in North America
- 16.4.1. Most Likely Partners
- 16.4.2. Likely Partners
- 16.4.3. Least Likely Partners
- 16.5. Potential Strategic Partners based in Europe
- 16.5.1. Most Likely Partners
- 16.5.2. Likely Partners
- 16.5.3. Least Likely Partners
- 16.6. Potential Strategic Partners based in Asia-Pacific and Rest of the World
- 16.6.1. Most Likely Partners
- 16.6.2. Likely Partners
- 16.6.3. Least Likely Partners
17. ADC THERAPEUTICS: DEMAND ANALYSIS
- 17.1. Chapter Overview
- 17.2. Key Assumptions and Methodology
- 17.3. ADC Therapeutics: Global Annual Demand
- 17.3.1. ADC Therapeutics: Annual Commercial Demand
- 17.3.1.1. Analysis by Target Indication
- 17.3.1.2. Analysis by Antibody Origin
- 17.3.1.3. Analysis by Antibody Isotype
- 17.3.1.4. Analysis by Type of Payload
- 17.3.1.5. Analysis by Type of Linker
- 17.3.1.6 Analysis by Key Geographical Regions
- 17.3.2. ADC Therapeutics: Annual Clinical Demand
- 17.3.2.1. Analysis by Phase of Development
- 17.3.2.2. Analysis by Target Indication
- 17.3.2.3. Analysis by Antibody Origin
- 17.3.2.4. Analysis by Antibody Isotype
- 17.3.2.5. Analysis by Type of Payload
- 17.3.2.6. Analysis by Type of Linker
- 17.3.2.7. Analysis by Key Geographical Regions
- 17.3.1. ADC Therapeutics: Annual Commercial Demand
18. REGIONAL CAPABILITY ANALYSIS
- 18.1. Chapter Overview
- 18.2. Assumptions and Key Parameters
- 18.3. ADC Contract Manufacturing Capabilities in North America
- 18.4. ADC Contract Manufacturing Capabilities in Europe
- 18.5. ADC Contract Manufacturing Capabilities in Asia-Pacific and Rest of the World
19. ATTRACTIVENESS COMPETETIVENESS MATRIX
- 19.1. Chapter Overview
- 19.2. AC Matrix: Overview
- 19.2.1. Strong Business Segments
- 19.2.2. Average Business Segments
- 19.2.3. Weak Business Segments
- 19.3. AC Matrix: Analytical Methodology
- 19.4. AC Matrix: Overall ADC Contract Manufacturing Market Scenario
- 19.4.1. AC Matrix: ADC Contract Manufacturing Scenario for Type of ADC Manufacturing Service Offered
- 19.4.2. AC Matrix: ADC Contract Manufacturing Scenario for Key Geographical Regions
20. ADC CONTRACT MANUFACTURING MARKET
- 20.1. Chapter Overview
- 20.2. Key Assumptions and Methodology
- 20.3. Global ADC Therapeutics Market, Historical Trends and Forecasted Estimates, till 2035
- 20.4. Global ADC Contract Manufacturing Market, Historical Trends and Forecasted Estimates, till 2035
- 20.4.1. Scenario Analysis
- 20.5. Key Market Segmentations
21. ADC CONTRACT MANUFACTURING MARKET, BY STAGE OF DEVELOPMENT
- 21.1. Chapter Overview
- 21.2. Key Assumptions and Methodology
- 21.3. ADC Contract Manufacturing Market: Distribution by Stage of Development, Current Year, 2028 and 2035
- 21.3.1. Phase I: Forecasted Estimates, till 2035
- 21.3.2. Phase II: Forecasted Estimates, till 2035
- 21.3.3. Phase III: Forecasted Estimates, till 2035
- 21.3.4. Commercial: Forecasted Estimates, till 2035
- 21.4. Data Triangulation and Validation
22. ADC CONTRACT MANUFACTURING MARKET, BY PROCESS COMPONENT
- 22.1. Chapter Overview
- 22.2. Key Assumptions and Methodology
- 22.3. ADC Contract Manufacturing Market: Distribution by Process Component, Current Year, 2028 and 2035
- 22.3.1. Antibody: Forecasted Estimates, till 2035
- 22.3.2. HPAPI / Cytotoxic Payload: Forecasted Estimates, till 2035
- 22.3.3. Conjugation / Linker: Forecasted Estimates, till 2035
- 22.3.4. Fill / Finish: Forecasted Estimates, till 2035
- 22.4. Data Triangulation and Validation
23. ADC CONTRACT MANUFACTURING MARKET, BY TARGET INDICATION
- 23.1. Chapter Overview
- 23.2. Key Assumptions and Methodology
- 23.3. ADC Contract Manufacturing Market: Distribution by Target Indication, Current Year, 2028 and 2035
- 23.3.1. Solid Tumors: Forecasted
Estimates, till 2035
- 23.3.2. Hematological Tumors: Forecasted Estimates, till 2035
- 23.3.3. Others: Forecasted Estimates, till 2035
- 23.4. Data Triangulation and Validation
24. ADC CONTRACT MANUFACTURING MARKET, BY ANTIBODY GENERATION
- 24.1. Chapter Overview
- 24.2. Key Assumptions and Methodology
- 24.3. ADC Contract Manufacturing Market: Distribution by Antibody Generation, Current Year, 2028 and 2035
- 24.3.1. Second Generation: Forecasted Estimates, till 2035
- 24.3.2. Third Generation: Forecasted Estimates, till 2035
- 24.3.3. Fourth Generation: Forecasted Estimates, till 2035
- 24.3.4. Next Generation: Forecasted Estimates, till 2035
- 24.4. Data Triangulation and Validation
25. ADC CONTRACT MANUFACTURING MARKET, BY ANTIBODY ORIGIN
- 25.1. Chapter Overview
- 25.2. Key Assumptions and Methodology
- 25.3. ADC Contract Manufacturing Market: Distribution by Antibody Origin, Current Year, 2028 and 2035
- 25.3.1. Human Origin: Forecasted Estimates, till 2035
- 25.3.2. Chimeric Origin: Forecasted Estimates, till 2035
- 25.3.3. Murine Origin: Forecasted Estimates, till 2035
- 25.3.4. Others: Forecasted Estimates, till 2035
- 25.4. Data Triangulation and Validation
26. ADC CONTRACT MANUFACTURING MARKET, BY ANTIBODY ISOTYPE
- 26.1. Chapter Overview
- 26.2. Key Assumptions and Methodology
- 26.3. ADC Contract Manufacturing Market: Distribution by Antibody Isotype, Current Year, 2029 and 2035
- 26.3.1. IgG1: Forecasted Estimates, till 2035
- 26.3.2. IgG4: Forecasted Estimates, till 2035
- 26.3.3. Others: Forecasted Estimates, till 2035
- 26.4. Data Triangulation and
Validation
27. ADC CONTRACT MANUFACTURING MARKET, BY TYPE OF PAYLOAD
- 27.1. Chapter Overview
- 27.2. Key Assumptions and Methodology
- 27.3. ADC Contract Manufacturing Market: Distribution by Type of Payload, Current Year, 2029 and 2035
- 27.3.1. Camptothecin: Forecasted Estimates, till 2035
- 27.3.2. Maytansinoid: Forecasted Estimates, till 2035
- 27.3.3. Auristatin: Forecasted Estimates, till 2035
- 27.3.4. DNA topoisomerase I inhibitor: Forecasted Estimates, till 2035
- 27.3.5. Others: Forecasted Estimates, till 2035
- 27.4. Data Triangulation and Validation
28. ADC CONTRACT MANUFACTURING MARKET, BY TYPE OF LINKER
- 28.1. Chapter Overview
- 28.2. Key Assumptions and Methodology
- 28.3. ADC Contract Manufacturing Market: Distribution by Type of Linker, Current Year, 2029 and 2035
- 28.3.1. Maleimide: Forecasted Estimates, till 2035
- 28.3.2. SMCC: Forecasted Estimates, till 2035
- 28.3.3. Tetrapeptide-based linker: Forecasted Estimates, till 2035
- 28.3.4. Valine-citrulline: Forecasted Estimates, till 2035
- 28.3.5. Others: Forecasted Estimates, till 2035
- 28.4. Data Triangulation and Validation
29. ADC CONTRACT MANUFACTURING MARKET, BY KEY GEOGRAPHICAL REGIONS
- 29.1. Chapter Overview
- 29.2. Key Assumptions and Methodology
- 29.3. ADC Contract Manufacturing Market: Distribution by Key Geographical Regions, Current Year, 2029 and 2035
- 29.3.1. North America: Forecasted Estimates, till 2035
- 29.3.2. Europe: Forecasted Estimates, till 2035
- 29.3.3. Asia-Pacific and Rest of the World: Forecasted Estimates, till 2035
- 29.4. Data Triangulation and Validation
30. COMMERCIAL ADC CONTRACT MANUFACTURING MARKET
- 30.1. Chapter Overview
- 30.2. Key Assumptions and Methodology
- 30.3. Commercial ADC Contract Manufacturing Market, Forecasted Estimates, till 2035
- 30.3.1. Commercial ADC Contract Manufacturing Market: Distribution by Process Component, Forecasted Estimates, till 2035
- 30.3.2. Commercial ADC Contract Manufacturing Market: Distribution by Target Indication, Forecasted Estimates, till 2035
- 30.3.3. Commercial ADC Contract Manufacturing Market: Distribution by Antibody Generation, Forecasted Estimates, till 2035
- 30.3.4. Commercial ADC Contract Manufacturing Market: Distribution by Antibody Origin, Forecasted Estimates, till 2035
- 30.3.5. Commercial ADC Contract Manufacturing Market: Distribution by Antibody Isotype, Forecasted Estimates, till 2035
- 30.3.6. Commercial ADC Contract Manufacturing Market: Distribution by Type of Payload, Forecasted Estimates, till 2035
- 30.3.7. Commercial ADC Contract Manufacturing Market: Distribution by Type of Linker, Forecasted Estimates, till 2035
- 30.3.8. Commercial ADC Contract Manufacturing Market: Distribution by Key Geographical Regions, Forecasted Estimates, till 2035
31. CLINICAL ADC CONTRACT MANUFACTURING MARKET
- 31.1. Chapter Overview
- 31.2. Key Assumptions and Methodology
- 31.3. Clinical ADC Contract Manufacturing Market, Forecasted Estimates, till 2035
- 31.3.1. Clinical ADC Contract Manufacturing Market: Distribution by Phase of Development, Forecasted Estimates, till 2035
- 31.3.2. Clinical ADC Contract Manufacturing Market: Distribution by Process Component, Forecasted Estimates, till 2035
- 31.3.3. Clinical ADC Contract Manufacturing Market: Distribution by Target Indication, Forecasted Estimates, till 2035
- 31.3.4. Clinical ADC Contract Manufacturing Market: Distribution by Antibody Origin, Forecasted Estimates, till 2035
- 31.3.5. Clinical ADC Contract Manufacturing Market: Distribution by Antibody Isotype, Forecasted Estimates, till 2035
- 31.3.6. Clinical ADC Contract Manufacturing Market: Distribution by Type of Payload, Forecasted Estimates, till 2035
- 31.3.7. Clinical ADC Contract Manufacturing Market: Distribution by Type of Linker, Forecasted Estimates, till 2035
- 31.3.8. Clinical ADC Contract Manufacturing Market: Distribution by Key Geographical Regions, Forecasted Estimates, till 2035
32. MARKET IMPACT ANALYSIS: DRIVERS, RESTRAINTS, OPPORTUNITIES AND CHALLENGES
- 32.1. Chapter Overview
- 32.2. Market Drivers
- 32.3. Market Restraints
- 32.4. Market Opportunities
- 32.5. Market Challenges
- 32.6. Conclusion
33. CONCLUDING REMARKS
34. INTERVIEW TRANSCRIPTS
- 34.1. Chapter Overview
- 34.2. Company A
- 34.2.1. Company Snapshot
- 34.2.2. Interview Transcript: Chief Executive Officer and Technical Business Development Manager
- 34.3. Company B
- 34.3.1. Company Snapshot
- 34.3.2. Interview Transcript: Chief Executive Officer and Founder
- 34.4. Company C
- 34.4.1. Company Snapshot
- 34.4.2. Interview Transcript: Former Chief Executive Officer
- 34.5. Company D
- 34.5.1. Company Snapshot
- 34.5.2. Interview Transcript: Chief Executive Officer and Co-Founder
- 34.6. Company E
- 34.6.1. Company Snapshot
- 34.6.2. Interview Transcript: Chief Commercial Officer
- 34.7. Company F
- 34.7.1. Company Snapshot
- 34.7.2. Interview Transcript: Chief Business Officer
- 34.8. Company G
- 34.8.1. Company Snapshot
- 34.8.2. Interview Transcript: Executive Director and Chief Innovation Officer
- 34.9. Company H
- 34.9.1. Company Snapshot
- 34.9.2. Interview Transcript: Director, Business Development
- 34.10. Company I
- 34.10.1. Company Snapshot
- 34.10.2. Interview Transcript: Former Director of CDMO
- 34.11. Company J
- 34.11.1. Company Snapshot
- 34.11.2. Interview Transcript: Director Corporate Development
- 34.12. Company K
- 34.12.1. Company Snapshot
- 34.12.2. Interview Transcript: Business Development Manager
- 34.13. Company L
- 34.13.1. Company Snapshot
- 34.13.2. Interview Transcript: Director, Business Development and Former Group Product Manager
- 34.14. Company M
- 34.14.1. Company Snapshot
- 34.14.2. Interview Transcript: Former Head of Bioconjugates Commercial Development
- 34.15. Company N
- 34.15.1. Company Snapshot
- 34.15.2. Interview Transcript: Former Site Head
- 34.16. Company O
- 34.16.1. Company Snapshot
- 34.16.2. Interview Transcript: Associate General Manager
- 34.17. Interview Transcript: Director, Business Development, Leading CMO
- 34.18. Interview Transcript: Chief Executive Officer, Leading CMO
35. APPENDIX I: TABULATED DATA
36. APPENDIX II: LIST OF COMPANIES AND ORGANIZATIONS
List of Tables
- Table 5.1 Common Cytotoxins used for the Production od ADCs
- Table 5.2 Safebridge Categorization / OEL Bands for Highly Potent / Cytotoxic Compounds
- Table 6.1 ADC Contract Manufacturers: Information on Year of Establishment, Company Size, Location of Headquarters and Type of Manufacturer
- Table 6.2 ADC Contract Manufacturers: Information on Type of ADC Manufacturing Service Offered
- Table 6.3 ADC Contract Manufacturers: Information on Type of Additional Service Offered and Scale of Operation
- Table 6.4 ADC Contract Manufacturers: Information on Location of Manufacturing Facilities and Type of ADC Manufacturing Service Offered
- Table 7.1 List of Companies Profiled
- Table 7.2 MabPlex: Company Overview
- Table 7.3 MabPlex: ADC Related Services
- Table 7.4 MabPlex: Information on Manufacturing Facilities
- Table 7.5 Lonza: Company Overview
- Table 7.6 Lonza: ADC Related Services
- Table 7.7 Lonza: Information on Manufacturing Facilities
- Table 7.8 Lonza: Recent Developments and Future Outlook
- Table 7.9 Abzena: Company Overview
- Table 7.10 Abzena: ADC Related Services
- Table 7.11 Abzena: Information on Manufacturing Facilities
- Table 7.12 Abzena: Recent Developments and Future Outlook
- Table 7.13 GBI: Company Overview
- Table 7.14 GBI: ADC Related Services
- Table 7.15 GBI: Information on Manufacturing Facilities
- Table 7.16 CARBOGEN AMCIS: Company Overview
- Table 7.17 CARBOGEN AMCIS: ADC Related Services
- Table 7.18 CARBOGEN AMCIS: Information on Manufacturing Facilities
- Table 7.19 CARBOGEN AMCIS: Recent Developments and Future Outlook
- Table 7.20 Millipore Sigma: Company Overview
- Table 7.21 Millipore Sigma: ADC Related Services
- Table 7.22 Millipore Sigma: Information on Manufacturing Facilities
- Table 7.23 WuXi Biologics: Company Overview
- Table 7.24 WuXi Biologics: ADC Related Services
- Table 7.25 WuXi Biologics: Information on Manufacturing Facilities
- Table 7.26 WuXi Biologics: Recent Developments and Future Outlook
- Table 7.27 Catalent Pharma Solutions: Company Overview
- Table 7.28 Catalent Pharma Solutions: ADC Related Services
- Table 7.29 Catalent Pharma Solutions: Information on Manufacturing Facilities
- Table 7.30 Catalent Pharma Solutions: Recent Developments and Future Outlook
- Table 7.31 Cerbios-Pharma: Company Overview
- Table 7.32 Cerbios-Pharma: ADC Related Services
- Table 7.33 Cerbios-Pharma: Information on Manufacturing Facilities
- Table 7.34 Cerbios-Pharma: Recent Developments and Future Outlook
- Table 7.35 Formosa Laboratories: Company Overview
- Table 7.36 Formosa Laboratories: ADC Related Services
- Table 7.37 Formosa Laboratories: Information on Manufacturing Facilities
- Table 7.38 Sterling Pharma Solutions: Company Overview
- Table 7.39 Sterling Pharma Solutions: ADC Related Services
- Table 7.40 Sterling Pharma Solutions: Information on Manufacturing Facilities
- Table 7.41 Sterling Pharma Solutions: Recent Developments and
Future Outlook
- Table 7.42 Piramal Pharma Solutions: Company Overview
- Table 7.43 Piramal Pharma Solutions: ADC Related Services
- Table 7.44 Piramal Pharma Solutions: Information on Manufacturing Facilities
- Table 7.45 Piramal Pharma Solutions: Recent Developments and Future Outlook
- Table 7.46 AbbVie Contract Manufacturing: Company Overview
- Table 7.47 AbbVie Contract Manufacturing: ADC Related Services
- Table 7.48 AbbVie Contract Manufacturing: Information on Manufacturing Facilities
- Table 9.1 ADC Contract Manufacturers: Information on Month and Year of Expansion, Type of Expansion, Purpose of Expansion and Scale of Operation, 2019-2023
- Table 9.2 ADC Contract Manufacturers: Information on Location of Expanded Facility and Type of Facility
- Table 10.1 ADC Contract Manufacturers: Information on Year of Partnership, Type of Partnership, Purpose of Partnership and Scale of Operation, 2019-2023
- Table 10.2 ADC Contract Manufacturers: Information on Type of Agreement (Country and Continent)
- Table 12.1 ADC Components: Information on Cost of Cytotoxins
- Table 12.2 ADC Components: Information on Cost of Linkers
- Table 13.1 Global Installed ADC Contract Manufacturing Capacity: Sample Data Set (Yield)
- Table 13.2 Global Installed ADC Contract Manufacturing Capacity: Sample Data Set (Average Capacity)
- Table 13.3 Global Installed ADC Manufacturing Capacity: Information on Total Capacity based on Company Size
- Table 14.1 Antibody Drug Conjugates: Information on Drug Candidates, Developers, Status of Development, Target Disease Indication and Therapeutic Area
- Table 14.2 Antibody Drug Conjugates to Watch: Information on Drug Candidates, Developer, Status of Development, Target Disease Indication and Therapeutic Area
- Table 16.1 Most Likely Partners based in North America
- Table 16.2 Likely Partners based in North America
- Table 16.3 Least Likely Partners based in North America
- Table 16.4 Most Likely Partners based in Europe
- Table 16.5 Likely Partners based in Europe
- Table 16.6 Least Likely Partners based in Europe
- Table 16.7 Most Likely Partners based in Asia-Pacific and Rest of the World
- Table 16.8 Likely Partners based in Asia-Pacific and Rest of the World
- Table 16.9 Least Likely Partners based in Asia-Pacific and Rest of the World
- Table 17.1 List of Late Stage ADCs
- Table 34.1 BSP Pharmaceuticals: Key Highlights
- Table 34.2 Oxford BioTherapeutics: Key Highlights
- Table 34.3 Abzena: Key Highlights
- Table 34.4 Syndivia: Key Highlights
- Table 34.5 Cerbios-Pharma: Key Highlights
- Table 34.6 NBE-Therapeutics: Key Highlights
- Table 34.7 Eisai: Key Highlights
- Table 34.8 Synaffix: Key Highlights
- Table 34.9 Pierre Fabre: Key Highlights
- Table 34.10 Goodwin Biotechnology: Key Highlights
- Table 34.11 Cerbios-Pharma: Key Highlights
- Table 34.12 Catalent Pharma Solutions: Key Highlights
- Table 34.13 Lonza: Key Highlights
- Table 34.14 Piramal Pharma Solutions: Key Highlights
- Table 34.15 Ajinomoto Bio-Pharma Services: Key Highlights
- Table 35.1 ADC Contract Manufacturers: Distribution by Year of Establishment
- Table 35.2 ADC Contract Manufacturers: Distribution by Company Size
- Table 35.3 ADC Contract Manufacturers: Distribution by Location of Headquarters (Region)
- Table 35.4 ADC Contract Manufacturers: Distribution by Location of Headquarters (Country)
- Table 35.5 ADC Contract Manufacturers: Distribution by Company Size and Location of Headquarters
- Table 35.6 ADC Contract Manufacturers: Distribution by Type of ADC Manufacturing Service Offered
- Table 35.7 ADC Contract Manufacturers: Distribution by Location of Headquarters and ADC Manufacturing Service Offered
- Table 35.8 ADC Contract Manufacturers: Distribution by Type of Additional Service Offered
- Table 35.9 ADC Contract Manufacturers: Distribution by Scale of Operation
- Table 35.10 ADC Contract Manufacturers: Distribution by Type of ADC Manufacturing Service Offered and Scale of Operation
- Table 35.11 ADC Contract Manufacturers: Distribution by Location of Manufacturing Facilities and Type of ADC Manufacturing Service Offered
- Table 35.12 Lonza: Annual Revenues, FY 2019 Onwards (CHF Billion)
- Table 35.13 WuXi Biologics: Annual Revenues, FY 2019 Onwards (RMB Billion)
- Table 35.14 Catalent Pharma Solutions: Annual Revenues, FY 2019 Onwards (USD Billion)
- Table 35.15 Recent Expansions: Cumulative Year-wise Trend, Since 2013
- Table 35.16 Recent Expansions: Distribution by Type of Expansion
- Table 35.17 Recent Expansions: Distribution by Purpose of Expansion
- Table 35.18 Recent Expansions: Distribution by Year of Expansion and Purpose of Expansion
- Table 35.19 Recent Expansions: Distribution by Scale of Operation
- Table 35.20 Recent Expansions: Distribution by Location of Expanded Facility
- Table 35.21 Recent Expansions: Distribution by Location of Expanded Facility and Scale of Operation
- Table 35.22 Most Active Players: Distribution by Number of Expansions
- Table 35.23 Partnerships and Collaborations: Cumulative Year-wise Trend, Since 2012
- Table 35.24 Partnerships and Collaborations: Distribution by Type of Partnership
- Table 35.25 Partnerships and Collaborations: Distribution by Year and Type of Partnership
- Table 35.26 Partnerships and Collaborations: Distribution by Purpose of Partnership
- Table 35.27 Partnerships and Collaborations: Distribution by Scale of Operation
- Table 35.28 Most Active Players: Distribution by Number of Partnership Instances
- Table 35.29 Partnerships and Collaborations: Distribution by Intercontinental and Intracontinental Agreements
- Table 35.30 Partnerships and Collaborations: Distribution by Local and International Agreements
- Table 35.31 Global Installed ADC Manufacturing Capacity: Distribution by Company Size
- Table 35.32 Global Installed ADC Manufacturing Capacity: Distribution by Location of Headquarters
- Table 35.33 Global Installed ADC Manufacturing Capacity: Distribution by Location of Manufacturing Facilities (Region)
- Table 35.34 Global Installed ADC Manufacturing Capacity: Distribution by Location of Manufacturing Facilities (Country)
- Table 35.35 Global Installed ADC Manufacturing Capacity: Distribution by Key Players
- Table 35.36 Antibody Drug Conjugates: Distribution by Status of Development
- Table 35.37 Antibody Drug Conjugates: Distribution by Target Disease Indication
- Table 35.38 Antibody Drug Conjugates: Distribution by Therapeutic Area
- Table 35.39 Antibody Drug Conjugates: Distribution by Line of Treatment
- Table 35.40 Antibody Drug Conjugates: Distribution by Dosing Frequency
- Table 35.41 Antibody Drug Conjugates: Distribution by Type of Therapy
- Table 35.42 Antibody Drug Conjugates: Distribution by Target Antigen
- Table 35.43 Antibody Drug Conjugates: Distribution by Antibody Isotype
- Table 35.44 Antibody Drug Conjugates: Distribution by Payload / Cytotoxin / Warhead
- Table 35.45 Antibody Drug Conjugates: Distribution by Type of Payload
- Table 35.46 Antibody Drug Conjugates: Distribution by Linker
- Table 35.47 Antibody Drug Conjugates: Distribution by Type of Linker
- Table 35.48 Clinical Trial Analysis: Cumulative Year-wise Trend, Pre-2016-2023
- Table 35.49 Clinical Trial Analysis: Distribution by Trial Status
- Table 35.50 Clinical Trial Analysis: Distribution of Enrolled Patient Population by Trial Status
- Table 35.51 Clinical Trial Analysis: Distribution by Trial Registration Year and Trial Status, Since 2016
- Table 35.52 Clinical Trial Analysis: Distribution of Enrolled Patient Population by Trial Registration Year, Since 2016
- Table 35.53 Clinical Trial Analysis: Distribution by Trial Phase
- Table 35.54 Clinical Trial Analysis: Distribution of Enrolled Patient Population by Trial Phase
- Table 35.55 Clinical Trial Analysis: Distribution by Type of Sponsor / Collaborator
- Table 35.56 Clinical Trial Analysis: Distribution by Target Population
- Table 35.57 Clinical Trial Analysis: Distribution by Study Design
- Table 35.58 Most Active Industry Players: Distribution by Number of Trials
- Table 35.59 Most Active Non-Industry Players: Distribution by Number of Trials
- Table 35.60 Clinical Trial Analysis: Geographical Distribution by Number of Clinical Trials
- Table 35.61 Clinical Trial Analysis: Geographical Distribution by Number of Patients Enrolled
- Table 35.62 Global Demand for ADC Therapeutics, till 2035 (in kg)
- Table 35.63 Global Demand for ADC Therapeutics: Distribution by Stage of Development, till 2035 (in kg)
- Table 35.64 Global Commercial Demand for ADC Therapeutics, till 2035 (in kg)
- Table 35.65 Global Commercial Demand for ADC Therapeutics: Distribution by Target Indication, till 2035 (in kg)
- Table 35.66 Global Commercial Demand for ADC Therapeutics: Distribution by Antibody Origin, till 2035 (in kg)
- Table 35.67 Global Commercial Demand for ADC Therapeutics: Distribution by Antibody Isotype, till 2035 (in kg)
- Table 35.68 Global Commercial Demand for ADC Therapeutics: Distribution by Type of Payload, till 2035 (in kg)
- Table 35.69 Global Commercial Demand for ADC Therapeutics: Distribution by Type of Linker, till 2035 (in kg)
- Table 35.70 Global Commercial Demand for ADC Therapeutics: Distribution by Geography, till 2035 (in kg)
- Table 35.71 Global Clinical Demand for ADC Therapeutics, till 2035 (in kg)
- Table 35.72 Global Clinical Demand for ADC Therapeutics: Distribution by Phase of Development, till 2035 (in kg)
- Table 35.73 Global Clinical Demand for ADC Therapeutics: Distribution by Target Indication, till 2035 (in kg)
- Table 35.74 Global Clinical Demand for ADC Therapeutics: Distribution by Antibody Origin, till 2035 (in kg)
- Table 35.75 Global Clinical Demand for ADC Therapeutics: Distribution by Antibody Isotype, till 2035 (in kg)
- Table 35.76 Global Clinical Demand for ADC Therapeutics: Distribution by Type of Payload, till 2035 (in kg)
- Table 35.77 Global Clinical Demand for ADC Therapeutics: Distribution by Type of Linker, till 2035 (in kg)
- Table 35.78 Global Clinical Demand for ADC Therapeutics: Distribution by Geography, till 2035 (in kg)
- Table 35.79 Global ADC Contract Manufacturing Market, Historical Trends and Forecasted Estimates, till 2035 (USD Billion)
- Table 35.80 Global ADC Contract Manufacturing Market, Forecasted Estimates, till 2035, Conservative Scenario (USD Billion)
- Table 35.81 Global ADC Contract Manufacturing Market, Forecasted Estimates, till 2035, Optimistic Scenario (USD Billion)
- Table 35.82 Global ADC Contract Manufacturing Market: Distribution by Stage of Development, Current Year, 2028 and 2035 (USD Billion)
- Table 35.83 ADC Contract Manufacturing Market for Phase I ADCs, Forecasted Estimates, till 2035 (USD Billion)
- Table 35.84 ADC Contract Manufacturing Market for Phase II ADCs, Forecasted Estimates, till 2035 (USD Billion)
- Table 35.85 ADC Contract Manufacturing Market for Phase III ADCs, Forecasted Estimates, till 2035 (USD Billion)
- Table 35.86 ADC Contract Manufacturing Market for Commercial ADCs, Forecasted Estimates, till 2035 (USD Billion)
- Table 35.87 Global ADC Contract Manufacturing Market: Distribution by Process Component, Current Year, 2028 and 2035 (USD Billion)
- Table 35.88 ADC Contract Manufacturing Market for Antibody, Forecasted Estimates, till 2035 (USD Billion)
- Table 35.89 ADC Contract Manufacturing Market for HPAPI / Cytotoxic Payload, Forecasted Estimates, till 2035 (USD Billion)
- Table 35.90 ADC Contract Manufacturing Market for Conjugation / Linker, Forecasted Estimates, till 2035 (USD Billion)
- Table 35.91 ADC Contract Manufacturing Market for Fill / Finish, Forecasted Estimates, till 2035 (USD Billion)
- Table 35.92 Global ADC Contract Manufacturing Market: Distribution by Target Indication, Current Year, 2028 and 2035 (USD Billion)
- Table 35.93 ADC Contract Manufacturing Market for Solid Tumors, Forecasted Estimates, till 2035 (USD Billion)
- Table 35.94 ADC Contract Manufacturing Market for Hematological Tumors, Forecasted Estimates, till 2035 (USD Billion)
- Table 35.95 ADC Contract Manufacturing Market for Others, Forecasted Estimates, till 2035 (USD Billion)
- Table 35.96 Global ADC Contract Manufacturing Market: Distribution by Antibody Generation, Current Year, 2028 and 2035 (USD Billion)
- Table 35.97 ADC Contract Manufacturing Market for Second Generation, Forecasted Estimates, till 2035 (USD Billion)
- Table 35.98 ADC Contract Manufacturing Market for Third Generation, Forecasted Estimates, till 2035 (USD Billion)
- Table 35.99 ADC Contract Manufacturing Market for Fourth Generation, Forecasted Estimates, till 2035 (USD Billion)
- Table 35.100 ADC Contract Manufacturing Market for Next Generation, Forecasted Estimates, till 2035 (USD Billion)
- Table 35.101 Global ADC Contract Manufacturing Market: Distribution by Antibody Origin, Current Year, 2028 and 2035 (USD Billion)
- Table 35.102 ADC Contract Manufacturing Market for Human Origin, Forecasted Estimates, till 2035 (USD Billion)
- Table 35.103 ADC Contract Manufacturing Market for Chimeric Origin, Forecasted Estimates, till 2035 (USD Billion)
- Table 35.104 ADC Contract Manufacturing Market for Murine Origin, Forecasted Estimates, till 2035 (USD Billion)
- Table 35.105 ADC Contract Manufacturing Market for Others, Forecasted Estimates, till 2035 (USD Billion)
- Table 35.106 Global ADC Contract Manufacturing Market: Distribution by Antibody Isotype, Current Year, 2028 and 2035 (USD Billion)
- Table 35.107 ADC Contract Manufacturing Market for IgG1, Forecasted Estimates, till 2035 (USD Billion)
- Table 35.108 ADC Contract Manufacturing Market for IgG4, Forecasted Estimates, till 2035 (USD Billion)
- Table 35.109 ADC Contract Manufacturing Market for Others, Forecasted Estimates, till 2035 (USD Billion)
- Table 35.110 Global ADC Contract Manufacturing Market: Distribution by Type of Payload, Current Year, 2028 and 2035 (USD Billion)
- Table 35.111 ADC Contract Manufacturing Market for Camptothecin, Forecasted Estimates, till 2035 (USD Billion)
- Table 35.112 ADC Contract Manufacturing Market for Maytansinoid, Forecasted Estimates, till 2035 (USD Billion)
- Table 35.113 ADC Contract Manufacturing Market for Auristatin, Forecasted Estimates, till 2035 (USD Billion)
- Table 35.114 ADC Contract Manufacturing Market for DNA Topoisomerase I Inhibitor, Forecasted Estimates, till 2035 (USD Billion)
- Table 35.115 ADC Contract Manufacturing Market for Others, Forecasted Estimates, till 2035 (USD Billion)
- Table 35.116 Global ADC Contract Manufacturing Market: Distribution by Type of Linker, Current Year, 2028 and 2035 (USD Billion)
- Table 35.117 ADC Contract Manufacturing Market for Maleimide, Forecasted Estimates, till 2035 (USD Billion)
- Table 35.118 ADC Contract Manufacturing Market for SMCC, Forecasted Estimates, till 2035 (USD Billion)
- Table 35.119 ADC Contract Manufacturing Market for Tetrapeptide-based linker, Forecasted Estimates, till 2035 (USD Billion)
- Table 35.120 ADC Contract Manufacturing Market for Valine-citrulline, Forecasted Estimates, till 2035 (USD Billion)
- Table 35.121 ADC Contract Manufacturing Market for Others, Forecasted Estimates, till 2035 (USD Billion)
- Table 35.122 Global ADC Contract Manufacturing Market: Distribution by Key Geographical Regions, Current Year, 2028 and 2035 (USD Billion)
- Table 35.123 ADC Contract Manufacturing Market in North America, Forecasted Estimates, till 2035 (USD Billion)
- Table 35.124 ADC Contract Manufacturing Market in Europe, Forecasted Estimates, till 2035 (USD Billion)
- Table 35.125 ADC Contract Manufacturing Market in Asia-Pacific and Rest of the World, Forecasted Estimates, till 2035 (USD Billion)
- Table 35.126 Commercial ADC Contract Manufacturing Market, Forecasted Estimates, till 2035 (USD Billion)
- Table 35.127 Commercial ADC Contract Manufacturing Market: Distribution by Process Component, Forecasted Estimates, till 2035 (USD Billion)
- Table 35.128 Commercial ADC Contract Manufacturing Market: Distribution by Target Indication, Forecasted Estimates, till 2035 (USD Billion)
- Table 35.129 Commercial ADC Contract Manufacturing Market: Distribution by Antibody Generation, Forecasted Estimates, till 2035 (USD Billion)
- Table 35.130 Commercial ADC Contract Manufacturing Market: Distribution by Antibody Origin, Forecasted Estimates, till 2035 (USD Billion)
- Table 35.131 Commercial ADC Contract Manufacturing Market: Distribution by Antibody Isotype, Forecasted Estimates, till 2035 (USD Billion)
- Table 35.132 Commercial ADC Contract Manufacturing Market: Distribution by Type of Payload, Forecasted Estimates, till 2035 (USD Billion)
- Table 35.133 Commercial ADC Contract Manufacturing Market: Distribution by Type of Linker, Forecasted Estimates, till 2035 (USD Billion)
- Table 35.134 Commercial ADC Contract Manufacturing Market: Distribution by Key Geographical Regions, Forecasted Estimates, till 2035 (USD Billion)
- Table 35.135 Clinical ADC Contract Manufacturing Market, Forecasted Estimates, till 2035 (USD Billion)
- Table 35.136 Clinical ADC Contract Manufacturing Market: Distribution by Phase of Development, Forecasted Estimates, till 2035 (USD Billion)
- Table 35.137 Clinical ADC Contract Manufacturing Market: Distribution by Process Component, Forecasted Estimates, till 2035 (USD Billion)
- Table 35.138 Clinical ADC Contract Manufacturing Market: Distribution by Target Indication, Forecasted Estimates, till 2035 (USD Billion)
- Table 35.139 Clinical ADC Contract Manufacturing Market: Distribution by Antibody Origin, Forecasted Estimates, till 2035 (USD Billion)
- Table 35.140 Clinical ADC Contract Manufacturing Market: Distribution by Antibody Isotype, Forecasted Estimates, till 2035 (USD Billion)
- Table 35.141 Clinical ADC Contract Manufacturing Market: Distribution by Type of Payload, Forecasted Estimates, till 2035 (USD Billion)
- Table 35.142 Clinical ADC Contract Manufacturing Market: Distribution by Type of Linker, Forecasted Estimates, till 2035 (USD Billion)
- Table 35.143 Clinical ADC Contract Manufacturing Market: Distribution by Key Geographical Regions, Forecasted Estimates, till 2035 (USD Billion)
List of Figures
- Figure 2.1 Research Methodology: Project Methodology
- Figure 2.2 Research Methodology: Forecast Methodology
- Figure 2.3 Research Methodology: Robust Quality Control
- Figure 2.4 Research Methodology: Key Market Segmentation
- Figure 3.1 Lessons Learnt from Past Recessions
- Figure 4.1 Executive Summary: Market Landscape
- Figure 4.2 Executive Summary: Recent Expansions
- Figure 4.3 Executive Summary: Partnerships and Collaborations
- Figure 4.4 Executive Summary: Capacity Analysis
- Figure 4.5 Executive Summary: Clinical Trial Analysis
- Figure 4.6 Executive Summary: Demand Analysis
- Figure 4.7 Executive Summary: Market Sizing and Opportunity Analysis
- Figure 5.1 Key Components of an ADC
- Figure 5.2 ADC Manufacturing Steps
- Figure 5.3 Key Parameters while Selecting a CMO Partner
- Figure 6.1 ADC Contract Manufacturers: Distribution by Year of Establishment
- Figure 6.2 ADC Contract Manufacturers: Distribution by Company Size
- Figure 6.3 ADC Contract Manufacturers: Distribution by Location of Headquarters (Region)
- Figure 6.4 ADC Contract Manufacturers: Distribution by Location of Headquarters (Country)
- Figure 6.5 ADC Contract Manufacturers: Distribution by Company Size and Location of Headquarters
- Figure 6.6 ADC Contract Manufacturers: Distribution by Type of ADC Manufacturing Service Offered
- Figure 6.7 ADC Contract Manufacturers: Distribution by Location of Headquarters and ADC Manufacturing Service Offered
- Figure 6.8 ADC Contract Manufacturers: Distribution by Type of Additional Service Offered
- Figure 6.9 ADC Contract Manufacturers: Distribution by Scale of Operation
- Figure 6.10 ADC Contract Manufacturers: Distribution by Type of ADC Manufacturing Service Offered and Scale of Operation
- Figure 6.11 ADC Contract Manufacturers: Distribution by Location of Manufacturing Facilities and Type of ADC Manufacturing Service Offered
- Figure 7.1 Lonza: Annual Revenues, FY 2019-H1 FY 2023 (CHF Billion)
- Figure 7.2 WuXi Biologics: Annual Revenues, FY 2019-H1 FY 2023 (RMB Billion)
- Figure 7.3 Catalent Pharma Solutions: Annual Revenues, FY 2019 - FY 2023 (USD Billion)
- Figure 8.1 Company Competitiveness Analysis: ADC Contract Manufacturers based in North America
- Figure 8.2 Company Competitiveness Analysis: ADC Contract Manufacturers based in Europe
- Figure 8.3 Company Competitiveness Analysis: ADC Contract Manufacturers based in Asia-Pacific
- Figure 8.4 Capability Benchmarking: Distribution of Top 9 Players (Wind Rose Representation)
- Figure 9.1 Recent Expansions: Cumulative Year-wise Trend, 2013-2023
- Figure 9.2 Recent Expansions: Distribution by Type of Expansion
- Figure 9.3 Recent Expansions: Distribution by Purpose of Expansion
- Figure 9.4 Recent Expansions: Distribution by Year of Expansion and Purpose of Expansion
- Figure 9.5 Recent Expansions: Distribution by Scale of Operation
- Figure 9.6 Recent Expansions: Distribution by Location of Expanded Facility
- Figure 9.7 Recent Expansions: Distribution by Location of Expanded Facility and Scale of Operation
- Figure 9.8 Most Active Players: Distribution by Number of Expansions
- Figure 10.1 Partnerships and Collaborations: Cumulative Year-wise Trend, 2012-2023
- Figure 10.2 Partnerships and Collaborations: Distribution by Type of Partnership
- Figure 10.3 Partnerships and Collaborations: Distribution by Year and Type of Partnership
- Figure 10.4 Partnerships and Collaborations: Distribution by Purpose of Partnership
- Figure 10.5 Partnerships and Collaborations: Distribution by Scale of Operation
- Figure 10.6 Most Active Players: Distribution by Number of Partnership Instances
- Figure 10.7 Partnerships and Collaborations: Distribution by Intercontinental and Intracontinental Agreements
- Figure 10.8 Partnerships and Collaborations: Distribution by Local and International Agreements
- Figure 11.1 Make versus Buy Decision Making Framework
- Figure 11.2 Make versus Buy Decision Making: Possible Scenario Descriptions
- Figure 12.1 Value Chain Analysis: ADC Development Overview
- Figure 12.2 Value Chain Analysis: ADC Contract Manufacturing Overview
- Figure 12.3 ADC Therapeutics: Distribution by Cost of Raw Material Required for Clinical Stage Manufacturing
- Figure 12.4 Value Chain Analysis: Distribution by Cost
- Figure 12.5 Costs Associated with Antibody Manufacturing
- Figure 12.6 Costs Associated with Payload and Linker Manufacturing
- Figure 12.7 Costs Associated with Conjugation
- Figure 12.8 Costs Associated with Fill / Finish
- Figure 13.1 Global Installed ADC Manufacturing Capacity: Distribution by Company Size
- Figure 13.2 Global Installed ADC Manufacturing Capacity: Distribution by Location of Headquarters
- Figure 13.3 Global Installed ADC Manufacturing Capacity: Distribution by Location of Manufacturing Facilities (Region)
- Figure 13.4 Global Installed ADC Manufacturing Capacity: Distribution by Location of Manufacturing Facilities (Country)
- Figure 13.5 Global Installed ADC Manufacturing Capacity: Distribution by Key Players
- Figure 14.1 Antibody Drug Conjugates: Distribution by Status of Development
- Figure 14.2 Antibody Drug Conjugates: Distribution by Target Disease Indication
- Figure 14.3 Antibody Drug Conjugates: Distribution by Therapeutic Area
- Figure 14.4 Antibody Drug Conjugates: Distribution by Line of Treatment
- Figure 14.5 Antibody Drug Conjugates: Distribution by Dosing Frequency
- Figure 14.6 Antibody Drug Conjugates: Distribution by Type of Therapy
- Figure 14.7 Antibody Drug Conjugates: Distribution by Target Antigen
- Figure 14.8 Antibody Drug Conjugates: Distribution by Antibody Isotype
- Figure 14.9 Antibody Drug Conjugates: Distribution by Payload / Cytotoxin / Warhead
- Figure 14.10 Antibody Drug Conjugates: Distribution by Type of Payload
- Figure 14.11 Antibody Drug Conjugates: Distribution by Linker
- Figure 14.12 Antibody Drug Conjugates: Distribution by Type of Linker
- Figure 15.1 Clinical Trial Analysis: Cumulative Year-wise Trend, Pre-2016-2023
- Figure 15.2 Clinical Trial Analysis: Distribution by Trial Status
- Figure 15.3 Clinical Trial Analysis: Distribution of Enrolled Patient Population by Trial Status
- Figure 15.4 Clinical Trial Analysis: Distribution by Trial Registration Year and Trial Status, 2016 Onwards
- Figure 15.5 Clinical Trial Analysis: Distribution of Enrolled Patient Population by Trial Registration Year, 2016 Onwards
- Figure 15.6 Clinical Trial Analysis: Distribution by Trial Phase
- Figure 15.7 Clinical Trial Analysis: Distribution of Enrolled Patient Population by Trial Phase
- Figure 15.8 Clinical Trial Analysis: Distribution by Type of Sponsor / Collaborator
- Figure 15.9 Clinical Trial Analysis: Distribution by Target Population
- Figure 15.10 Clinical Trial Analysis: Distribution by Study Design
- Figure 15.11 Most Active Industry Players: Distribution by Number of Trials
- Figure 15.12 Most Active Non-Industry Players: Distribution by Number of Trials
- Figure 15.13 Clinical Trial Analysis: Geographical Distribution by Number of Clinical Trials
- Figure 15.14 Clinical Trial Analysis: Geographical Distribution by Number of Patients Enrolled
- Figure 17.1 Global Demand for ADC Therapeutics, till 2035 (in kg)
- Figure 17.2 Global Demand for ADC Therapeutics: Distribution by Stage of Development, till 2035 (in kg)
- Figure 17.3 Global Commercial Demand for ADC Therapeutics, till 2035 (in kg)
- Figure 17.4 Global Commercial Demand for ADC Therapeutics: Distribution by Target Indication, till 2035 (in kg)
- Figure 17.5 Global Commercial Demand for ADC Therapeutics: Distribution by Antibody Origin, till 2035 (in kg)
- Figure 17.6 Global Commercial Demand for ADC Therapeutics: Distribution by Antibody Isotype, till 2035 (in kg)
- Figure 17.7 Global Commercial Demand for ADC Therapeutics: Distribution by Type of Payload, till 2035 (in kg)
- Figure 17.8 Global Commercial Demand for ADC Therapeutics: Distribution by Type of Linker, till 2035 (in kg)
- Figure 17.9 Global Commercial Demand for ADC Therapeutics: Distribution by Geography, till 2035 (in kg)
- Figure 17.10 Global Clinical Demand for ADC Therapeutics, till 2035 (in kg)
- Figure 17.11 Global Clinical Demand for ADC Therapeutics: Distribution by Phase of Development, till 2035 (in kg)
- Figure 17.12 Global Clinical Demand for ADC Therapeutics: Distribution by Target Indication, till 2035 (in kg)
- Figure 17.13 Global Clinical Demand for ADC Therapeutics: Distribution by Antibody Origin, till 2035 (in kg)
- Figure 17.14 Global Clinical Demand for ADC Therapeutics: Distribution by Antibody Isotype, till 2035 (in kg)
- Figure 17.15 Global Clinical Demand for ADC Therapeutics: Distribution by Type of Payload, till 2035 (in kg)
- Figure 17.16 Global Clinical Demand for ADC Therapeutics: Distribution by Type of Linker, till 2035 (in kg)
- Figure 17.17 Global Clinical Demand for ADC Therapeutics: Distribution by Geography, till 2035 (in kg)
- Figure 18.1 Regional Capability Analysis: ADC Contract Manufacturing Capabilities in North America
- Figure 18.2 Regional Capability Analysis: ADC Contract Manufacturing Capabilities in Europe
- Figure 18.3 Regional Capability Analysis: ADC Contract Manufacturing Capabilities in Asia-Pacific and Rest of the World
- Figure 19.1 AC Matrix: Pictorial Representation
- Figure 19.2 AC Matrix: Overall ADC Contract Manufacturing Market Scenario, 2023-2028 and 2029-2035
- Figure 19.3 AC Matrix: ADC Contract Manufacturing Scenario for Type of ADC Manufacturing Service Offered
- Figure 19.4 AC Matrix: ADC Contract Manufacturing Scenario for Key Geographical Regions
- Figure 20.1 Global ADC Contract Manufacturing Market, Historical Trends and Forecasted Estimates, till 2035 (USD Billion)
- Figure 20.2 Global ADC Contract Manufacturing Market, Forecasted Estimates, till 2035, Conservative Scenario (USD Billion)
- Figure 20.3 Global ADC Contract Manufacturing Market, Forecasted Estimates, till 2035, Optimistic Scenario (USD Billion)
- Figure 21.1 Global ADC Contract Manufacturing Market: Distribution by Stage of Development, Current Year, 2028 and 2035 (USD Billion)
- Figure 21.2 ADC Contract Manufacturing Market for Phase I ADCs, Forecasted Estimates, till 2035 (USD Billion)
- Figure 21.3 ADC Contract Manufacturing Market for Phase II ADCs, Forecasted Estimates, till 2035 (USD Billion)
- Figure 21.4 ADC Contract Manufacturing Market for Phase III ADCs, Forecasted Estimates, till 2035 (USD Billion)
- Figure 21.5 ADC Contract Manufacturing Market for Commercial ADCs, Forecasted Estimates, till 2035 (USD Billion)
- Figure 22.1 Global ADC Contract Manufacturing Market: Distribution by Process Component, Current Year, 2028 and 2035 (USD Billion)
- Figure 22.2 ADC Contract Manufacturing Market for Antibody, Forecasted Estimates, till 2035 (USD Billion)
- Figure 22.3 ADC Contract Manufacturing Market for HPAPI / Cytotoxic Payload, Forecasted Estimates, till 2035 (USD Billion)
- Figure 22.4 ADC Contract Manufacturing Market for Conjugation / Linker, Forecasted Estimates, till 2035 (USD Billion)
- Figure 22.5 ADC Contract Manufacturing Market for Fill / Finish, Forecasted Estimates, till 2035 (USD Billion)
- Figure 23.1 Global ADC Contract Manufacturing Market: Distribution by Target Indication, Current Year, 2028 and 2035 (USD Billion)
- Figure 23.2 ADC Contract Manufacturing Market for Solid Tumors, Forecasted Estimates, till 2035 (USD Billion)
- Figure 23.3 ADC Contract Manufacturing Market for Hematological Tumors, Forecasted Estimates, till 2035 (USD Billion)
- Figure 23.4 ADC Contract Manufacturing Market for Others, Forecasted Estimates, till 2035 (USD Billion)
- Figure 24.1 Global ADC Contract Manufacturing Market: Distribution by Antibody Generation, Current Year, 2028 and 2035 (USD Billion)
- Figure 24.2 ADC Contract Manufacturing Market for Second Generation, Forecasted Estimates, till 2035 (USD Billion)
- Figure 24.3 ADC Contract Manufacturing Market for Third Generation, Forecasted Estimates, till 2035 (USD Billion)
- Figure 24.4 ADC Contract Manufacturing Market for Fourth Generation, Forecasted Estimates, till 2035 (USD Billion)
- Figure 24.5 ADC Contract Manufacturing Market for Next Generation, Forecasted Estimates, till 2035 (USD Billion)
- Figure 25.1 Global ADC Contract Manufacturing Market: Distribution by Antibody Origin, Current Year, 2028 and 2035 (USD Billion)
- Figure 25.2 ADC Contract Manufacturing Market for Human Origin, Forecasted Estimates, till 2035 (USD Billion)
- Figure 25.3 ADC Contract Manufacturing Market for Chimeric Origin, Forecasted Estimates, till 2035 (USD Billion)
- Figure 25.4 ADC Contract Manufacturing Market for Murine Origin, Forecasted Estimates, till 2035 (USD Billion)
- Figure 25.5 ADC Contract Manufacturing Market for Others, Forecasted Estimates, till 2035 (USD Billion)
- Figure 26.1 Global ADC Contract Manufacturing Market: Distribution by Antibody Isotype, Current Year, 2028 and 2035 (USD Billion)
- Figure 26.2 ADC Contract Manufacturing Market for IgG1, Forecasted Estimates, till 2035 (USD Billion)
- Figure 26.3 ADC Contract Manufacturing Market for IgG4, Forecasted Estimates, till 2035 (USD Billion)
- Figure 26.4 ADC Contract Manufacturing Market for Others, Forecasted Estimates, till 2035 (USD Billion)
- Figure 27.1 Global ADC Contract Manufacturing Market: Distribution by Type of Payload, Current Year, 2028 and 2035 (USD Billion)
- Figure 27.2 ADC Contract Manufacturing Market for Camptothecin, Forecasted Estimates, till 2035 (USD Billion)
- Figure 27.3 ADC Contract Manufacturing Market for Maytansinoid, Forecasted Estimates, till 2035 (USD Billion)
- Figure 27.4 ADC Contract Manufacturing Market for Auristatin, Forecasted Estimates, till 2035 (USD Billion)
- Figure 27.5 ADC Contract Manufacturing Market for DNA Topoisomerase I Inhibitor, Forecasted Estimates, till 2035 (USD Billion)
- Figure 27.6 ADC Contract Manufacturing Market for Others, Forecasted Estimates, till 2035 (USD Billion)
- Figure 28.1 Global ADC Contract Manufacturing Market: Distribution by Type of Linker, Current Year, 2028 and 2035 (USD Billion)
- Figure 28.2 ADC Contract Manufacturing Market for Maleimide, Forecasted Estimates, till 2035 (USD Billion)
- Figure 28.3 ADC Contract Manufacturing Market for SMCC, Forecasted Estimates, till 2035 (USD Billion)
- Figure 28.4 ADC Contract Manufacturing Market for Tetrapeptide-based linker, Forecasted Estimates, till 2035 (USD Billion)
- Figure 28.5 ADC Contract Manufacturing Market for Valine-citrulline, Forecasted Estimates, till 2035 (USD Billion)
- Figure 28.6 ADC Contract Manufacturing Market for Others, Forecasted Estimates, till 2035 (USD Billion)
- Figure 29.1 Global ADC Contract Manufacturing Market: Distribution by Key Geographical Regions, Current Year, 2028 and 2035 (USD Billion)
- Figure 29.2 ADC Contract Manufacturing Market in North America, Forecasted Estimates, till 2035 (USD Billion)
- Figure 29.3 ADC Contract Manufacturing Market in Europe, Forecasted Estimates, till 2035 (USD Billion)
- Figure 29.4 ADC Contract Manufacturing Market in Asia-Pacific and Rest of the World, Forecasted Estimates, till 2035 (USD Billion)
- Figure 30.1 Commercial ADC Contract Manufacturing Market, Forecasted Estimates, till 2035 (USD Billion)
- Figure 30.2 Commercial ADC Contract Manufacturing Market: Distribution by Process Component, Forecasted Estimates, till 2035 (USD Billion)
- Figure 30.3 Commercial ADC Contract Manufacturing Market: Distribution by Target Indication, Forecasted Estimates, till 2035 (USD Billion)
- Figure 30.4 Commercial ADC Contract Manufacturing Market: Distribution by Antibody Generation, Forecasted Estimates, till 2035 (USD Billion)
- Figure 30.5 Commercial ADC Contract Manufacturing Market: Distribution by Antibody Origin, Forecasted Estimates, till 2035 (USD Billion)
- Figure 30.6 Commercial ADC Contract Manufacturing Market: Distribution by Antibody Isotype, Forecasted Estimates, till 2035 (USD Billion)
- Figure 30.7 Commercial ADC Contract Manufacturing Market: Distribution by Type of Payload, Forecasted Estimates, till 2035 (USD Billion)
- Figure 30.8 Commercial ADC Contract Manufacturing Market: Distribution by Type of Linker, Forecasted Estimates, till 2035 (USD Billion)
- Figure 30.9 Commercial ADC Contract Manufacturing Market: Distribution by Key Geographical Regions, Forecasted Estimates, till 2035 (USD Billion)
- Figure 31.1 Clinical ADC Contract Manufacturing Market, Forecasted Estimates, till 2035 (USD Billion)
- Figure 31.2 Clinical ADC Contract Manufacturing Market: Distribution by Phase of Development, Forecasted Estimates, till 2035 (USD Billion)
- Figure 31.3 Clinical ADC Contract Manufacturing Market: Distribution by Process Component, Forecasted Estimates, till 2035 (USD Billion)
- Figure 31.4 Clinical ADC Contract Manufacturing Market: Distribution by Target Indication, Forecasted Estimates, till 2035 (USD Billion)
- Figure 31.5 Clinical ADC Contract Manufacturing Market: Distribution by Antibody Origin, Forecasted Estimates, till 2035 (USD Billion)
- Figure 31.6 Clinical ADC Contract Manufacturing Market: Distribution by Antibody Isotype, Forecasted Estimates, till 2035 (USD Billion)
- Figure 31.7 Clinical ADC Contract Manufacturing Market: Distribution by Type of Payload, Forecasted Estimates, till 2035 (USD Billion)
- Figure 31.8 Clinical ADC Contract Manufacturing Market: Distribution by Type of Linker, Forecasted Estimates, till 2035 (USD Billion)
- Figure 31.9 Clinical ADC Contract Manufacturing Market: Distribution by Key Geographical Regions, Forecasted Estimates, till 2035 (USD Billion)
- Figure 33.1 Concluding Remarks: Market Landscape
- Figure 33.2 Concluding Remarks: Recent Expansions
- Figure 33.3 Concluding Remarks: Partnerships and Collaborations
- Figure 33.4 Concluding Remarks: Clinical Trial Analysis
- Figure 33.5 Concluding Remarks: Likely Partner Analysis
- Figure 33.6 Concluding Remarks: Capacity Analysis
- Figure 33.7 Concluding Remarks: Demand Analysis
- Figure 33.8 Concluding Remarks: Market Sizing and Opportunity Analysis (1/3)
- Figure 33.9 Concluding Remarks: Market Sizing and Opportunity Analysis (2/3)
- Figure 33.10 Concluding Remarks: Market Sizing and Opportunity Analysis (3/3)
 抗體合約製造市場:產業趨勢及2035年全球預測 - 各製造抗體類型,各使用表現系統類型,各產業規模,各地區
 全球醫療CMO市場(2025年版)
 全球製藥契約製造市場(至 2030 年):按服務(藥物開發、製藥(原料藥、FDF - 腸外給藥、片劑、膠囊)、生技藥品(原料藥、FDF)、包裝和標籤、填充完成)和分子(小型、大型(ADC、CGT))
 量子運算的 ADC 和 DAC 市場規模、佔有率和趨勢分析報告:按類型、架構、量子位元類型、應用層、地區和細分市場預測,2025-2030 年
 契約製造市場按服務類型、產品、技術、用戶類型和最終用戶產業分類-2025-2030 年全球預測生物製藥契約製造市場(按服務類型、產品類型、生產階段、應用和組織規模)—2025-2030 年全球預測脂質CMO市場:產業趨勢及全球預測 - 依脂質類型、公司規模、業務規模和主要地區即用型醫藥包裝市場:產業趨勢及全球預測 - 依容器類型、封蓋類型、製造材料及主要地區劃分抗體受託製造的全球市場,規模,佔有率,趨勢,產業分析報告:各產品,來歷,各治療領域,各終端用戶,各地區 - 市場預測,2025年~2034年
 製藥和生物製藥合約製造市場-全球產業規模、佔有率、趨勢、機會和預測(按產品類型、服務、地區和競爭細分,2020-2030 年)