


 |
市場調查報告書
商品編碼
1616873
全球基因療法市場:按治療領域,載體類型,治療類型,基因遞送方法,給藥途徑,地區,主要參與者,銷售預測:行業趨勢和到2035年的全球預測Gene Therapy Market by Therapeutic Area, Type of Vector, Type of Therapy, Type of Gene Delivery Method, Route of Administration, Geographical Regions, Leading Players and Sales Forecast: Industry Trends and Global Forecasts, Till 2035 |
||||||
全球基因治療市場規模預計將從目前的 24 億美元成長到 2035 年的 165 億美元,到 2035 年的預測期間複合年增長率為 19.25%。
先天性異常和遺傳性基因突變涵蓋多種疾病,包括癌症疾病、遺傳疾病、自體免疫疾病和神經系統疾病。根據世界衛生組織 (WHO) 統計,每 1,000 人中就有 10 人患有遺傳疾病,導致全球有超過 7,000 萬人患有這些疾病。值得注意的是,全球 40% 以上的嬰兒死亡率與各種遺傳疾病有關。目前正在進行多項研究和開發工作,以開發安全有效的方法來選擇性地糾正個別患者的突變致病基因。在這種背景下,基因治療成為有前景的選擇。這些治療旨在針對疾病的潛在遺傳原因,透過引入突變基因的健康版本或禁用體內致病基因的功能。值得注意的是,過去幾年已有超過1,100項與基因治療相關的臨床試驗註冊。此外,根據美國 FDA 的數據,預計到 2025 年每年將有 10 至 20 種治療方法進入市場。在基因治療公司的共同努力以及對有效單劑量治療日益增長的推動下,基因治療市場預計將在預測期內顯著增長。
該報告考察了全球基因治療市場,並提供了市場概況,包括按治療領域、載體類型、治療類型、基因遞送方法、給藥途徑、地區和進入市場的公司劃分的趨勢。
目錄
第1章 前言
第2章 研究方法
第3章市場動態
第4章經濟考慮
第5章執行摘要
第6章 簡介
- 章節概述
- 基因治療的演變
- 基因治療的分類
- 給藥途徑
- 基因治療的作用機制
- 基因治療的優點和缺點
- 與基因治療相關的挑戰
- 基因組編輯簡介
- 結論
第 7 章 基因傳遞載體
- 章節概述
- 基因導入方法
- 用於重組療法的病毒載體
- 用於重組療法的非病毒載體
第8章 監理狀況及贖回場景
- 章節概述
- 北美監管指南
- 歐洲監管指南
- 亞太地區監管指南
- 贖回場景
- 結論與未來展望
第9章 市場狀況
第10章 開發者情況
- 章節概述
- 基因治療:競爭格局
第11章 公司簡介
第12章商業化基因療法
第13章關鍵商業化策略
第14章 晚期基因治療
- 章節概述
- Lumevok (GS010)
- OTL-103
- PTC-AADC
- BMN270
- rAd-IFN/Syn3
- Betty Cell
- Elisel
- Robocell
- SRP-9001
- EB-101
- Prostatak
- D-Fi
- CG0070
- Vigil-EWS
- Engensis
- VGX-3100
- Invossa (TG-C)
- Visuvecto
- PF-06939926
- PF06838435
- PF-07055480
- SPK-8011
- AMT-061
- VB-111
- Genex
- ADXS-HPV
- AGTC501
- LYS-SAF302
- NFS-01
- AG0302-COVID19
- RGX-314
- Hologen5
第15章 專利分析
第16章 併購
第17章 融資與投資
第18章 臨床試驗分析
第19章成本分析
第20章 創業評估
第21章 各大藥企的舉措
第22章需求分析
第23章市場影響分析:推動因素、阻礙因素、機會、挑戰
第24章 全球基因治療市場
第 25 章 基因治療市場(依治療領域)
第26章基因治療市場,依載體類型
第27章基因治療市場,依治療類型
第28章基因治療市場,依基因傳遞方法
第29章基因治療市場,依管理途徑
第30章基因治療市場,依地區
第31章基因治療市場,依主要公司劃分
第32章 基因治療市場、治療藥物銷售預測
第33章基因治療市場:新興技術
第34章基因治療載體的製造
第35章案例研究:基因治療供應鏈
第36章高階主管洞察
第37章 結論
第38章 附錄一:表格數據
第39章 附錄二:公司與組織名單
GENE THERAPY MARKET: OVERVIEW
As per Roots Analysis, the global gene therapy market is estimated to grow from USD 2.4 billion in the current year to USD 16.5 billion by 2035, at a CAGR of 19.25% during the forecast period, till 2035.
The market sizing and opportunity analysis has been segmented across the following parameters:
Therapeutic Area
- Cardiovascular Disorders
- Dermatological Disorders
- Genetic Disorders
- Hematological Disorders
- Metabolic Disorders
- Muscle Disorders
- Oncological Disorders
- Ophthalmic Disorders
- Other Disorders
Type of Vector
- Adeno-associated Virus Vectors
- Adenovirus Vectors
- Herpes Simplex Virus Vectors
- Lentivirus Vectors
- Non-viral Vectors
- Retrovirus Vectors
- Other Viral Vectors
Type of Therapy
- Gene Augmentation
- Gene Editing
- Gene Regulation
- Oncolytic Immunotherapies
- Other Therapies
Type of Gene Delivery Method
- Ex vivo Gene Delivery
- In vivo Gene Delivery
Route of Administration
- Intramuscular Route
- Intratumoral Route
- Intravenous Route
- Subretinal Route
- Other Routes of Administration
Key Geographical Regions
- North America
- Europe
- Asia-Pacific
- Latin America
- Rest of the World
GENE THERAPY MARKET: GROWTH AND TRENDS
Congenital abnormalities and inherited genetic mutations encompass a diverse range of disorders, including oncological disorders, genetic disorders, autoimmune disorders and neurological disorders. According to the World Health Organization (WHO), genetic disorders affect 10 out of every 1,000 individuals, resulting in over 70 million people living with these conditions globally. Notably, more than 40% of infant mortality worldwide is linked to various genetic disorders. At present, several research initiatives are underway to develop safe and effective methods to selectively correct (the mutated, disease-causing) genes of individual patients. Of these, gene therapies have emerged as a promising option. These therapies are designed to target the underlying genetic cause of a disease, either by introducing a healthy version of the mutated gene or by disabling the functions of genes that cause the disease within the body. It is worth highlighting that over 1,100 clinical trials related to gene therapies have been registered in the past few years, indicating substantial research activity. Additionally, as per the USFDA, 10 to 20 therapies are expected to gain market access, each year, till 2025. Driven by the collaborative efforts of gene therapy companies and an increasing preference for effective single-dose treatments, the gene therapy market is set to experience significant growth during the forecast period.
GENE THERAPY MARKET: KEY INSIGHTS
The report delves into the current state of the gene therapy market and identifies potential growth opportunities within the industry. Some key findings from the report include:
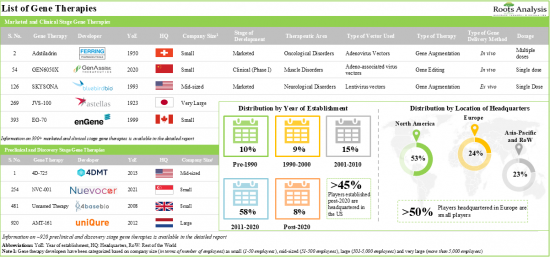
1. Presently, 345 developers, worldwide, are engaged in the development of gene therapies targeting various disorders; of these, more than 50% of the stakeholders are headquartered in the US, alone.
2. 70% of the gene therapies being evaluated in phase III clinical trials are gene augmentation therapies; it is worth noting that more than 35% of the candidates have received fast track designation.
3. Close to 95% of the preclinical stage gene therapies are in vivo therapies; more than 20% of the gene therapy candidates are being developed for the treatment of neurological disorders.
4. Over the years, the intellectual capital related to gene therapies has grown at a commendable pace; several patents have been filed by both industry stakeholders and academic players.
5. Over 500 patents focused on gene editing have been filed in the past five years; till date, 6% of such patents have been granted.
6. Rising interest of the stakeholders in this domain is reflected by the number of mergers and acquisitions reported over the last few years; 26% of these initiatives were focused on gaining access to novel platforms.
7. Foreseeing lucrative opportunities, many public and private investors have made investments worth USD 36.4 billion, across more than 560 funding instances.
8. In the recent past, more than 18,000 patients have been enrolled in clinical trials focused on gene therapies; close to 45% trials are evaluating gene therapies for the treatment of oncological disorders.
9. Start-ups are spearheading the innovation in the gene therapy domain; the valuation of a start-up is not solely dependent on profits, instead, it depends on experience and amount previously invested by industry stakeholders.
10. In order to tap into the lucrative opportunity associated with gene therapies, big pharma players have adopted various approaches, from proprietary product development to strategic investments, to advance their portfolios.
11. Given the growing incidence of inherited disorders, the demand for gene therapies (in terms of number of patients) has risen; by 2035, it is anticipated to grow at an annualized rate of 11.67%, across various geographies.
12. Owing to the growing interest towards personalized medicines and high specificity, the market for gene therapies is expected to rise steadily in the foreseeable future.
13. The gene therapy market is anticipated to grow at an annualized rate (CAGR) of 19.25%, till 2035; North America is expected to capture the majority share (close to 65%) of the market by 2035.
GENE THERAPY MARKET: KEY SEGMENTS
Currently, Muscle Disorders Segment Occupies the Largest Share of the Gene Therapy Market
Based on the therapeutic area, the market is segmented into cardiovascular disorders, dermatological disorders, genetic disorders, hematological disorders, metabolic disorders, muscle disorders, oncological diseases, ophthalmic disorders and other disorders. At present, muscle disorders segment holds the maximum share of the gene therapy market. This can be attributed to the growing prevalence of muscle disorders and proven efficacy of gene therapies in treating such conditions.
Adeno-Associated Virus (AAV) Vector-Based Gene Therapies is Likely to Dominate the Gene Therapies Market During the Forecast Period
Based on the type of vector, the market is segmented into adeno-associated virus vectors, adenovirus vectors, herpes simplex virus vectors, lentivirus vectors, non-viral vectors, retrovirus vectors and other viral vectors. At present, AAV vector-based gene therapies holds the maximum share within the gene therapies market. It is worth highlighting that, owing to the numerous advantages of AAV vector, such as high target specificity, greater efficacy and infectivity, AAV vector-based gene therapies are likely to capture larger share in the coming decade.
Currently, Gene Augmentation Segment Occupies the Largest Share of the Gene Therapies Market
Based on the type of therapy, the market is segmented into gene augmentation, gene editing, gene regulation, oncolytic immunotherapies and other therapies. Owing to their ability to deliver therapeutic genes to the patient's genome, fewer side effects and precisely correcting the genomic mutations, the gene therapy market is currently dominated by gene augmentation therapies. This trend is likely to remain the same in the mid-to-long term.
In Vivo Gene Delivery Method is Likely to Dominate the Gene Therapies Market During the Forecast Period
Based on the type of gene delivery method, the market is segmented into ex vivo and in vivo gene delivery methods. It is worth highlighting that, at present, in vivo gene delivery method holds a larger share of the gene therapy market. This trend is likely to remain the same in the coming decade.
Intravenous Route of Administration is Likely to Dominate the Gene Therapy Market During the Forecast Period
Based on the route of administration, the market is segmented into intramuscular, intratumoral, intravenous, subretinal and other routes of administration. It is worth highlighting that majority of the current gene therapy market is captured by the intravenous route of administration and this trend is unlikely to change in mid-long term. This can be attributed to the fact that gene therapies allow widespread distribution of the gene-carrying therapeutic vector to multiple target organs. In addition, intravenous administration is easier to administer and minimally invasive compared to other methods like intralesional or intratumoral injection.
North America Accounts for the Largest Share of the Market
Based on the key geographical regions, the market is segmented into North America, Europe, Asia-Pacific, Latin America and Rest of the World. Majority share is expected to be captured by drug developers based in North America. It is worth highlighting that, over the years, the market for Europe is expected to grow at a higher CAGR.
Example Players in the Gene Therapy Market
- Amgen
- Artgen Biotech
- BioMarin Pharmaceutical
- bluebird bio
- CRISPR Therapeutics
- CSL Behring
- Ferring Pharmaceuticals
- Kolon TissueGene
- Krystal Biotech
- Novartis
- Orchard Therapeutics
- Pfizer
- PTC Therapeutics
- Sarepta Therapeutics
- Shanghai Sunway Biotech
- Sibiono GeneTech
- Spark Therapeutics
Primary Research Overview
The opinions and insights presented in this study were influenced by discussions conducted with multiple stakeholders. The research report features detailed transcripts of interviews held with the following industry stakeholders:
- Former Corporate Communications Manager, Orchard Therapeutics
- Co-Founder and Chief Executive Officer, Vivet Therapeutics
- Chief Executive Officer, Chairman and President, Kubota Pharmaceutical
- Former Chief Executive Officer and President, Eyevensys
- Former Chief Executive Officer and President, AGTC
- Former Chief Business Officer, LogicBio Therapeutics
- Founder and Chief Executive Officer, AAVogen
- Chief Executive Officer, Hemera Biosciences
- Ex Co-Founder, Chief Executive Officer and President, Myonexus Therapeutics
- Former Chief Executive Officer, Arthrogen
- Project Manager and Tatjana Buchholz, Former Marketing Manager, PlasmidFactory
- Former Executive and Scientific Director, Delphi Genetics
- Former Chief Commercial Officer, Vigene Biosciences
- Chief Executive Officer and Chairman, Gene Biotherapeutics
- Chief Executive Officer, Milo Biotechnology
GENE THERAPY MARKET: RESEARCH COVERAGE
- Market Sizing and Opportunity Analysis: The report features an in-depth analysis of the gene therapy market, focusing on key market segments, including [A] therapeutic area, [B] type of vector, [C] type of therapy, [D] type of gene delivery method, [E] route of administration, [F] geographical regions and [H] leading players.
- Market Landscape (Gene Therapies): A comprehensive evaluation of marketed and clinical stage gene therapies, considering various parameters, such as [A] stage of development, [B] drug designations, [C] therapeutic area, [D] target gene, [E] type of vector used, [F] type of therapy, [G] type of gene delivery method, [H] route of administration and [I] dosing frequency. The chapter also provides a detailed analysis of the current landscape of discovery and preclinical stage gene therapies based on parameters, such as [J] stage of development, [K] therapeutic area, [L] target gene, [M] type of vector used, [N] type of therapy and [O] type of gene delivery method.
- Market Landscape (Gene Therapy Developers): A comprehensive evaluation of gene therapy developers, considering various parameters, such as [A] year of establishment, [B] company size (in terms of number of employees), [C] location of headquarters and [D] most active players (in terms of the number of gene therapies developed).
- Company Profiles: In-depth profiles of key industry players engaged in the development of gene therapies, focusing on [A] company overviews, [B] financial information (if available), [C] gene therapy portfolio, [D] recent developments and [E] an informed future outlook.
- Drug Profiles: In-depth profiles of marketed and late stage (phase II / III and above) gene therapies, along with information on the [A] development timeline of the therapy, [B] mechanism of action, [C] type of vector used, [D] dosage and manufacturing details, [E] target indication, as well as [F] details related to the developer company.
- Commercialization Strategy: An elaborate discussion on the various commercialization strategies that have been adopted by drug developers engaged in the gene therapy domain across different stages of therapy development, including prior to drug launch, at / during drug launch and post-marketing stage.
- Patent Analysis: Detailed analysis of various patents filed / granted related to gene therapies and gene editing therapies based on [A] type of patent, [B] publication year, [C] regional applicability, [D] CPC symbols, [E] emerging focus areas, [F] leading industry players (in terms of the number of patents filed / granted), and [G] patent valuation. It also includes a [H] patent benchmarking analysis and [I] a detailed valuation analysis.
- Merger and Acquisitions: A comprehensive examination of the various mergers and acquisitions, focusing on multiple relevant parameters, including [A] year of agreement, [B] type of deal, [C] geographical location of the companies involved, [D] key value drivers, [E] highest phase of development of the acquired company' product, [F] target therapeutic area and [G] deal multiples.
- Funding and Investment Analysis: A detailed evaluation of the investments made in the gene therapy domain, encompassing seed financing, venture capital financing, IPOs, secondary offerings, debt financing, grants and other equity offerings.
- Clinical Trial Analysis: Examination of completed, ongoing, and planned clinical studies of various gene therapies, based on parameters, such as [A] trial registration year, [B] trial status, [C] trial phase, [D] target therapeutic area, [E] geography, [F] type of sponsor, [G] prominent treatment sites and [H] enrolled patient population.
- Pricing Analysis: An analysis of the various factors that are likely to influence the pricing of gene therapies, featuring different models / approaches that may be adopted by developers / manufacturers to decide the prices of these therapies.
- Start-up Valuation Analysis: An analysis of the startup companies engaged in this domain (since 2017) based on year of experience.
- Big Pharma Analysis: A comprehensive examination of various gene therapy-based initiatives undertaken by major pharmaceutical companies, based on several relevant parameters, such as [A] therapeutic area, [B] type of vector used, [C] type of therapy and [D] type of gene delivery method used. In addition, it includes a detailed benchmarking analysis across key parameters, such as [E] number of gene therapies under development, [F] funding information, [G] partnership activity and [H] patent portfolio strength.
- Demand Analysis: Informed estimates of the annual commercial and clinical demand for gene therapies based on several relevant parameters, such as [A] target patient population, [B] dosing frequency and [C] dose strength.
- Additional Insight 1: A review of the various emerging technologies and therapy development platforms that are being used to manufacture gene therapies, featuring detailed profiles of technologies that are being used for the development of gene therapies.
- Additional Insight 2: A case study examining the current and emerging trends in vector manufacturing, along with details on companies that provide contract services for producing viral vectors utilized in gene therapy products. The analysis also includes an in-depth discussion of the manufacturing processes associated with different types of vectors.
- Additional Insight 3: Assessment of the supply chain model adopted by gene therapy developers highlighting the stakeholders involved, factors affecting the supply of therapeutic products and challenges encountered by developers across the different stages of the gene therapy supply chain.
- Market Impact Analysis: The report analyzes various factors such as drivers, restraints, opportunities, and challenges affecting the market growth.
KEY QUESTIONS ANSWERED IN THIS REPORT
- How many companies are currently engaged in this market?
- Which are the leading companies in this market?
- What is the annual demand for gene therapies?
- What factors are likely to influence the evolution of this market?
- What is the current and future market size?
- What is the CAGR of this market?
- How is the current and future market opportunity likely to be distributed across key market segments?
REASONS TO BUY THIS REPORT
- The report provides a comprehensive market analysis, offering detailed revenue projections of the overall market and its specific sub-segments. This information is valuable to both established market leaders and emerging entrants.
- Stakeholders can leverage the report to gain a deeper understanding of the competitive dynamics within the market. By analyzing the competitive landscape, businesses can make informed decisions to optimize their market positioning and develop effective go-to-market strategies.
- The report offers stakeholders a comprehensive overview of the market, including key drivers, barriers, opportunities, and challenges. This information empowers stakeholders to stay abreast of market trends and make data-driven decisions to capitalize on growth prospects.
ADDITIONAL BENEFITS
- Complimentary PPT Insights Packs
- Complimentary Excel Data Packs for all Analytical Modules in the Report
- 10% Free Content Customization
- Detailed Report Walkthrough Session with Research Team
- Free Updated report if the report is 6-12 months old or older
TABLE OF CONTENTS
1. PREFACE
- 1.1. Introduction
- 1.2. Market Share Insights
- 1.3. Key Market Insights
- 1.4. Report Coverage
- 1.5. Key Questions Answered
- 1.6. Chapter Outlines
2. RESEARCH METHODOLOGY
- 2.1. Chapter Overview
- 2.2. Research Assumptions
- 2.2.1. Market Landscape and Market Trends
- 2.2.2. Market Forecast and Opportunity Analysis
- 2.2.3. Comparative Analysis
- 2.3. Database Building
- 2.3.1. Data Collection
- 2.3.2. Data Validation
- 2.3.3. Data Analysis
- 2.4. Project Methodology
- 2.4.1. Secondary Research
- 2.4.1.1. Annual Reports
- 2.4.1.2. Academic Research Papers
- 2.4.1.3. Company Websites
- 2.4.1.4. Investor Presentations
- 2.4.1.5. Regulatory Filings
- 2.4.1.6. White Papers
- 2.4.1.7. Industry Publications
- 2.4.1.8. Conferences and Seminars
- 2.4.1.9. Government Portals
- 2.4.1.10. Media and Press Releases
- 2.4.1.11. Newsletters
- 2.4.1.12. Industry Databases
- 2.4.1.13. Roots Proprietary Databases
- 2.4.1.14. Paid Databases and Sources
- 2.4.1.15. Social Media Portals
- 2.4.1.16. Other Secondary Sources
- 2.4.2. Primary Research
- 2.4.2.1. Types of Primary Research
- 2.4.2.1.1. Qualitative Research
- 2.4.2.1.2. Quantitative Research
- 2.4.2.1.3. Hybrid Approach
- 2.4.2.2. Advantages of Primary Research
- 2.4.2.3. Techniques for Primary Research
- 2.4.2.3.1. Interviews
- 2.4.2.3.2. Surveys
- 2.4.2.3.3. Focus Groups
- 2.4.2.3.4. Observational Research
- 2.4.2.3.5. Social Media Interactions
- 2.4.2.4. Key Opinion Leaders Considered in Primary Research
- 2.4.2.4.1. Company Executives (CXOs)
- 2.4.2.4.2. Board of Directors
- 2.4.2.4.3. Company Presidents and Vice Presidents
- 2.4.2.4.4. Research and Development Heads
- 2.4.2.4.5. Technical Experts
- 2.4.2.4.6. Subject Matter Experts
- 2.4.2.4.7. Scientists
- 2.4.2.4.8. Doctors and Other Healthcare Providers
- 2.4.2.5. Ethics and Integrity
- 2.4.2.5.1. Research Ethics
- 2.4.2.5.2. Data Integrity
- 2.4.2.1. Types of Primary Research
- 2.4.3. Analytical Tools and Databases
- 2.4.1. Secondary Research
3. MARKET DYNAMICS
- 3.1. Chapter Overview
- 3.2. Forecast Methodology
- 3.2.1. Top-down Approach
- 3.2.2. Bottom-up Approach
- 3.2.3. Hybrid Approach
- 3.3. Market Assessment Framework
- 3.3.1. Total Addressable Market (TAM)
- 3.3.2. Serviceable Addressable Market (SAM)
- 3.3.3. Serviceable Obtainable Market (SOM)
- 3.3.4. Currently Acquired Market (CAM)
- 3.4. Forecasting Tools and Techniques
- 3.4.1. Qualitative Forecasting
- 3.4.2. Correlation
- 3.4.3. Regression
- 3.4.4. Extrapolation
- 3.4.5. Convergence
- 3.4.6. Sensitivity Analysis
- 3.4.7. Scenario Planning
- 3.4.8. Data Visualization
- 3.4.9. Time Series Analysis
- 3.4.10. Forecast Error Analysis
- 3.5. Key Considerations
- 3.5.1. Demographics
- 3.5.2. Government Regulations
- 3.5.3. Reimbursement Scenarios
- 3.5.4. Market Access
- 3.5.5. Supply Chain
- 3.5.6. Industry Consolidation
- 3.5.7. Pandemic / Unforeseen Disruptions Impact
- 3.6. Key Market Segmentation
- 3.7. Robust Quality Control
- 3.8. Limitations
4. ECONOMIC CONSIDERATONS
- 4.1. Chapter Overview
- 4.2. Market Dynamics
- 4.2.1. Time Period
- 4.2.1.1. Historical Trends
- 4.2.1.2. Current and Forecasted Estimates
- 4.2.2. Currency Coverage
- 4.2.2.1. Overview of Major Currencies Affecting the Market
- 4.2.2.2. Impact of Currency Fluctuations on the Industry
- 4.2.3. Foreign Exchange Impact
- 4.2.3.1. Evaluation of Foreign Exchange Rates and Their Impact on Market
- 4.2.3.2. Strategies for Mitigating Foreign Exchange Risk
- 4.2.4. Recession
- 4.2.4.1. Historical Analysis of Past Recessions and Lessons Learnt
- 4.2.4.2. Assessment of Current Economic Conditions and Potential Impact on the Market
- 4.2.5. Inflation
- 4.2.5.1. Measurement and Analysis of Inflationary Pressures in the Economy
- 4.2.5.2. Potential Impact of Inflation on the Market Evolution
- 4.2.1. Time Period
5. EXECUTIVE SUMMARY
6. INTRODUCTION
- 6.1. Chapter Overview
- 6.2. Evolution of Gene Therapies
- 6.3. Classification of Gene Therapies
- 6.3.1. Based on Source of Origin
- 6.3.2. Based on Method of Delivery
- 6.3.2.1. Ex vivo Gene Therapies
- 6.3.2.2. In vivo Gene Therapies
- 6.4. Routes of Administration
- 6.5. Mechanism of Action of Gene Therapies
- 6.6. Advantages and Disadvantages of Gene Therapies
- 6.7. Challenges associated with Gene Therapies
- 6.7.1. Ethical and Social Challenges
- 6.7.2. Therapy Development Challenges
- 6.7.3. Manufacturing Challenges
- 6.7.4. Commercial Viability Challenges
- 6.8. Introduction to Genome Editing
- 6.8.1. Evolution of Genome Editing
- 6.8.2. Applications of Genome Editing
- 6.8.3. Types of Genome Editing Techniques
- 6.9. Concluding Remarks
7. GENE DELIVERY VECTORS
- 7.1. Chapter Overview
- 7.2. Methods of Gene Transfer
- 7.3. Viral Vectors for Genetically Modified Therapies
- 7.3.1. Types of Viral Vectors
- 7.3.1.1. Adeno-associated Viral Vectors
- 7.3.1.2. Adenoviral Vectors
- 7.3.1.3. Lentiviral Vectors
- 7.3.1.4. Retroviral Vectors
- 7.3.1.5. Other Viral Vectors
- 7.3.1. Types of Viral Vectors
- 7.4. Non-Viral Vectors for Genetically Modified Therapies
- 7.4.1. Types of Non-Viral Vectors
- 7.4.1.1. Plasmid DNA
- 7.4.1.2. Liposomes, Lipoplexes and Polyplexes
- 7.4.1.3. Oligonucleotides
- 7.4.1.4. Nanoparticles
- 7.4.1.5. Hybrid System Vectors
- 7.4.1.6. Other Non-Viral Vectors
- 7.4.2. Gene Delivery using Non-Viral Vectors
- 7.4.2.1. Biolistic Methods
- 7.4.2.2. Electroporation
- 7.4.2.3. Receptor Mediated Gene Delivery
- 7.4.2.4. Gene Activated matrix (GAM)
- 7.4.1. Types of Non-Viral Vectors
8. REGULATORY LANDSCAPE AND REIMBURSEMENT SCENARIOS
- 8.1. Chapter Overview
- 8.2. Regulatory Guidelines in North America
- 8.2.1. The US Scenario
- 8.2.2. Canadian Scenario
- 8.3. Regulatory Guidelines in Europe
- 8.3.1. Quality Documentation for Gene Therapy Products
- 8.3.2. Non-Clinical Development
- 8.3.3. Clinical Development
- 8.4. Regulatory Guidelines in Asia-Pacific
- 8.4.1. Chinese Scenario
- 8.4.1.1. Construction of DNA Expression Cassette and Gene Delivery Systems
- 8.4.1.2. Generation and Characterization of Cell Banks and Engineered Bacteria Banks
- 8.4.1.2.1. Cell Bank
- 8.4.1.2.2. Bacterial Cell Bank
- 8.4.1.3. Manufacturing of Gene Therapy Products
- 8.4.1.4. Quality Control
- 8.4.1.5. Evaluation of Efficacy of Gene Therapy Products
- 8.4.1.6. Evaluation of Safety of Gene Therapy Products
- 8.4.1.7. Clinical Trial of Gene Therapy Products
- 8.4.1.8. Ethics Study
- 8.4.2. Japanese Scenario
- 8.4.3. South Korean Scenario
- 8.4.4. Australian Scenario
- 8.4.5. Hong Kong Scenario
- 8.4.1. Chinese Scenario
- 8.5. Reimbursement Scenario
- 8.5.1. Challenges Related to Reimbursement
- 8.6. Concluding Remarks and Future Outlook
9. MARKET LANDSCAPE
- 9.1. Chapter Overview
- 9.2. Marketed and Clinical Stage Gene Therapies: Market Landscape
- 9.2.1. Analysis by Stage of Development
- 9.2.2. Analysis by Drug Designation
- 9.2.3. Analysis by Therapeutic Area
- 9.2.4. Analysis by Target Gene
- 9.2.5. Analysis by Type of Vector Used
- 9.2.6. Analysis by Type of Therapy
- 9.2.7. Analysis by Type of Gene Delivery Method
- 9.2.8. Analysis by Route of Administration
- 9.2.9. Analysis by Dosing Frequency
- 9.3. Preclinical and Discovery Stage Gene Therapies: Market Landscape
- 9.3.1. Analysis by Stage of Development
- 9.3.2. Analysis by Therapeutic Area
- 9.3.3. Analysis by Target Gene
- 9.3.4. Analysis by Type of Vector Used
- 9.3.5. Analysis by Type of Therapy
- 9.3.6. Analysis by Type of Gene Delivery Method
10. DEVELOPER LANDSCAPE
- 10.1. Chapter Overview
- 10.2. Gene Therapy: Competitive Landscape
- 10.2.1. Analysis by Year of Establishment
- 10.2.2. Analysis by Company Size
- 10.2.3. Analysis by Location of Headquarters
- 10.2.4. Most Active Players: Analysis by Number of Gene Therapies Developed
11. COMPANY PROFILES
- 11.1. Chapter Overview
- 11.2. Gene Therapy Developers in North America
- 11.2.1. Amgen
- 11.2.1.1. Company Overview
- 11.2.1.2. Gene Therapy Portfolio
- 11.2.1.3. Recent Developments and Future Outlook
- 11.2.2. BioMarin Pharmaceutical
- 11.2.2.1. Company Overview
- 11.2.2.2. Gene Therapy Portfolio
- 11.2.2.3. Recent Developments and Future Outlook
- 11.2.3. bluebird bio
- 11.2.3.1. Company Overview
- 11.2.3.2. Gene Therapy Portfolio
- 11.2.3.3. Recent Developments and Future Outlook
- 11.2.4. CRISPR Therapeutics
- 11.2.4.1. Company Overview
- 11.2.4.2. Gene Therapy Portfolio
- 11.2.4.3. Recent Developments and Future Outlook
- 11.2.5. Kolon TissueGene
- 11.2.5.1. Company Overview
- 11.2.5.2. Gene Therapy Portfolio
- 11.2.5.3. Recent Developments and Future Outlook
- 11.2.6. Krystal Biotech
- 11.2.6.1. Company Overview
- 11.2.6.2. Gene Therapy Portfolio
- 11.2.6.3. Recent Developments and Future Outlook
- 11.2.7. Pfizer
- 11.2.7.1. Company Overview
- 11.2.7.2. Gene Therapy Portfolio
- 11.2.7.3. Recent Developments and Future Outlook
- 11.2.8. PTC Therapeutics
- 11.2.8.1. Company Overview
- 11.2.8.2. Gene Therapy Portfolio
- 11.2.8.3. Recent Developments and Future Outlook
- 11.2.9. Sarepta Therapeutics
- 11.2.9.1. Company Overview
- 11.2.9.2. Gene Therapy Portfolio
- 11.2.9.3. Recent Developments and Future Outlook
- 11.2.10. Spark Therapeutics
- 11.2.10.1. Company Overview
- 11.2.10.2. Gene Therapy Portfolio
- 11.2.10.3. Recent Developments and Future Outlook
- 11.2.1. Amgen
- 11.3. Gene Therapy Developers in Europe
- 11.3.1. Artgen Biotech
- 11.3.1.1. Company Overview
- 11.3.1.2. Gene Therapy Portfolio
- 11.3.1.3. Recent Developments and Future Outlook
- 11.3.2. Ferring Pharmaceuticals
- 11.3.2.1. Company Overview
- 11.3.2.2. Gene Therapy Portfolio
- 11.3.2.3. Recent Developments and Future Outlook
- 11.3.3. Novartis
- 11.3.3.1. Company Overview
- 11.3.3.2. Gene Therapy Portfolio
- 11.3.3.3. Recent Developments and Future Outlook
- 11.3.4. Orchard Therapeutics
- 11.3.4.1. Company Overview
- 11.3.4.2. Gene Therapy Portfolio
- 11.3.4.3. Recent Developments and Future Outlook
- 11.3.1. Artgen Biotech
- 11.4. Gene Therapy Developers in Asia-Pacific and Rest of the World
- 11.4.1. CSL Behring
- 11.4.1.1. Company Overview
- 11.4.1.2. Gene Therapy Portfolio
- 11.4.1.3. Recent Developments and Future Outlook
- 11.4.2. Shanghai Sunway Biotech
- 11.4.2.1. Company Overview
- 11.4.2.2. Gene Therapy Portfolio
- 11.4.2.3. Recent Developments and Future Outlook
- 11.4.3. Sibiono GeneTech
- 11.4.3.1. Company Overview
- 11.4.3.2. Gene Therapy Portfolio
- 11.4.3.3. Recent Developments and Future Outlook
- 11.4.1. CSL Behring
12. MARKETED GENE THERAPIES
- 12.1. Chapter Overview
- 12.2. Gendicine(R) (Shenzhen Sibiono GeneTech)
- 12.2.1. Company Overview
- 12.2.2. Development Timeline
- 12.2.3. Mechanism of Action and Vector Used
- 12.2.4. Target Indication
- 12.2.5. Current Stage of Development
- 12.2.6. Manufacturing, Dosage and Sales
- 12.3. Oncorine(R) (Shanghai Sunway Biotech)
- 12.3.1. Company Overview
- 12.3.2. Development Timeline
- 12.3.3. Mechanism of Action and Vector Used
- 12.3.4. Target Indication
- 12.3.5. Current Stage of Development
- 12.3.6. Manufacturing, Dosage and Sales
- 12.4. Rexin-G(R) (Epeius Biotechnologies)
- 12.4.1. Company Overview
- 12.4.2. Development Timeline
- 12.4.3. Mechanism of Action and Vector Used
- 12.4.4. Target Indication
- 12.4.5. Current Stage of Development
- 12.4.6. Manufacturing, Dosage and Sales
- 12.5. Neovasculgen(R) (Human Stem Cells Institute)
- 12.5.1. Company Overview
- 12.5.2. Development Timeline
- 12.5.3. Mechanism of Action and Vector Used
- 12.5.4. Target Indication
- 12.5.5. Current Stage of Development
- 12.5.6. Manufacturing, Dosage and Sales
- 12.6. Imlygic(R) (Amgen)
- 12.6.1. Company Overview
- 12.6.2. Development Timeline
- 12.6.3. Mechanism of Action and Vector Used
- 12.6.4. Target Indication
- 12.6.5. Current Stage of Development
- 12.6.6. Manufacturing, Dosage and Sales
- 12.7. Strimvelis(R) (Orchard Therapeutics)
- 12.7.1. Company Overview
- 12.7.2. Development Timeline
- 12.7.3. Mechanism of Action and Vector Used
- 12.7.4. Target Indication
- 12.7.5. Current Stage of Development
- 12.7.6. Manufacturing, Dosage and Sales
- 12.8. Luxturna(TM) (Spark Therapeutics)
- 12.8.1. Company Overview
- 12.8.2. Development Timeline
- 12.8.3. Mechanism of Action and Vector Used
- 12.8.4. Target Indication
- 12.8.5. Current Stage of Development
- 12.8.6. Manufacturing, Dosage and Sales
- 12.9. Zolgensa(TM) (Novartis)
- 12.9.1. Company Overview
- 12.9.2. Development Timeline
- 12.9.3. Mechanism of Action and Vector Used
- 12.9.4. Target Indication
- 12.9.5. Current Stage of Development
- 12.9.6. Manufacturing, Dosage and Sales
- 12.10. Collategene(R) (AnGes)
- 12.10.1. Company Overview
- 12.10.2. Development Timeline
- 12.10.3. Mechanism of Action and Vector Used
- 12.10.4. Target Indication
- 12.10.5. Current Stage of Development
- 12.10.6. Manufacturing, Dosage and Sales
- 12.11. Zyntelgo(TM) (bluebird bio)
- 12.11.1. Company Overview
- 12.11.2. Development Timeline
- 12.11.3. Mechanism of Action and Vector Used
- 12.11.4. Target Indication
- 12.11.5. Current Stage of Development
- 12.11.6. Manufacturing, Dosage and Sales
- 12.12. Libmeldy(TM) (Orchard Therapeutics)
- 12.12.1. Company Overview
- 12.12.2. Development Timeline
- 12.12.3. Mechanism of Action and Vector Used
- 12.12.4. Target Indication
- 12.12.5. Current Stage of Development
- 12.12.6. Manufacturing, Dosage and Sales
13. KEY COMMERCIALIZATION STRATEGIES
- 13.1. Chapter Overview
- 13.2. Successful Drug Launch Strategy: ROOTS Framework
- 13.3. Successful Drug Launch Strategy: Product Differentiation
- 13.4. Commonly Adopted Commercialization Strategies based on Phase of Development
- 13.5. List of Approved Gene Therapies
- 13.6. Key Commercialization Strategies Adopted by Gene Therapy Developers
- 13.6.1. Strategies Adopted before Therapy Approval
- 13.6.1.1. Participation in Global Events
- 13.6.1.2. Collaborations with Stakeholders and Pharmaceutical Firms
- 13.6.1.3. Indication Expansion
- 13.6.2. Strategies adopted During / Post Therapy Approval
- 13.6.2.1. Geographical Expansion
- 13.6.2.2. Participation in Global Events
- 13.6.2.3. Patient Assistance Programs
- 13.6.2.4. Awareness through Product Websites
- 13.6.2.5. Collaboration with Stakeholders and Pharmaceutical Firms
- 13.6.1. Strategies Adopted before Therapy Approval
- 13.7. Concluding Remarks
14. LATE-STAGE GENE THERAPIES
- 14.1. Chapter Overview
- 14.2. LUMEVOQ (GS010)
- 14.3. OTL-103
- 14.4. PTC-AADC
- 14.5. BMN 270
- 14.6. rAd-IFN/Syn3
- 14.7. beti-cel
- 14.8. eli-cel
- 14.9. lovo-cel
- 14.10. SRP-9001
- 14.11. EB-101
- 14.12. ProstAtak
- 14.13. D-Fi
- 14.14. CG0070
- 14.15. Vigil-EWS
- 14.16. Engensis
- 14.17. VGX-3100
- 14.18. INVOSSA (TG-C)
- 14.19. VYJUVEKT
- 14.20. PF-06939926
- 14.21. PF06838435
- 14.22. PF-07055480
- 14.23. SPK-8011
- 14.24. AMT-061
- 14.25. VB-111
- 14.26. Generx
- 14.27. ADXS-HPV
- 14.28. AGTC 501
- 14.29. LYS-SAF302
- 14.30. NFS-01
- 14.31. AG0302-COVID19
- 14.32. RGX-314
- 14.33. Hologene 5
15. PATENT ANALYSIS
- 15.1. Chapter Overview
- 15.2 Gene Therapy: Patent Analysis
- 15.2.1. Scope and Methodology
- 15.2.1.1. Analysis by Publication Year
- 15.2.1.2. Analysis by Publication Year and Type of Patent
- 15.2.1.3. Analysis by Geography
- 15.2.1.3.1. Analysis by Geography (North America)
- 15.2.1.3.2. Analysis by Geography (Europe)
- 15.2.1.3.3. Analysis by Geography (Asia-Pacific)
- 15.2.1.4. Analysis by CPC Symbols
- 15.2.1.5. Analysis by Emerging Focus Areas
- 15.2.1.6. Leading Players: Analysis by Number of Patents
- 15.2.1.7. Patent Benchmarking Analysis
- 15.2.1.7.1. Analysis by Patent Characteristics
- 15.2.1.7.1.1. Sanofi and Genethon
- 15.2.1.7.1.2. Other Leading Patent Assignees
- 15.2.1.7.1. Analysis by Patent Characteristics
- 15.2.1.8. Patent Valuation Analysis
- 15.2.1. Scope and Methodology
- 15.3. Gene Editing Market: Patent Analysis
- 15.3.1. Scope and Methodology
- 15.3.1.1. Analysis by Publication Year
- 15.3.1.2. Analysis by Publication Year and Type of Patent
- 15.3.1.3. Analysis by Geography
- 15.3.1.3.1. Analysis by Geography (North America)
- 15.3.1.3.2. Analysis by Geography (Europe)
- 15.3.1.3.3. Analysis by Geography (Asia-Pacific)
- 15.3.1.4. Analysis by CPC Symbols
- 15.3.1.5. Analysis by Emerging Focus Areas
- 15.3.1.6. Leading Players: Analysis by Number of Patents
- 15.3.1.7. Patent Benchmarking Analysis
- 15.3.1.7.1. Analysis by Patent Characteristics
- 15.3.1.7.1.1. Intellia Therapeutics and CRISPR Therapeutics
- 15.3.1.7.1.2. Other Leading Patent Assignees
- 15.3.1.7.1. Analysis by Patent Characteristics
- 15.3.1.8. Patent Valuation Analysis
- 15.3.1. Scope and Methodology
- 15.4. Overall Intellectual Property Portfolio: Analysis by Type of Organization
16. MERGERS AND ACQUISITIONS
- 16.1. Chapter Overview
- 16.2. Merger and Acquisition Models
- 16.3. Gene Therapy: Mergers and Acquisitions
- 16.3.1. Analysis by Year of Merger / Acquisition
- 16.3.2. Analysis by Type of Agreement
- 16.3.3. Analysis by Geography
- 16.3.3.1. Intercontinental and Intracontinental Deals
- 16.3.3.2. Local and International Deals
- 16.3.4. Analysis by Key Value Drivers
- 16.3.4.1. Analysis by Key Value Drivers and Year of Acquisition
- 16.3.5. Analysis by Stage of Development of the Acquired Company's Product
- 16.3.6. Analysis by Therapeutic Area
- 16.4. Analysis by Deal Multiples
17. FUNDING AND INVESTMENTS
- 17.1. Chapter Overview
- 17.2. Types of Funding
- 17.3. Gene Therapy: Funding and Investment Analysis
- 17.3.1. Analysis by Year of Funding
- 17.3.2. Analysis by Amount Invested
- 17.3.3. Analysis by Funding Instance and Amount Invested by Type of Funding
- 17.3.4. Analysis by Funding Instances and Amount Invested by Year and Type of Funding
- 17.3.5. Analysis by Funding Instances and Amount Invested by Type of Therapy
- 17.3.6. Analysis by Funding Instances and Amount Invested by Geography
- 17.3.7. Analysis by Funding Instances and Amount Invested by Highest Phase of Development
- 17.3.8. Analysis by Funding Instances by Therapeutic Area
- 17.3.9. Most Active Players: Analysis by Funding Instances and Amount Invested
- 17.3.10. Key Investors: Analysis by Number of Funding Instances
- 17.4. Concluding Remarks
18. CLINICAL TRIAL ANALYSIS
- 18.1. Chapter Overview
- 18.2. Scope and Methodology
- 18.3. Gene Therapy: Clinical Trial Analysis
- 18.3.1. Analysis by Trial Registration Year
- 18.3.2. Analysis by Trial Status
- 18.3.3. Analysis by Trial Phase
- 18.3.4. Analysis by Therapeutic Area
- 18.3.5. Analysis by Geography
- 18.3.6. Analysis by Trial Registration Year and Geography
- 18.3.7. Analysis by Trial Status and Geography
- 18.3.8. Analysis by Trial Status, Trial Phase and Geography
- 18.3.9. Analysis by Therapeutic Area and Geography
- 18.4. Analysis by Type of Sponsor / Collaborator
- 18.5. Analysis by Prominent Treatment Sites
- 18.6. Gene Therapy: Analysis of Enrolled Patient Population
- 18.6.1. Analysis by Trial Registration Year
- 18.6.2. Analysis by Trial Status
- 18.6.3. Analysis by Trial Phase
- 18.6.4. Analysis by Therapeutic Area
- 18.6.5. Analysis by Location of Trial Site
- 18.6.6. Analysis by Trial Status and Location of Trial Site
- 18.6.7. Analysis by Trial Status, Trial Phase and Location of Trial Site
- 18.6.8. Analysis by Therapeutic Area and Location of Trial Site
- 18.7. Concluding Remarks
19. COST PRICE ANALYSIS
- 19.1. Chapter Overview
- 19.2. Factors Contributing to the High Price of Gene Therapies
- 19.3. Gene Therapy Market: Price Models
- 19.3.1. Based on Associated Product / Component Costs
- 19.3.2. Based on Competition
- 19.3.3. Based on Patient Segment
- 19.3.4. Based Opinion of Industry Experts
20. START-UP VALUATION
- 20.1. Chapter Overview
- 20.2. Valuation by Years of Experience of Start-ups
- 20.2.1. Methodology
- 20.2.2. Results and Interpretation
21. BIG PHARMA INITIATIVES
- 21.1. Chapter Overview
- 21.2. Gene Therapy: List of Most Prominent Big Pharmaceutical Players
- 21.2.1. Analysis by Therapeutic Area
- 21.2.2. Analysis by Type of Vector Used
- 21.2.3. Analysis by Type of Therapy
- 21.2.4. Analysis by Type of Gene Delivery Method Used
- 21.3. Benchmarking Analysis of Key Parameters
- 21.3.1. Spider Web Analysis: Pipeline Strength
- 21.3.2. Spider Web Analysis: Mergers and Acquisitions
- 21.3.3. Spider Web Analysis: Funding and Investments
- 21.3.4. Spider Web Analysis: Clinical Trials
- 21.3.5. Spider Web Analysis: Technologies
- 21.3.6. Spider Web Analysis: Patents
- 21.4. Benchmarking Analysis of Big Pharmaceutical Players
- 21.4.1. Spider Web Analysis: Novartis
- 21.4.2. Spider Web Analysis: Takeda Pharmaceutical
- 21.4.3. Spider Web Analysis: Roche
- 21.4.4. Spider Web Analysis: Merck
- 21.4.5. Spider Web Analysis: Pfizer
- 21.4.6. Spider Web Analysis: Johnson & Johnson
- 21.4.7. Spider Web Analysis: AbbVie
- 21.4.8. Spider Web Analysis: Bristol Myers Squibb
- 21.4.9. Spider Web Analysis: AstraZeneca
- 21.4.10. Spider Web Analysis: Sanofi
22. DEMAND ANALYSIS
- 22.1. Chapter Overview
- 22.2. Assumptions and Methodology
- 22.3. Gene Therapy Market: Global Demand Analysis
- 22.3.1. Analysis by Stage of Development
- 22.3.2. Analysis by Therapeutic Area
- 22.3.3. Analysis by Type of Therapy
- 22.3.4. Analysis by Type of Gene Delivery Method
- 22.3.5. Analysis by Geography
23. MARKET IMPACT ANALYSIS: DRIVERS, RESTRAINTS, OPPORTUNITIES AND CHALLENGES
- 23.1. Chapter Overview
- 23.2. Market Drivers
- 23.3. Market Restraints
- 23.4. Market Opportunities
- 23.5. Market Challenges
- 23.6. Conclusion
24. GLOBAL GENE THERAPY MARKET
- 24.1. Chapter Overview
- 24.2. Key Assumptions and Methodology
- 24.3. Global Gene Therapy Market, till 2035
- 24.3.1. Scenario Analysis
- 24.3.1.1. Conservative Scenario
- 24.3.1.2. Optimistic Scenario
- 24.3.1. Scenario Analysis
- 24.4. Key Market Segmentations
25. GENE THERAPIES MARKET, BY THERAPEUTIC AREA
- 25.1. Chapter Overview
- 25.2. Key Assumptions and Methodology
- 25.3. Gene Therapy Market: Distribution by Therapeutic Area, 2024, 2029 and 2035
- 25.3.1. Gene Therapy Market for Muscle Disorders, till 2035
- 25.3.2. Gene Therapy Market for Hematological Disorders, till 2035
- 25.3.3. Gene Therapy Market for Dermatological Disorders, till 2035
- 25.3.4. Gene Therapy Market for Oncological Disorders, till 2035
- 25.3.5. Gene Therapy Market for Genetic Disorders, till 2035
- 25.3.6. Gene Therapy Market for Ophthalmic Disorders, till 2035
- 25.3.7. Gene Therapy Market for Metabolic Disorders, till 2035
- 25.3.8. Gene Therapy Market for Cardiovascular Disorders, till 2035
- 25.3.9. Gene Therapy Market for Other Disorders, till 2035
- 25.4. Data Triangulation and Validation
26. GENE THERAPIES MARKET, BY TYPE OF VECTOR
- 26.1. Chapter Overview
- 26.2. Key Assumptions and Methodology
- 26.3. Gene Therapy Market: Distribution by Type of Vector, 2024, 2029 and 2035
- 26.3.1. Gene Therapy Market for Adeno-associated Virus Vectors, till 2035
- 26.3.2. Gene Therapy Market for Herpes Simplex Virus Vectors, till 2035
- 26.3.3. Gene Therapy Market for Lentivirus Vectors, till 2035
- 26.3.4. Gene Therapy Market for Adenovirus Vectors, till 2035
- 26.3.5. Gene Therapy Market for Non-viral Vectors, till 2035
- 26.3.6. Gene Therapy Market for Retrovirus Vectors, till 2035
- 26.3.7. Gene Therapy Market for Other Viral Vectors, till 2035
- 26.4. Data Triangulation and Validation
27. GENE THERAPIES MARKET, BY TYPE OF THERAPY
- 27.1. Chapter Overview
- 27.2. Key Assumptions and Methodology
- 27.3. Gene Therapy Market: Distribution by Type of Therapy, 2024, 2029 and 2035
- 27.3.1. Gene Therapy Market for Gene Augmentation, till 2035
- 27.3.2. Gene Therapy Market for Oncolytic Immunotherapies, till 2035
- 27.3.3. Gene Therapy Market for Gene Editing, till 2035
- 27.3.4. Gene Therapy Market for Gene Regulation, till 2035
- 27.3.5. Gene Therapy Market for Other Therapies, till 2035
- 27.4. Data Triangulation and Validation
28. GENE THERAPIES MARKET, BY TYPE OF GENE DELIVERY METHOD
- 28.1. Chapter Overview
- 28.2. Key Assumptions and Methodology
- 28.3. Gene Therapy Market: Distribution by Type of Gene Delivery Method, 2024, 2029 and 2035
- 28.3.1. Gene Therapy Market for In vivo Gene Delivery, till 2035
- 28.3.2. Gene Therapy Market for Ex vivo Gene Delivery, till 2035
- 28.4. Data Triangulation and Validation
29. GENE THERAPIES MARKET, BY ROUTE OF ADMINISTRATION
- 29.1. Chapter Overview
- 29.2. Key Assumptions and Methodology
- 29.3. Gene Therapy Market: Distribution by Route of Administration, 2024, 2029 and 2035
- 29.3.1. Gene Therapy Market for Intravenous Route, till 2035
- 29.3.2. Gene Therapy Market for Subretinal Route, till 2035
- 29.3.3. Gene Therapy Market for Intratumoral Route, till 2035
- 29.3.4. Gene Therapy Market for Intramuscular Route, till 2035
- 29.3.5. Gene Therapy Market for Other Routes of Administration, till 2035
- 29.4. Data Triangulation and Validation
30. GENE THERAPIES MARKET, BY GEOGRAPHICAL REGIONS
- 30.1. Chapter Overview
- 30.2. Key Assumptions and Methodology
- 30.3. Gene Therapy Market: Distribution by Geographical Regions, 2024, 2029 and 2035
- 30.3.1. Gene Therapy Market in North America, till 2035
- 30.3.2. Gene Therapy Market in Europe, till 2035
- 30.3.3. Gene Therapy Market in Asia-Pacific, till 2035
- 30.3.4. Gene Therapy Market in Latin America, till 2035
- 30.3.5. Gene Therapy Market in Rest of the World, till 2035
- 30.4. Data Triangulation and Validation
31. GENE THERAPIES MARKET, BY LEADING PLAYERS
- 31.1. Chapter Overview
- 31.2. Gene Therapy Market: Distribution by Leading Gene Therapy Developers
- 31.3. Data Triangulation and Validation
32. GENE THERAPIES MARKET, SALES FORECAST OF THERAPIES
- 32.1. Chapter Overview
- 32.2. Key Assumptions and Methodology
- 32.3. Commercialized Gene Therapies Market: Sales Forecast
- 32.3.1. Adstiladrin(R)
- 32.3.1.1. Sales Forecast
- 32.3.1.2. Net Present Value
- 32.3.1.3. Value Creation Analysis
- 32.3.2. BEQVEZ(TM)
- 32.3.2.1. Sales Forecast
- 32.3.2.2. Net Present Value
- 32.3.2.3. Value Creation Analysis
- 32.3.3. Casgevy(TM)
- 32.3.3.1. Sales Forecast
- 32.3.3.2. Net Present Value
- 32.3.3.3. Value Creation Analysis
- 32.3.4. Elevidys(R)
- 32.3.4.1. Sales Forecast
- 32.3.4.2. Net Present Value
- 32.3.4.3. Value Creation Analysis
- 32.3.5. Gendicine(R)
- 32.3.5.1. Sales Forecast
- 32.3.5.2. Net Present Value
- 32.3.5.3. Value Creation Analysis
- 32.3.6. Hemgenix(R)
- 32.3.6.1. Sales Forecast
- 32.3.6.2. Net Present Value
- 32.3.6.3. Value Creation Analysis
- 32.3.7. IMLYGIC(R)
- 32.3.7.1. Sales Forecast
- 32.3.7.2. Net Present Value
- 32.3.7.3. Value Creation Analysis
- 32.3.8. Libmeldy(R)
- 32.3.8.1. Sales Forecast
- 32.3.8.2. Net Present Value
- 32.3.8.3. Value Creation Analysis
- 32.3.9. Luxturna(R)
- 32.3.9.1. Sales Forecast
- 32.3.9.2. Net Present Value
- 32.3.9.3. Value Creation Analysis
- 32.3.10. LYFGENIA(TM)
- 32.3.10.1. Sales Forecast
- 32.3.10.2. Net Present Value
- 32.3.10.3. Value Creation Analysis
- 32.3.11. Neovasculgen(R)
- 32.3.11.1. Sales Forecast
- 32.3.11.2. Net Present Value
- 32.3.11.3. Value Creation Analysis
- 32.3.12. Oncorine(R)
- 32.3.12.1. Sales Forecast
- 32.3.12.2. Net Present Value
- 32.3.12.3. Value Creation Analysis
- 32.3.13. Roctavian(TM)
- 32.3.13.1. Sales Forecast
- 32.3.13.2. Net Present Value
- 32.3.13.3. Value Creation Analysis
- 32.3.14. SKYSONA(R)
- 32.3.14.1. Sales Forecast
- 32.3.14.2. Net Present Value
- 32.3.14.3. Value Creation Analysis
- 32.3.15. Strimvelis(TM)
- 32.3.15.1. Sales Forecast
- 32.3.15.2. Net Present Value
- 32.3.15.3. Value Creation Analysis
- 32.3.16. Upstaza(TM)
- 32.3.16.1. Sales Forecast
- 32.3.16.2. Net Present Value
- 32.3.16.3. Value Creation Analysis
- 32.3.17. VYJUVEKT(R)
- 32.3.17.1. Sales Forecast
- 32.3.17.2. Net Present Value
- 32.3.17.3. Value Creation Analysis
- 32.3.18. Zolgensma(R)
- 32.3.18.1. Sales Forecast
- 32.3.18.2. Net Present Value
- 32.3.18.3. Value Creation Analysis
- 32.3.19. Zynteglo(TM)
- 32.3.19.1. Sales Forecast
- 32.3.19.2. Net Present Value
- 32.3.19.3. Value Creation Analysis
- 32.3.1. Adstiladrin(R)
- 32.4. Phase III Gene Therapies Market: Sales Forecast
- 32.4.1. AAV-RPE65
- 32.4.1.1. Sales Forecast
- 32.4.1.2. Net Present Value
- 32.4.1.3. Value Creation Analysis
- 32.4.2. ABO-102 (UX111)
- 32.4.2.1. Sales Forecast
- 32.4.2.2. Net Present Value
- 32.4.2.3. Value Creation Analysis
- 32.4.3. AGTC 501 (rAAV2tYF-GRK1-RPGR)
- 32.4.3.1. Sales Forecast
- 32.4.3.2. Net Present Value
- 32.4.3.3. Value Creation Analysis
- 32.4.4. Cretostimogene Grenadenorepvec (CG0070)
- 32.4.4.1. Sales Forecast
- 32.4.4.2. Net Present Value
- 32.4.4.3. Value Creation Analysis
- 32.4.5. Dirloctocogene samoparvovec (SPK-8011)
- 32.4.5.1. Sales Forecast
- 32.4.5.2. Net Present Value
- 32.4.5.3. Value Creation Analysis
- 32.4.6. DTx-301
- 32.4.6.1. Sales Forecast
- 32.4.6.2. Net Present Value
- 32.4.6.3. Value Creation Analysis
- 32.4.7. DTx-401
- 32.4.7.1. Sales Forecast
- 32.4.7.2. Net Present Value
- 32.4.7.3. Value Creation Analysis
- 32.4.8. Generx(R) (Ad5FGF-4)
- 32.4.8.1. Sales Forecast
- 32.4.8.2. Net Present Value
- 32.4.8.3. Value Creation Analysis
- 32.4.9. Giroctocogene fitelparvovec (SB-525 / PF-07055480)
- 32.4.9.1. Sales Forecast
- 32.4.9.2. Net Present Value
- 32.4.9.3. Value Creation Analysis
- 32.4.10. Hologene 5
- 32.4.10.1. Sales Forecast
- 32.4.10.2. Net Present Value
- 32.4.10.3. Value Creation Analysis
- 32.4.11. INVOSSA(TM) (TG-C)
- 32.4.11.1. Sales Forecast
- 32.4.11.2. Net Present Value
- 32.4.11.3. Value Creation Analysis
- 32.4.12. LUMEVOQ(R)
- 32.4.12.1. Sales Forecast
- 32.4.12.2. Net Present Value
- 32.4.12.3. Value Creation Analysis
- 32.4.13. NFS-01 (rAAV2-ND4)
- 32.4.13.1. Sales Forecast
- 32.4.13.2. Net Present Value
- 32.4.13.3. Value Creation Analysis
- 32.4.14. NTLA-2001
- 32.4.14.1. Sales Forecast
- 32.4.14.2. Net Present Value
- 32.4.14.3. Value Creation Analysis
- 32.4.15. Olvi-Vec (Olvimulogene nanivacirepvec)
- 32.4.15.1. Sales Forecast
- 32.4.15.2. Net Present Value
- 32.4.15.3. Value Creation Analysis
- 32.4.16. ProstAtak(R)
- 32.4.16.1. Sales Forecast
- 32.4.16.2. Net Present Value
- 32.4.16.3. Value Creation Analysis
- 32.4.17. pz-cel (prademagene zamikeracel / EB-101)
- 32.4.17.1. Sales Forecast
- 32.4.17.2. Net Present Value
- 32.4.17.3. Value Creation Analysis
- 32.4.18. RGX-121
- 32.4.18.1. Sales Forecast
- 32.4.18.2. Net Present Value
- 32.4.18.3. Value Creation Analysis
- 32.4.19. RGX-314
- 32.4.19.1. Sales Forecast
- 32.4.19.2. Net Present Value
- 32.4.19.3. Value Creation Analysis
- 32.4.20. VGX-3100
- 32.4.20.1. Sales Forecast
- 32.4.20.2. Net Present Value
- 32.4.20.3. Value Creation Analysis
- 32.4.1. AAV-RPE65
33. GENE THERAPY MARKET: EMERGING TECHNOLOGIES
- 33.1. Chapter Overview
- 33.2. Gene Editing Technologies
- 33.2.1. Applications of Gene Editing
- 33.3. Emerging Gene Editing Platforms
- 33.3.1. CRISPR / Cas9 System
- 33.3.1.1. Technology Providers
- 33.3.2. Zinc Finger Nuclease
- 33.3.2.1. Technology Providers
- 33.3.3. TALENs
- 33.3.4. megaTAL
- 33.3.4.1. Technology Providers
- 33.3.1. CRISPR / Cas9 System
- 33.4. Gene Therapy Regulation Technologies (Gene Switch Technology)
- 33.4.1. Technology Providers
- 33.5. Other Emerging Technologies
- 33.6. Technology Platforms for Developing / Delivering Gene Therapies
- 33.7. Concluding Remarks
34. VECTOR MANUFACTURING FOR GENE THERAPIES
- 34.1. Chapter Overview
- 34.2. Viral Vector Manufacturing Process
- 34.2.1. Mode of Vector Production
- 34.2.2. Adherent and Suspension Cultures
- 34.2.3. Unit Processes and Multiple Parallel Processes
- 34.2.4. Cell Culture Systems for Production of Viral Vectors
- 34.2.4.1. Small-Scale / Laboratory Scale Cell Culture Systems
- 34.2.4.2. Large-Scale Cell Culture Systems
- 34.2.4.2.1. Stirred Tank Reactor Systems
- 34.2.4.2.2. Fixed Bed Reactor / Packed Bed Reactor
- 34.2.4.2.3. WAVE Bioreactor System
- 34.2.5. Culture Media Specifications
- 34.3. Bioprocessing of Viral Vectors
- 34.3.1. AAV Vector Production
- 34.3.2. Adenoviral Vector Production
- 34.3.3. Lentiviral Vector Production
- 34.3.4. Y - Retroviral Vector Production
- 34.4. Challenges Associated with Vector Manufacturing
- 34.5. Contract Manufacturing Organizations Involved in Viral Vector Production
35. CASE STUDY: GENE THERAPY SUPPLY CHAIN
- 35.1. Chapter Overview
- 35.2. Overview of Gene Therapy Supply Chain
- 35.3. Implementation of Supply Chain Models
- 35.4. Logistics in Gene Therapy
- 35.4.1. Logistic Processes for Autologous and Allogenic Therapies
- 35.5. Regulatory Supply Chain Across the Globe
- 35.6. Challenges Associated with Gene Therapy Supply Chain
- 35.7. Software Applications for Gene Therapy Supply Chain Management
- 35.7.1. Enterprise Manufacturing System
- 35.7.2. Laboratory Information Management System
- 35.7.3. Inventory Management System
- 35.7.4. Quality Management System
- 35.7.5. Logistics Management System
- 35.7.6. Patient Management System
- 35.7.7. Electronic Clinical Outcome Assessments System
- 35.7.8. Supply Chain Orchestration Platform
- 35.8. Recent Developments and Upcoming Trends
36. EXECUTIVE INSIGHTS
37. CONCLUSION
38. APPENDIX I: TABULATED DATA
39. APPENDIX II: LIST OF COMPANIES AND ORGANIZATIONS
List of Tables
- Table 6.1 Comparison of Ex vivo and In vivo Techniques
- Table 6.2 Routes of Administration of Gene Therapies: Advantages and Disadvantages
- Table 6.3 Advantages and Disadvantages of Gene Therapies
- Table 7.1 Key Features of Viral Vectors
- Table 8.1 Payment Options Available for Gene Therapies
- Table 8.2 Approved Advanced Therapies Medicinal Products (ATMPs) and their Reimbursement Status in Europe
- Table 9.1 Marketed and Clinical Stage Gene Therapies: Information on Developer, Stage of Development and Drug Designation
- Table 9.2 Marketed and Clinical Stage Gene Therapies: Information on Developer, Therapeutic Area and Biological Target
- Table 9.3 Marketed and Clinical Stage Gene Therapies: Information on Developer and Type of Vector Used
- Table 9.4 Marketed and Clinical Stage Gene Therapies: Information on Developer, Type of Therapy and Type of Gene Delivery Method
- Table 9.5 Marketed and Clinical Stage Gene Therapies: Information on Developer, Route of Administration and Dosage
- Table 9.6 Preclinical and Discovery Stage Gene Therapies: Information on Developer, Stage of Development, Therapeutic Area and Biological Target
- Table 9.7 Preclinical and Discovery Stage Gene Therapies: Information on Developer and Type of Vector Used
- Table 9.8 Preclinical and Discovery Stage Gene Therapies: Information on Developer, Type of Therapy and Type of Gene Delivery Method
- Table 10.1 Gene Therapy Developers: Information on Year of Establishment, Company Size and Location of Headquarters
- Table 11.1 Gene Therapy: List of Companies Profiled
- Table 11.2 Amgen: Company Overview
- Table 11.3 Amgen: Marketed Gene Therapy Portfolio
- Table 11.4 Amgen: Clinical Stage Gene Therapy Portfolio
- Table 11.5 bluebird bio: Company Overview
- Table 11.6 bluebird bio: Marketed Gene Therapy Portfolio
- Table 11.7 bluebird bio: Preclinical and Discovery Stage Gene Therapy Portfolio
- Table 11.8 bluebird bio: Recent Developments and Future Outlook
- Table 11.9 BioMarin Pharmaceutical: Company Overview
- Table 11.10 BioMarin Pharmaceutical: Marketed Gene Therapy Portfolio
- Table 11.11 BioMarin Pharmaceutical: Preclinical Stage Gene Therapy Portfolio
- Table 11.12 BioMarin Pharmaceutical: Recent Developments and Future Outlook
- Table 11.13 CRISPR Therapeutics: Company Overview
- Table 11.14 CRISPR Therapeutics: Marketed Gene Therapy Portfolio
- Table 11.15 CRISPR Therapeutics: Preclinical and Discovery Stage Gene Therapy Portfolio
- Table 11.16 CRISPR Therapeutics: Recent Developments and Future Outlook
- Table 11.17 Kolon TissueGene: Company Overview
- Table 11.18 Kolon TissueGene: Marketed Gene Therapy Portfolio
- Table 11.19 Kolon TissueGene: Clinical Stage Gene Therapy Portfolio
- Table 11.20 Kolon TissueGene: Prelinical Stage Gene Therapy Portfolio
- Table 11.21 Kolon TissueGene: Recent Developments and Future Outlook
- Table 11.21 Krystal Biotech: Company Overview
- Table 11.22 Krystal Biotech: Marketed Gene Therapy Portfolio
- Table 11.23 Krystal Biotech: Clinical Stage Gene Therapy Portfolio
- Table 11.24 Krystal Biotech: Preclinical and Discovery Stage Gene Therapy Portfolio
- Table 11.25 Krystal Biotech: Recent Developments and Future Outlook
- Table 11.26 Pfizer: Company Overview
- Table 11.27 Pfizer: Marketed Gene Therapy Portfolio
- Table 11.28 Pfizer: Clinical Stage Gene Therapy Portfolio
- Table 11.29 Pfizer: Preclinical and Discovery Stage Gene Therapy Portfolio
- Table 11.30 Pfizer: Recent Developments and Future Outlook
- Table 11.31 PTC Therapeutics: Company Overview
- Table 11.32 PTC Therapeutics: Marketed Gene Therapy Portfolio
- Table 11.33 PTC Therapeutics: Preclinical Stage Gene Therapy Portfolio
- Table 11.34 PTC Therapeutics: Recent Developments and Future Outlook
- Table 11.35 Sarepta Therapeutics: Company Overview
- Table 11.36 Sarepta Therapeutics: Marketed Gene Therapy Portfolio
- Table 11.37 Sarepta Therapeutics: Clinical Stage Gene Therapy Portfolio
- Table 11.38 Sarepta Therapeutics: Preclinical and Discovery Gene Therapy Portfolio
- Table 11.39 Sarepta Therapeutics: Recent Developments and Future Outlook
- Table 11.40 Spark Therapeutics: Company Overview
- Table 11.41 Spark Therapeutics: Marketed Gene Therapy Portfolio
- Table 11.42 Spark Therapeutics: Clinical Stage Gene Therapy Portfolio
- Table 11.43 Spark Therapeutics: Preclinical and Discovery Stage Gene Therapy Portfolio
- Table 11.44 Spark Therapeutics: Recent Developments and Future Outlook
- Table 11.45 Artgen Biotech: Company Overview
- Table 11.46 Artgen Biotech: Marketed Gene Therapy Portfolio
- Table 11.47 Artgen Biotech: Preclinical and Discovery Stage Gene Therapy Portfolio
- Table 11.48 Artgen Biotech: Recent Developments and Future Outlook
- Table 11.49 Ferring Pharmaceuticals: Company Overview
- Table 11.50 Ferring Pharmaceuticals: Marketed Gene Therapy Portfolio
- Table 11.51 Ferring Pharmaceuticals: Clinical Stage Gene Therapy Portfolio
- Table 11.52 Ferring Pharmaceuticals: Recent Developments and Future Outlook
- Table 11.53 Novartis: Company Overview
- Table 11.54 Novartis: Marketed Gene Therapy Portfolio
- Table 11.55 Novartis: Clinical Stage Gene Therapy Portfolio
- Table 11.56 Novartis: Preclinical and Discovery Stage Gene Therapy Portfolio
- Table 11.57 Novartis: Recent Developments and Future Outlook
- Table 11.58 Orchard Therapeutics: Company Overview
- Table 11.59 Orchard Therapeutics: Marketed Gene Therapy Portfolio
- Table 11.60 Orchard Therapeutics: Clinical Stage Gene Therapy Portfolio
- Table 11.61 Orchard Therapeutics: Preclinical Stage Gene Therapy Portfolio
- Table 11.62 Orchard Therapeutics: Recent Developments and Future Outlook
- Table 11.63 CSL Behring: Company Overview
- Table 11.64 CSL Behring: Marketed Gene Therapy Portfolio
- Table 11.65 CSL Behring: Discovery Stage Gene Therapy Portfolio
- Table 11.66 CSL Behring: Recent Developments and Future Outlook
- Table 11.67 Shanghai Sunway Biotech: Company Overview
- Table 11.68 Shanghai Sunway Biotech: Marketed Gene Therapy Portfolio
- Table 11.69 Sibiono GeneTech: Company Overview
- Table 11.70 Sibiono GeneTech: Marketed Gene Therapy Portfolio
- Table 12.1 Gene Therapies: Marketed and Approved Products
- Table 12.2 Company Overview: Sibiono GeneTech
- Table 12.3 Gendicine: Patent Portfolio
- Table 12.4 Gendicine: Stage of Development
- Table 12.5 Company Overview: Shanghai Sunway Biotech
- Table 12.6 Oncorine: Stage of Development
- Table 12.7 Company Overview: Human Stem Cell Institute
- Table 12.8 Neovasculgen: Stage of Development
- Table 12.9 Company Overview: Amgen
- Table 12.10 Imlygic: Stage of Development
- Table 12.11 Imlygic: Recommended Dose and Schedule
- Table 12.12 Imlygic: Determination of Injection Volume based upon Lesion Size
- Table 12.13 Company Overview: Orchard Therapeutics
- Table 12.14 Strimvelis: Stage of Development
- Table 12.15 Company Overview: Spark Therapeutics
- Table 12.16 Luxturna: Stage of Development
- Table 12.17 Company Overview: Novartis
- Table 12.18 Zolgensma: Stage of Development
- Table 12.19 Company Overview: bluebird bio
- Table 12.20 Zynteglo: Stage of Development
- Table 12.21 Libmeldy: Stage of Development
- Table 13.1 Libmeldy: Presentations in Conferences Before Product Approval
- Table 13.2 Luxturna: Presentations in Conferences Before Product Approval
- Table 13.3 Zolgensma: Presentations in Conferences Before Product Approval
- Table 13.4 Zynteglo: Presentations in Conferences Before Product Approval
- Table 13.5 Imlygic: Presentations in Conferences After Product Approval
- Table 13.6 Libmeldy: Presentations in Conferences After Product Approval
- Table 13.7 Luxturna: Presentations in Conferences After Product Approval
- Table 13.8 Strimvelis: Presentations in Conferences After Product Approval
- Table 13.9 Zolgensma: Presentations in Conferences After Product Approval
- Table 13.10 Zynteglo: Presentations in Conferences After Product Approval
- Table 13.11 Approved Gene Therapies: Patient Support Services Available on Product Websites (Comparative Analysis)
- Table 14.1 Gene Therapies: Phase II / III and Above Drugs
- Table 14.2 Drug Profile: LUMEVOQ (GS010)
- Table 14.3 Drug Profile: OTL-103
- Table 14.4 Drug Profile: PTC-AADC
- Table 14.5 Drug Profile: BMN 270
- Table 14.6 Drug Profile: nadofaragene firadenovec (rAd-IFN/Syn3)
- Table 14.7 Drug Profile: beti-cel
- Table 14.8 Drug Profile: eli-cel
- Table 14.9 Drug Profile: lovo-cel
- Table 14.10 Drug Profile: SRP-9001
- Table 14.11 Drug Profile: EB-101
- Table 14.12 Drug Profile: ProstAtak
- Table 14.13 Drug Profile: D-Fi
- Table 14.14 Drug Profile: CG0070
- Table 14.15 Drug Profile: Vigil-EWS
- Table 14.16 Drug Profile: Engensis
- Table 14.17 Drug Profile: VGX-3100
- Table 14.18 Drug Profile: INVOSSA (TG-C)
- Table 14.19 Drug Profile: VYJUVEKT
- Table 14.20 Drug Profile: PF-06939926
- Table 14.21 Drug Profile: PF-06838435
- Table 14.22 Drug Profile: PF-07055480
- Table 14.23 Drug Profile: SPK-8011
- Table 14.24 Drug Profile: AMT-061
- Table 14.25 Drug Profile: VB-111
- Table 14.26 Drug Profile: Generx
- Table 14.27 Drug Profile: ADXS-HPV
- Table 14.28 Drug Profile: AGTC 501
- Table 14.29 Drug Profile: LYS-SAF302
- Table 14.30 Drug Profile: NFS-01
- Table 14.31 Drug Profile: AG0302-COVID19
- Table 14.32 Drug Profile: RGX-314
- Table 14.33 Drug Profile: Hologene 5
- Table 15.1 Gene Therapy Patent Portfolio: List of Top CPC Symbols
- Table 15.2 Gene Therapy Patent Portfolio: Summary of Benchmarking Analysis
- Table 15.3 Gene Therapy Patent Portfolio: Categorizations based on Weighted Valuation Scores
- Table 15.4 Gene Therapy Patent Portfolio: List of Leading Patents (In terms of Highest Relative Valuation)
- Table 15.5 Gene Editing Patent Portfolio: List of Top CPC Classifications
- Table 15.6 Gene Editing Patent Portfolio: Summary of Benchmarking Analysis
- Table 15.7 Gene Editing Patent Portfolio: Categorizations based on Weighted Valuation Scores
- Table 15.8 Gene Editing Patent Portfolio: List of Leading Patents (in terms of Highest Relative Valuation)
- Table 16.1 Gene Therapy: List of Mergers and Acquisitions, since 2015
- Table 16.2 Acquisitions: Key Value Drivers
- Table 16.3 Mergers and Acquisitions: Information on Phase of Development and Therapeutic Area of the Acquired Company's Gene Therapy Product
- Table 16.4 Mergers and Acquisitions: Information on Deal Multiple based on Acquisition Amount
- Table 17.1 Gene Therapy Market: Funding and Investments, since 2015
- Table 17.2 Funding and Investments: Summary of Investments
- Table 17.3 Funding and Investments: Summary of Venture Capital Funding
- Table 18.1 Clinical Trial Analysis: Emerging Molecules to Watch
- Table 18.2 Clinical Trial Analysis: Most Important Trials to Watch
- Table 19.1 Pricing Model: Price of Marketed Gene / Cell Therapies
- Table 19.2 Pricing Model: Price of Marketed Targeted Drugs (Antibody Drug Conjugates and Monoclonal Antibodies)
- Table 19.3 Pricing Model: Opinions of Experts / Other Analysts
- Table 20.1 Start-up Valuation: Estimates based on Overall Experience
- Table 22.1 Global Clinical Demand for Gene Therapies: Information on Trial Phase, Distribution of Patient Enrolment and Average Number of Patients Enrolled
- Table 24.1 Gene Therapy Market: List of Forecasted Therapies along with Information on Developer, Stage of Development and First Launch Year / Likely Approval Year
- Table 32.1 Adstiladrin(R): Net Present Value (USD Million)
- Table 32.2 Adstilarin(R): Value Creation Analysis (USD Million)
- Table 32.3 BEQVEZ(TM): Net Present Value (USD Million)
- Table 32.4 BEQVEZ(TM): Value Creation Analysis (USD Million)
- Table 32.5 Casgevy(TM): Net Present Value (USD Million)
- Table 32.6 Casgevy(TM): Value Creation Analysis (USD Million)
- Table 32.7 Elevidys(R): Net Present Value (USD Million)
- Table 32.8 Elevidys(R): Value Creation Analysis (USD Million)
- Table 32.9 Gendicine(R): Net Present Value (USD Million)
- Table 32.10 Gendicine(R): Value Creation Analysis (USD Million)
- Table 32.11 Hemgenix(R): Net Present Value (USD Million)
- Table 32.12 Hemgenix(R): Value Creation Analysis (USD Million)
- Table 32.13 IMLYGIC(R): Net Present Value (USD Million)
- Table 32.14 IMLYGIC(R): Value Creation Analysis (USD Million)
- Table 32.15 Libmeldy(R): Net Present Value (USD Million)
- Table 32.16 Libmeldy(R): Value Creation Analysis (USD Million)
- Table 32.17 Luxturna(R): Net Present Value (USD Million)
- Table 32.18 Luxturna(R): Value Creation Analysis (USD Million)
- Table 32.19 LYFGENIA(TM): Net Present Value (USD Million)
- Table 32.20 LYFGENIA(TM): Value Creation Analysis (USD Million)
- Table 32.21 Neovasculgen(R): Net Present Value (USD Million)
- Table 32.22 Neovasculgen(R): Value Creation Analysis (USD Million)
- Table 32.23 Oncorine(R): Net Present Value (USD Million)
- Table 32.24 Oncorine(R): Value Creation Analysis (USD Million)
- Table 32.25 Roctavian(TM): Net Present Value (USD Million)
- Table 32.26 Roctavian(TM): Value Creation Analysis (USD Million)
- Table 32.27 SKYSONA(R): Net Present Value (USD Million)
- Table 32.28 SKYSONA(R): Value Creation Analysis (USD Million)
- Table 32.29 Strimvelis(TM): Net Present Value (USD Million)
- Table 32.30 Strimvelis(TM): Value Creation Analysis (USD Million)
- Table 32.31 Upstaza(TM): Net Present Value (USD Million)
- Table 32.32 Upstaza(TM): Value Creation Analysis (USD Million)
- Table 32.33 VYJUVEKT(R): Net Present Value (USD Million)
- Table 32.34 VYJUVEKT(R): Value Creation Analysis (USD Million)
- Table 32.35 Zolgensma(R): Net Present Value (USD Million)
- Table 32.36 Zolgensma(R): Value Creation Analysis (USD Million)
- Table 32.37 Zynteglo(TM): Net Present Value (USD Million)
- Table 32.38 Zynteglo(TM): Value Creation Analysis (USD Million)
- Table 32.39 AAV-RPE65: Net Present Value (USD Million)
- Table 32.40 AAV-RPE65: Value Creation Analysis (USD Million)
- Table 32.41 ABO-102 (UX111): Net Present Value (USD Million)
- Table 32.42 ABO-102 (UX111): Value Creation Analysis (USD Million)
- Table 32.43 AGTC 501 (rAAV2tYF-GRK1-RPGR): Net Present Value (USD Million)
- Table 32.44 AGTC 501 (rAAV2tYF-GRK1-RPGR): Value Creation Analysis (USD Million)
- Table 32.45 Cretostimogene Grenadenorepvec (CG0070): Net Present Value (USD Million)
- Table 32.46 Cretostimogene Grenadenorepvec (CG0070: Value Creation Analysis (USD Million)
- Table 32.47 Dirloctocogene samoparvovec (SPK-8011): Net Present Value (USD Million)
- Table 32.48 Dirloctocogene samoparvovec (SPK-8011): Value Creation Analysis (USD Million)
- Table 32.49 DTx-301: Net Present Value (USD Million)
- Table 32.50 DTx-301: Value Creation Analysis (USD Million)
- Table 32.51 DTx-401: Net Present Value (USD Million)
- Table 32.52 DTx-401: Value Creation Analysis (USD Million)
- Table 32.53 Generx(R) (Ad5FGF-4): Net Present Value (USD Million)
- Table 32.54 Generx(R) (Ad5FGF-4): Value Creation Analysis (USD Million)
- Table 32.55 Giroctocogene fitelparvovec (SB-525 / PF-07055480): Net Present Value (USD Million)
- Table 32.56 Giroctocogene fitelparvovec (SB-525 / PF-07055480): Value Creation Analysis (USD Million)
- Table 32.57 Hologene 5: Net Present Value (USD Million)
- Table 32.58 Hologene 5: Value Creation Analysis (USD Million)
- Table 32.59 INVOSSA(TM) (TG-C): Net Present Value (USD Million)
- Table 32.60 INVOSSA(TM) (TG-C): Value Creation Analysis (USD Million)
- Table 32.61 LUMEVOQ(R): Net Present Value (USD Million)
- Table 32.62 LUMEVOQ(R): Value Creation Analysis (USD Million)
- Table 32.63 NFS-01 (rAAV2-ND4): Net Present Value (USD Million)
- Table 32.64 NFS-01 (rAAV2-ND4): Value Creation Analysis (USD Million)
- Table 32.65 NTLA-2001: Net Present Value (USD Million)
- Table 32.66 NTLA-2001: Value Creation Analysis (USD Million)
- Table 32.67 Olvi-Vec (Olvimulogene nanivacirepvec): Net Present Value (USD Million)
- Table 32.68 Olvi-Vec (Olvimulogene nanivacirepvec): Value Creation Analysis (USD Million)
- Table 32.69 ProstAtak(R): Net Present Value (USD Million)
- Table 32.70 ProstAtak(R): Value Creation Analysis (USD Million)
- Table 32.71 pz-cel (prademagene zamikeracel / EB-101): Net Present Value (USD Million)
- Table 32.72 pz-cel (prademagene zamikeracel / EB-101): Value Creation Analysis (USD Million)
- Table 32.73 RGX-121: Net Present Value (USD Million)
- Table 32.74 RGX-121: Value Creation Analysis (USD Million)
- Table 32.75 RGX-314: Net Present Value (USD Million)
- Table 32.76 RGX-314: Value Creation Analysis (USD Million)
- Table 32.77 VGX-3100: Net Present Value (USD Million)
- Table 32.78 VGX-3100: Value Creation Analysis (USD Million)
- Table 32.79 Summary of Variations in Forecasted Sales Revenue of Gene Therapies (Compared to 5th Edition)
- Table 33.1 Gene Editing Technologies: Information on Developer and Highest Phase of Drug Development Supported
- Table 33.2 Key Features of Gene Editing Platforms
- Table 33.3 ASC Therapeutics: Collaborations
- Table 33.4 CRISPR Therapeutics: Funding Instances
- Table 33.5 CRISPR Therapeutics: Collaborations
- Table 33.6 Editas Medicine: Funding Instances
- Table 33.7 Editas Medicine: Collaborations
- Table 33.8 Emendo Biotherapeutics: Collaborations
- Table 33.9 Excision Biotherapeutics: Funding Instances
- Table 33.10 Intellia Therapeutics: Funding Instances
- Table 33.11 Intellia Therapeutics: Collaborations
- Table 33.12 Sarepta Therapeutics: Funding Instances
- Table 33.13 Sarepta Therapeutics: Collaborations
- Table 33.14 ToolGen: Collaborations
- Table 33.15 Sangamo Therapeutics: Funding Instances
- Table 33.16 Sangamo Therapeutics: Collaborations
- Table 33.17 bluebird bio: Funding Instances
- Table 34.18 bluebird bio: Collaborations
- Table 34.19 Gene Switch Technology Platforms
- Table 33.20 Precigen: Funding Instances
- Table 33.21 MeiraGTx: Funding Instances
- Table 33.22 MeiraGTx: Collaborations
- Table 33.23 Gene Therapy Developers: Information on Headquarters, Technology / Platform and Type of Gene Delivery Method
- Table 34.1 Key Features of Small-scale Cell Culture Systems
- Table 34.2 List of Viral Vector Contract Manufacturing Organizations: Information on Type of Viral Vector Manufactured
- Table 36.1 Orchard Therapeutics: Company Snapshot
- Table 36.2 Vivet Therapeutics: Company Snapshot
- Table 36.3 Kubota Pharmaceutical: Company Snapshot
- Table 36.4 Eyevensys: Company Snapshot
- Table 36.5 AGTC: Company Snapshot
- Table 36.6 LogicBio Therapeutics: Company Snapshot
- Table 36.7 AAVogen: Company Snapshot
- Table 36.8 Hemera Biosciences: Company Snapshot
- Table 36.9 Myonexus Therapeutics: Company Snapshot
- Table 36.10 Arthrogen: Company Snapshot
- Table 36.11 PlasmidFactory: Company Snapshot
- Table 36.12 Delphi Genetics: Company Snapshot
- Table 36.13 Vigene Biosciences: Company Snapshot
- Table 36.14 Gene Biotherapeutics: Company Snapshot
- Table 36.15 Milo Biotechnology: Company Snapshot
- Table 38.1 Marketed and Clinical Stage Gene Therapies: Distribution by Stage of Development
- Table 38.2 Marketed and Clinical Stage Gene Therapies: Distribution by Drug Designation
- Table 38.3 Marketed and Clinical Stage Gene Therapies: Distribution by Therapeutic Area
- Table 38.4 Marketed and Clinical Stage Gene Therapies: Distribution by Biological Target
- Table 38.5 Marketed and Clinical Stage Gene Therapies: Distribution by Type of Vector Used
- Table 38.6 Marketed and Clinical Stage Gene Therapies: Distribution by Type of Therapy
- Table 38.7 Marketed and Clinical Stage Gene Therapies: Distribution by Type of Gene Delivery Method
- Table 38.8 Marketed and Clinical Stage Gene Therapies: Distribution by Route of Administration
- Table 38.9 Marketed and Clinical Stage Gene Therapies: Distribution by Dosage
- Table 38.10 Preclinical and Discovery Stage Gene Therapies: Distribution by Stage of Development
- Table 38.11 Preclinical and Discovery Stage Gene Therapies: Distribution by Therapeutic Area
- Table 38.12 Preclinical and Discovery Stage Gene Therapies: Distribution by Biological Target
- Table 38.13 Preclinical and Discovery Stage Gene Therapies: Distribution by Type of Vector Used
- Table 38.14 Preclinical and Discovery Stage Gene Therapies: Distribution by Type of Therapy
- Table 38.15 Preclinical and Discovery Stage Gene Therapies: Distribution by Type of Gene Delivery Method Used
- Table 38.16 Gene Therapy Developers: Distribution by Year of Establishment
- Table 38.17 Gene Therapy Developers: Distribution by Company Size
- Table 38.18 Gene Therapy Developers: Distribution by Location of Headquarters
- Table 38.19 Most Active Players: Distribution by Number of Gene Therapies
- Table 38.20 Gene Therapy Patent Portfolio: Distribution by Type of Patent
- Table 38.21 Gene Therapy Patent Portfolio: Cumulative Distribution by Publication Year, since 2017
- Table 38.22 Gene Therapy Patent Portfolio: Distribution by Type of Patent and Publication Year
- Table 38.23 Gene Therapy Patent Portfolio: Distribution by Geography
- Table 38.24 Gene Therapy Patent Portfolio: North America Scenario
- Table 38.25 Gene Therapy Patent Portfolio: Europe Scenario
- Table 38.26 Gene Therapy Patent Portfolio: Asia-Pacific Scenario
- Table 38.27 Gene Therapy Patent Portfolio: Distribution by CPC Symbols
- Table 38.28 Gene Therapy Patent Portfolio: Leading Industry Players: Distribution by Number of Players
- Table 38.29 Gene Therapy Patent Portfolio (Sanofi and Genethon): Benchmarking by Patent Characteristics
- Table 38.30 Gene Editing Patent Portfolio: Distribution by Type of Patent
- Table 38.31 Gene Editing Patent Portfolio: Cumulative Distribution by Publication Year, since 2017
- Table 38.32 Gene Editing Patent Portfolio: Distribution by Type of Patent and Publication Year
- Table 38.33 Gene Editing Patent Portfolio: Distribution by Geography
- Table 38.34 Gene Editing Patent Portfolio: North America Scenario
- Table 38.35 Gene Editing Patent Portfolio: Europe Scenario
- Table 38.36 Gene Editing Patent Portfolio: Asia-Pacific Scenario
- Table 38.37 Gene Editing Patent Portfolio: Distribution by CPC Symbols
- Table 38.38 Leading Industry Players (Gene Editing): Distribution by Number of Patents
- Table 38.39 Gene Editing Patent Portfolio (Intellia Therapeutics and CRISPR Therapeutics): Benchmarking by Patent Characteristics
- Table 38.40 Mergers and Acquisitions: Cumulative Year-Wise Trend, since 2015
- Table 38.42 Mergers and Acquisitions: Distribution by Year and Type of Agreement
- Table 38.43 Mergers and Acquisitions: Intercontinental and Intracontinental Deals
- Table 38.44 Mergers and Acquisitions: Local and International Deals
- Table 38.45 Acquisitions: Distribution by Key Value Drivers
- Table 38.46 Acquisitions: Distribution by Year of Acquisition and Key Value
- Table 38.47 Mergers and Acquisitions: Distribution by Phase of Development of the Acquired Company's Product
- Table 38.48 Mergers and Acquisitions: Distribution by Year of Acquisition and Phase of Development of the Acquired Company's Product
- Table 38.49 Mergers and Acquisitions: Distribution by Therapeutic Area
- Table 38.50 Funding and Investments: Cumulative Distribution of Instances by Year, since 2015
- Table 38.51 Funding and Investments: Cumulative Distribution of Amount Invested by Year, since 2015 (USD Million)
- Table 38.52 Funding and Investments: Distribution of Instances by Type of Funding, since 2015
- Table 38.53 Funding and Investments: Distribution of Total Amount Invested by Type of Funding (USD Million)
- Table 38.54 Funding and Investments: Summary of Investments, since 2015 (USD Million)
- Table 38.55 Funding and Investments: Distribution of Instances and Amount Invested by Type of Therapy
- Table 38.56 Funding and Investments: Distribution of Instances and Amount Invested by Geography
- Table 38.57 Funding and Investments: Regional Distribution of Funding Instances
- Table 38.58 Funding and Investments: Distribution of Instances and Amount Invested by Highest Phase of Development of the Company's Product
- Table 38.59 Funding and Investments: Distribution of Instances by Therapeutic Area
- Table 38.60 Most Active Players: Distribution by Number of Funding Instances
- Table 38.61 Most Active Players: Distribution by Amount Invested (USD Million)
- Table 38.62 Funding and Investments: Distribution of Instances by Type of Investors
- Table 38.63 Leading Investors: Distribution by Number of Instances
- Table 38.64 Funding and Investment Summary, since 2015 (USD Million)
- Table 38.65 Clinical Trial Analysis: Distribution by Trial Registration Year, since 2017
- Table 38.66 Clinical Trial Analysis: Distribution by Trial Status
- Table 38.67 Clinical Trial Analysis: Distribution by Trial Phase
- Table 38.68 Clinical Trial Analysis: Distribution by Therapeutic Area
- Table 38.69 Clinical Trial Analysis: Distribution by Geography
- Table 38.70 Clinical Trial Analysis: Distribution by Trial Registration Year and Geography
- Table 38.71 Clinical Trial Analysis: Distribution by Trial Status and Geography
- Table 38.72 Clinical Trial Analysis: Distribution by Type of Sponsor
- Table 38.73 Clinical Trial Analysis: Distribution by Prominent Treatment Sites
- Table 38.74 Clinical Trial Analysis: Distribution of Enrolled Patient Population by Trial Registration Year, since 2017
- Table 38.75 Clinical Trial Analysis: Distribution of Enrolled Patient Population by Trial Status
- Table 38.76 Clinical Trial Analysis: Distribution of Enrolled Patient Population by Trial Phase
- Table 38.77 Clinical Trial Analysis: Distribution of Enrolled Patient Population by Therapeutic Area
- Table 38.78 Clinical Trial Analysis: Distribution of Enrolled Patient Population by Location of Trial Site
- Table 38.79 Clinical Trial Analysis: Distribution of Enrolled Patient Population by Trial Status and Location of Trial Site
- Table 38.80 Demand Analysis: Global Demand for Gene Therapies
- Table 38.81 Demand Analysis: Distribution by Stage of Development
- Table 38.82 Demand Analysis: Distribution by Therapeutic Area
- Table 38.83 Demand Analysis: Distribution by Type of Therapy
- Table 38.84 Demand Analysis: Distribution by Type of Gene Delivery Method
- Table 38.85 Demand Analysis: Distribution by Geography
- Table 38.86 Global Gene Therapy Market, till 2035, Base Scenario (USD Billion)
- Table 38.87 Global Gene Therapy Market, till 2035, Conservative Scenario (USD Billion)
- Table 38.88 Global Gene Therapy Market, till 2035, Optimistic Scenario (USD Billion)
- Table 38.89 Gene Therapy Market: Distribution by Therapeutic Area, 2024, 2029 and 2035
- Table 38.90 Gene Therapy Market for Muscle Disorders, till 2035, Conservative, Base and Optimistic Scenarios (USD Billion)
- Table 38.91 Gene Therapy Market for Hematologic Disorders, till 2035, Conservative, Base and Optimistic Scenarios (USD Billion)
- Table 38.92 Gene Therapy Market for Dermatological Disorders, till 2035, Conservative, Base and Optimistic Scenarios (USD Billion)
- Table 38.93 Gene Therapy Market for Oncological Disorders, till 2035, Conservative, Base and Optimistic Scenarios (USD Billion)
- Table 38.94 Gene Therapy Market for Genetic Disorders, till 2035, Conservative, Base and Optimistic Scenarios (USD Billion)
- Table 38.95 Gene Therapy Market for Ophthalmic Disorders, till 2035, Conservative, Base and Optimistic Scenarios (USD Billion)
- Table 38.96 Gene Therapy Market for Metabolic Disorders, till 2035, Conservative, Base and Optimistic Scenarios (USD Billion)
- Table 38.97 Gene Therapy Market for Cardiovascular Disorders, till 2035, Conservative, Base and Optimistic Scenarios (USD Billion)
- Table 38.98 Gene Therapy Market for Other Disorders, till 2035, Conservative, Base and Optimistic Scenarios (USD Billion)
- Table 38.99 Gene Therapy Market: Distribution by Type of Vector Used, 2024, 2029 and 2035
- Table 38.99 Gene Therapy Market for Adeno-associated Viral Vector, till 2035, Conservative, Base and Optimistic Scenarios (USD Billion)
- Table 38.101 Gene Therapy Market for Herpes Simplex Virus Vector, till 2035, Conservative, Base and Optimistic Scenarios (USD Billion)
- Table 38.102 Gene Therapy Market for Lentivirus Vector, till 2035, Conservative, Base and Optimistic Scenarios (USD Billion)
- Table 38.103 Gene Therapy Market for Adenovirus Vector, till 2035, Conservative, Base and Optimistic Scenarios (USD Billion)
- Table 38.104 Gene Therapy Market for Non-Viral Vector, till 2035, Conservative, Base and Optimistic Scenarios (USD Billion)
- Table 38.105 Gene Therapy Market for Retrovirus Vector, till 2035, Conservative, Base and Optimistic Scenarios (USD Billion)
- Table 38.106 Gene Therapy Market for Other-Viral Vector, till 2035, Conservative, Base and Optimistic Scenarios (USD Billion)
- Table 38.107 Gene Therapy Market: Distribution by Type of Therapy, 2024, 2029 and 2035
- Table 38.108 Gene Therapy Market for Gene Augmentation, till 2035, Conservative, Base and Optimistic Scenarios (USD Billion)
- Table 38.109 Gene Therapy Market for Oncolytic Immunotherapies, till 2035, Conservative, Base and Optimistic Scenarios (USD Billion)
- Table 38.110 Gene Therapy Market for Gene Editing, till 2035, Conservative, Base and Optimistic Scenarios (USD Billion)
- Table 38.111 Gene Therapy Market for Gene Regulation, till 2035, Conservative, Base and Optimistic Scenarios (USD Billion)
- Table 38.112 Gene Therapy Market for Other Therapies, till 2035, Conservative, Base and Optimistic Scenarios (USD Billion)
- Table 38.113 Gene Therapy Market: Distribution by Type of Gene Delivery Method Used, 2024, 2029 and 2035
- Table 38.114 Gene Therapy Market for In vivo Gene Delivery, till 2035, Conservative, Base and Optimistic Scenarios (USD Billion)
- Table 38.115 Gene Therapy Market for Ex vivo Gene Delivery, Forecasted till 2035, Conservative, Base and Optimistic Scenarios (USD
- Table 38.116 Gene Therapy Market: Distribution by Route of Administration, 2024, 2029 and 2035
- Table 38.117 Gene Therapy Market for Intravenous till 2035, Conservative, Base and Optimistic Scenarios (USD Billion)
- Table 38.118 Gene Therapy Market for Subretinal till 2035, Conservative, Base and Optimistic Scenarios (USD Billion)
- Table 38.119 Gene Therapy Market for Intratumoral till 2035, Conservative, Base and Optimistic Scenarios (USD Billion)
- Table 38.120 Gene Therapy Market for Intramuscular till 2035, Conservative, Base and Optimistic Scenarios (USD Billion)
- Table 38.121 Gene Therapy Market for Other till 2035, Conservative, Base and Optimistic Scenarios (USD Billion)
- Table 38.122 Gene Therapy Market: Distribution by Geography, 2024, 2029 and 2035
- Table 38.123 Gene Therapy Market for North America, till 2035, Conservative, Base and Optimistic Scenarios (USD Billion)
- Table 38.124 Gene Therapy Market for Europe, till 2035, Conservative, Base and Optimistic Scenarios (USD Billion)
- Table 38.125 Gene Therapy Market for Asia-Pacific, till 2035, Conservative, Base and Optimistic Scenarios (USD Billion)
- Table 38.126 Gene Therapy Market for Latin America, till 2035, Conservative, Base and Optimistic Scenarios (USD Billion)
- Table 38.127 Gene Therapy Market for Rest of the World, till 2035, Conservative, Base and Optimistic Scenarios (USD Billion)
- Table 38.128 Adstiladrin(R) Sales Forecast, till 2035, Conservative, Base and Optimistic Scenarios (USD Million)
- Table 38.129 BEQVEZ(TM) Sales Forecast, till 2035, Conservative, Base and Optimistic Scenarios (USD Million)
- Table 38.130 Casgevy(TM) Sales Forecast, till 2035, Conservative, Base and Optimistic Scenarios (USD Million)
- Table 38.131 Elevidys(R) Sales Forecast, till 2035, Conservative, Base and Optimistic Scenarios (USD Million)
- Table 38.132 Gendicine(R) Sales Forecast, till 2035, Conservative, Base and Optimistic Scenarios (USD Million)
- Table 38.133 Hemgenix(R) Sales Forecast, till 2035, Conservative, Base and Optimistic Scenarios (USD Million)
- Table 38.134 IMLYGIC(R) (AMT-061) Sales Forecast, till 2035, Conservative, Base and Optimistic Scenarios (USD Million)
- Table 38.135 Libmeldy(R) Sales Forecast, till 2035, Conservative, Base and Optimistic Scenarios (USD Million)
- Table 38.136 Luxturna(R) Sales Forecast, till 2035, Conservative, Base and Optimistic Scenarios (USD Million)
- Table 38.137 LYFGENIA(TM) Sales Forecast, till 2035, Conservative, Base and Optimistic Scenarios (USD Million)
- Table 38.138 Neovasculgen(R) Sales Forecast, till 2035, Conservative, Base and Optimistic Scenarios (USD Million)
- Table 38.139 Oncorine(R) Sales Forecast, till 2035, Conservative, Base and Optimistic Scenarios (USD Million)
- Table 38.140 Roctavian(TM) Sales Forecast, till 2035, Conservative, Base and Optimistic Scenarios (USD Million)
- Table 38.141 SKYSONA(R) Sales Forecast, till 2035, Conservative, Base and Optimistic Scenarios (USD Million)
- Table 38.142 Strimvelis(TM) Sales Forecast, till 2035, Conservative, Base and Optimistic Scenarios (USD Million)
- Table 38.143 Upstaza(TM) Sales Forecast, till 2035, Conservative, Base and Optimistic Scenarios (USD Million)
- Table 38.144 VYJUVEKT(R) Sales Forecast, till 2035, Conservative, Base and Optimistic Scenarios (USD Million)
- Table 38.145 Zolgensma(R) Sales Forecast, till 2035, Conservative, Base and Optimistic Scenarios (USD Million)
- Table 38.146 Zynteglo(TM) Sales Forecast, till 2035, Conservative, Base and Optimistic Scenarios (USD Million)
- Table 38.147 AAV-RPE65 Sales Forecast, till 2035, Conservative, Base and Optimistic Scenarios (USD Million)
- Table 38.148 ABO-102 (UX111) Sales Forecast, till 2035, Conservative, Base and Optimistic Scenarios (USD Million)
- Table 38.149 AGTC 501 (rAAV2tYF-GRK1-RPGR) Sales Forecast, till 2035, Conservative, Base and Optimistic Scenarios (USD Million)
- Table 38.150 Cretostimogene Grenadenorepvec (CG0070) Sales Forecast, till 2035, Conservative, Base and Optimistic Scenarios (USD Million)
- Table 38.151 Dirloctocogene samoparvovec (SPK-8011) Sales Forecast, till 2035, Conservative, Base and Optimistic Scenarios (USD Million)
- Table 38.152 DTx-301 Sales Forecast, till 2035, Conservative, Base and Optimistic Scenarios (USD Million)
- Table 38.153 DTx-401 Sales Forecast, till 2035, Conservative, Base and Optimistic Scenarios (USD Million)
- Table 38.154 Generx(R) (Ad5FGF-4) Sales Forecast, till 2035, Conservative, Base and Optimistic Scenarios (USD Million)
- Table 38.155 Giroctocogene fitelparvovec (SB-525 / PF-07055480) Sales Forecast, till 2035, Conservative, Base and Optimistic Scenarios (USD Million)
- Table 38.156 Hologene 5 Sales Forecast, till 2035, Conservative, Base and Optimistic Scenarios (USD Million)
- Table 38.157 INVOSSA(TM) (TG-C) Sales Forecast, till 2035, Conservative, Base and Optimistic Scenarios (USD Million)
- Table 38.158 LUMEVOQ(R) Sales Forecast, till 2035, Conservative, Base and Optimistic Scenarios (USD Million)
- Table 38.159 NFS-01 (rAAV2-ND4) Sales Forecast, till 2035, Conservative, Base and Optimistic Scenarios (USD Million)
- Table 38.160 NTLA-2001 Sales Forecast, till 2035, Conservative, Base and Optimistic Scenarios (USD Million)
- Table 38.161 Olvi-Vec (Olvimulogene nanivacirepvec) Sales Forecast, till 2035, Conservative, Base and Optimistic Scenarios (USD Million)
- Table 38.162 ProstAtak(R) Sales Forecast, till 2035, Conservative, Base and Optimistic Scenarios (USD Million)
- Table 38.163 pz-cel (prademagene zamikeracel / EB-101) Sales Forecast, till 2035, Conservative, Base and Optimistic Scenarios (USD Million)
- Table 38.164 RGX-121 Sales Forecast, till 2035, Conservative, Base and Optimistic Scenarios (USD Million)
- Table 38.165 RGX-314 Sales Forecast, till 2035, Conservative, Base and Optimistic Scenarios (USD Million)
- Table 38.166 VGX-3100 Sales Forecast, till 2035, Conservative, Base and Optimistic Scenarios (USD Million)
List of Figures
- Figure 2.1 Research Methodology: Project Methodology
- Figure 2.2 Research Methodology: Data Sources for Secondary Research
- Figure 3.1 Market Dynamics: Forecast Methodology
- Figure 3.2 Market Dynamics: Key Market Segmentation
- Figure 3.3 Market Dynamics: Robust Quality Control
- Figure 4.1 Lesson Learnt from Past Recessions
- Figure 5.1 Executive Summary: Market Landscape
- Figure 5.2 Executive Summary: Developer Landscape
- Figure 5.3 Executive Summary: Patent Analysis
- Figure 5.4 Executive Summary: Mergers and Acquisitions
- Figure 5.5 Executive Summary: Funding and Investment Analysis
- Figure 5.6 Executive Summary: Clinical Trial Analysis
- Figure 5.7 Executive Summary: Demand Analysis
- Figure 5.8 Executive Summary: Market Forecast and Opportunity Analysis
- Figure 6.1 Evolution of Gene Therapies
- Figure 6.2 Ex vivo Gene Therapies
- Figure 6.3 In vivo Gene Therapies
- Figure 6.4 Mechanism of Action of Gene Therapies
- Figure 6.5 Genome Editing: Historical Milestones
- Figure 6.6 Types of Genome Editing Techniques
- Figure 7.1 Viral and Non-Viral Vectors Used in Gene Therapy
- Figure 8.1 Centralized Regulatory Pathway for Market Approval in the US
- Figure 8.2 Centralized Regulatory Pathway for Market Approval in Europe
- Figure 8.3 Manufacturing Requirements for Gene Therapy Products in China
- Figure 8.4 Key Elements of Quality Control in China
- Figure 8.5 Centralized Regulatory Pathway for Market Approval in Japan
- Figure 9.1 Marketed and Clinical Stage Gene Therapies: Distribution by Stage of Development
- Figure 9.2 Marketed and Clinical Stage Gene Therapies: Distribution by Drug Designation
- Figure 9.3 Marketed and Clinical Stage Gene Therapies: Distribution by Therapeutic Area
- Figure 9.4 Marketed and Clinical Stage Gene Therapies: Distribution by Biological Target
- Figure 9.5 Marketed and Clinical Stage Gene Therapies: Distribution by Type of Vector Used
- Figure 9.6 Marketed and Clinical Stage Gene Therapies: Distribution by Type of Therapy
- Figure 9.7 Marketed and Clinical Stage Gene Therapies: Distribution by Type of Gene Delivery Method
- Figure 9.8 Marketed and Clinical Stage Gene Therapies: Distribution by Route of Administration
- Figure 9.9 Marketed and Clinical Stage Gene Therapies: Distribution by Dosage
- Figure 9.10 Preclinical and Discovery Stage Gene Therapies: Distribution by Stage of Development
- Figure 9.11 Preclinical and Discovery Stage Gene Therapies: Distribution by Therapeutic Area
- Figure 9.12 Preclinical and Discovery Stage Gene Therapies: Distribution by Biological Target
- Figure 9.13 Preclinical and Discovery Stage Gene Therapies: Distribution by Type of Vector Used
- Figure 9.14 Preclinical and Discovery Stage Gene Therapies: Distribution by Type of Therapy
- Figure 9.15 Preclinical and Discovery Stage Gene Therapies: Distribution by Type of Gene Delivery Method
- Figure 10.1 Gene Therapy Developers: Distribution by Year of Establishment
- Figure 10.2 Gene Therapy Developers: Distribution by Company Size
- Figure 10.3 Gene Therapy Developers: Distribution by Location of Headquarters
- Figure 10.4 Most Active Players: Distribution by Number of Gene Therapies
- Figure 12.1 Gendicine: Development Timeline
- Figure 12.2 Oncorine: Development Timeline
- Figure 12.3 Oncorine: Mechanism of Action
- Figure 12.4 Rexin-G: Development Timeline
- Figure 12.5 Neovasculgen: Development Timeline
- Figure 12.6 Imlygic: Development Timeline
- Figure 12.7 Imlygic: Mechanism of Action
- Figure 12.8 Luxturna: Development Timeline
- Figure 12.9 Zolgensma: Development Timeline
- Figure 12.10 Collategene: Development Timeline
- Figure 12.11 Zynteglo: Development Timeline
- Figure 12.12 Libmeldy: Development Timeline
- Figure 13.1 Successful Drug Launch Strategy: ROOTS Framework
- Figure 13.2 Successful Drug Launch Strategy: Product Differentiation
- Figure 13.3 Commonly Adopted Commercialization Strategies based on Phase of Development of Product
- Figure 13.4 Harvey Ball Analysis: Commercialization Strategies Adopted by Gene Therapy Developers
- Figure 13.5 Approved Gene Therapies: Historical Timeline of Geographical Expansion
- Figure 13.6 Approved Gene Therapies: Snapshot of Promotional Activities on Product Websites
- Figure 13.7 Key Commercialization Strategies: Harvey Ball Analysis by Ease of Implementation, Value Addition and Current Adoption
- Figure 15.1 Gene Therapy Patent Portfolio: Distribution by Type of Patent
- Figure 15.2 Gene Therapy Patent Portfolio: Cumulative Distribution by Publication Year, since 2017
- Figure 15.3 Gene Therapy Patent Portfolio: Distribution by Type of Patent and Publication Year
- Figure 15.4 Gene Therapy Patent Portfolio: Distribution by Geography
- Figure 15.5 Gene Therapy Patent Portfolio: North America Scenario
- Figure 15.6 Gene Therapy Patent Portfolio: Europe Scenario
- Figure 15.7 Gene Therapy Patent Portfolio: Asia-Pacific Scenario
- Figure 15.8 Gene Therapy Patent Portfolio: Distribution by CPC Symbols
- Figure 15.9 Gene Therapy Patent Portfolio: Emerging Focus Areas
- Figure 15.10 Leading Industry Players (Gene Therapy): Distribution by Number of Patents
- Figure 15.11 Gene Therapy Patent Portfolio (Sanofi and Genethon): Benchmarking by Patent Characteristics
- Figure 15.12 Gene Therapy Patent Portfolio (Other Leading Industry Players): Benchmarking by Patent Characteristics
- Figure 15.13 Gene Therapy Patent Portfolio: Distribution by Patent Age (since 2017)
- Figure 15.14 Gene Therapy: Patent Valuation Analysis
- Figure 15.15 Gene Editing Patent Portfolio: Distribution by Type of Patent
- Figure 15.16 Gene Editing Patent Portfolio: Cumulative Distribution by Publication Year, since 2017
- Figure 15.17 Gene Therapy Patent Portfolio: Distribution by Type of Patent and Publication Year
- Figure 15.18 Gene Editing Patent Portfolio: Distribution by Geography
- Figure 15.19 Gene Editing Patent Portfolio: North America Scenario
- Figure 15.20 Gene Editing Patent Portfolio: Europe Scenario
- Figure 15.21 Gene Editing Patent Portfolio: Asia-Pacific Scenario
- Figure 15.22 Gene Editing Patent Portfolio: Distribution by CPC Symbols
- Figure 15.23 Gene Editing Patent Portfolio: Emerging Focus Areas
- Figure 15.24 Leading Industry Players (Gene Editing): Distribution by Number of Patents
- Figure 15.25 Gene Editing Patent Portfolio (Intellia Therapeutics and CRISPR Therapeutics): Benchmarking by Patent Characteristics
- Figure 15.26 Gene Editing Patent Portfolio (Other Leading Industry Players): Benchmarking by Patent Characteristics
- Figure 15.27 Gene Editing Patent Portfolio: Distribution by Patent Age (since 2017)
- Figure 15.28 Gene Editing: Patent Valuation Analysis
- Figure 15.29 Gene Therapy Patent Portfolio: Cumulative Distribution by Type of Organization
- Figure 15.30 Gene Editing Patent Portfolio: Cumulative Distribution by Type of Organization
- Figure 16.1 Mergers and Acquisitions: Cumulative Year-Wise Trend (since 2015)
- Figure 16.2 Mergers and Acquisitions: Distribution by Type of Agreement
- Figure 16.3 Mergers and Acquisitions: Distribution by Year and Type of Agreement
- Figure 16.4 Mergers and Acquisitions: Intercontinental and Intracontinental Deals
- Figure 16.5 Mergers and Acquisitions: Local and International Deals
- Figure 16.6 Acquisitions: Distribution by Key Value Drivers
- Figure 16.7 Acquisitions: Distribution by Key Value Drivers and Year of Acquisition
- Figure 16.8 Mergers and Acquisitions: Distribution by Phase of Development of the Acquired Company's Product
- Figure 16.9 Mergers and Acquisitions: Distribution by Phase of Development of the Acquired Company's Product and Year of Acquisition
- Figure 16.10 Mergers and Acquisitions: Distribution of Deal Amount by Phase of Development of the Acquired Company's Product
- Figure 16.11 Mergers and Acquisitions: Distribution by Therapeutic Area
- Figure 17.1 Funding and Investments: Cumulative Year-wise Trend, since 2015
- Figure 17.2 Funding and Investments: Cumulative Distribution by Amount Invested, since 2015 (USD Million)
- Figure 17.3 Funding and Investments: Distribution of Instances by Type of Funding, since 2015
- Figure 17.4 Funding and Investments: Distribution of Total Amount Invested by Type of Funding, since 2015 (USD Million)
- Figure 17.5 Funding and Investments: Distribution of Instances by Year and Type of Funding, since 2015
- Figure 17.6 Funding and Investments: Distribution of Instances and Amount Invested by Type of Therapy
- Figure 17.7 Funding and Investments: Distribution of Instances and Amount Invested by Geography
- Figure 17.8 Funding and Investments: Regional Distribution of Funding Instances
- Figure 17.9 Funding and Investments: Distribution of Funding Instances, Amount Invested and Phase of Development
- Figure 17.10 Funding and Investments: Distribution of Instances by Therapeutic Area
- Figure 17.11 Most Active Players: Distribution by Number of Funding Instances, since 2015
- Figure 17.12 Most Active Players: Distribution by Amount Invested, since 2015 (USD Million)
- Figure 17.13 Funding and Investments: Distribution of Instances by Type of Investors
- Figure 17.14 Leading Investors: Distribution by Number of Instances
- Figure 17.15 Funding and Investment Summary, since 2015 (USD Million)
- Figure 18.1 Clinical Trial Analysis: Cumulative Distribution by Trial Registration Year, since 2017
- Figure 18.2 Clinical Trial Analysis: Distribution by Trial Status
- Figure 18.3 Clinical Trial Analysis: Distribution by Trial Phase
- Figure 18.4 Clinical Trial Analysis: Distribution by Therapeutic Area
- Figure 18.5 Clinical Trial Analysis: Distribution by Geography
- Figure 18.6 Clinical Trial Analysis: Distribution by Trial Registration Year and Geography
- Figure 18.7 Clinical Trial Analysis: Distribution by Trial Status and Geography
- Figure 18.8 Clinical Trial Analysis: Distribution by Trial Status, Trial Phase and Geography
- Figure 18.9 Clinical Trial Analysis: Distribution by Therapeutic Area and Geography
- Figure 18.10 Clinical Trial Analysis: Distribution by Type of Sponsor
- Figure 18.11 Clinical Trial Analysis: Distribution by Prominent Treatment Sites
- Figure 18.12 Clinical Trial Analysis: Distribution of Enrolled Patient Population by Trial Registration Year, since 2017
- Figure 18.13 Clinical Trial Analysis: Distribution of Enrolled Patient Population by Trial Status
- Figure 18.14 Clinical Trial Analysis: Distribution of Enrolled Patient Population by Trial Phase
- Figure 18.15 Clinical Trial Analysis: Distribution of Enrolled Patient Population by Therapeutic Area
- Figure 18.16 Clinical Trial Analysis: Distribution of Enrolled Patient Population by Location of Trial Site
- Figure 18.17 Clinical Trial Analysis: Distribution of Enrolled Patient Population by Trial Status and Location of Trial Site
- Figure 18.18 Clinical Trial Analysis: Distribution of Enrolled Patient Population by Trial Status, Trial Phase and Location of Trial Site
- Figure 18.19 Clinical Trial Analysis: Distribution of Enrolled Patient Population by Therapeutic Area and Location of Trial Site
- Figure 19.1 Gene Therapy: Pricing Model Based on Patient Segment
- Figure 20.1 Start-up Valuation: Valuation based on Experience of the Gene Therapy Developer
- Figure 21.1 Big Pharma Players: Top Pharmaceutical Companies (Heat Map Representation)
- Figure 21.2 Big Pharma Players: Analysis by Therapeutic Area
- Figure 21.3 Big Pharma Players: Analysis by Type of Vector Used
- Figure 21.4 Big Pharma Players: Analysis by Type of Therapy
- Figure 21.5 Big Pharma Players: Analysis by Type of Gene Delivery Method Used
- Figure 21.6 Spider Web Analysis: Pipeline Strength
- Figure 21.7 Spider Web Analysis: Mergers and Acquisitions
- Figure 21.8 Spider Web Analysis: Funding and Investments
- Figure 21.9 Spider Web Analysis: Clinical Trials
- Figure 21.10 Spider Web Analysis: Technologies
- Figure 21.11 Spider Web Analysis: Patents
- Figure 21.12 Spider Web Analysis: Novartis
- Figure 21.13 Spider Web Analysis: Takeda Pharmaceutical
- Figure 21.14 Spider Web Analysis: Roche
- Figure 21.15 Spider Web Analysis: Merck
- Figure 21.16 Spider Web Analysis: Pfizer
- Figure 21.17 Spider Web Analysis: Johnson & Johnson
- Figure 21.18 Spider Web Analysis: AbbVie
- Figure 21.19 Spider Web Analysis: Bristol Myers Squibb
- Figure 21.20 Spider Web Analysis: AstraZeneca
- Figure 21.21 Spider Web Analysis: Sanofi
- Figure 22.1 Global Demand for Gene Therapies, till 2035 (in terms of number of patients)
- Figure 22.2 Global Demand for Gene Therapies: Distribution by Stage of Development (in terms of number of patients)
- Figure 22.3 Global Demand for Gene Therapies: Distribution by Therapeutic Area (in terms of number of patients)
- Figure 22.4 Global Demand for Gene Therapies: Distribution by Type of Therapy (in terms of number of patients)
- Figure 22.5 Global Demand for Gene Therapies: Distribution by Type of Gene Delivery Method (in terms of number of patients)
- Figure 22.6 Global Demand for Gene Therapies: Distribution by Geography (in terms of Number of Patients)
- Figure 23.1 Gene Therapy: Market Drivers
- Figure 23.2 Gene Therapy: Market Restraints
- Figure 23.3 Gene Therapy: Market Opportunities
- Figure 23.4 Gene Therapy: Market Challenges
- Figure 24.1 Global Gene Therapy Market, till 2035 (USD Billion)
- Figure 24.2 Global Gene Therapy Market, till 2035: Conservative Scenario (USD Billion)
- Figure 24.3 Global Gene Therapy Market, till 2035: Optimistic Scenario (USD Billion)
- Figure 25.1 Gene Therapy Market: Distribution by Therapeutic Area, 2024, 2029 and 2035
- Figure 25.2 Gene Therapy Market for Muscle Disorders, till 2035 (USD Billion)
- Figure 25.3 Gene Therapy Market for Hematological Disorders, till 2035 (USD Billion)
- Figure 25.4 Gene Therapy Market for Dermatological Disorders, till 2035 (USD Billion)
- Figure 25.5 Gene Therapy Market for Oncological Disorders, till 2035 (USD Billion)
- Figure 25.6 Gene Therapy Market for Genetic Disorders, till 2035 (USD Billion)
- Figure 25.7 Gene Therapy Market for Ophthalmic Disorders, till 2035 (USD Billion)
- Figure 25.8 Gene Therapy Market for Metabolic Disorders, till 2035 (USD Billion)
- Figure 25.9 Gene Therapy Market for Cardiovascular Disorders, till 2035 (USD Billion)
- Figure 25.10 Gene Therapy Market for Other Disorders, till 2035 (USD Billion)
- Figure 26.1 Gene Therapy Market: Distribution by Type of Vector, 2024, 2029 and 2035
- Figure 26.2 Gene Therapy Market for Adeno-associated Virus Vectors, till 2035 (USD Billion)
- Figure 26.3 Gene Therapy Market for Herpes Simplex Virus Vectors, till 2035 (USD Billion)
- Figure 26.4 Gene Therapy Market for Lentivirus Vectors, till 2035 (USD Billion)
- Figure 26.5 Gene Therapy Market for Adenovirus Vectors, till 2035 (USD Billion)
- Figure 26.6 Gene Therapy Market for Non-viral Vectors, till 2035 (USD Billion)
- Figure 26.7 Gene Therapy Market for Retrovirus Vectors, till 2035 (USD Billion)
- Figure 26.8 Gene Therapy Market for Other Viral Vectors, till 2035 (USD Billion)
- Figure 27.1 Gene Therapy Market: Distribution by Type of Therapy, 2024, 2029 and 2035
- Figure 27.2 Gene Therapy Market for Gene Augmentation, till 2035 (USD Billion)
- Figure 27.3 Gene Therapy Market for Oncolytic Immunotherapies, till 2035 (USD Billion)
- Figure 27.4 Gene Therapy Market for Gene Editing, till 2035 (USD Billion)
- Figure 27.5 Gene Therapy Market for Gene Regulation, till 2035 (USD Billion)
- Figure 27.6 Gene Therapy Market for Other Therapies, till 2035 (USD Billion)
- Figure 28.1 Gene Therapy Market: Distribution by Type of Gene Delivery Method, 2024, 2029 and 2035
- Figure 28.2 Gene Therapy Market for In vivo Gene Delivery, till 2035 (USD Billion)
- Figure 28.3 Gene Therapy Market for Ex vivo Gene Delivery, till 2035 (USD Billion)
- Figure 29.1 Gene Therapy Market: Distribution by Route of Administration, 2024, 2029 and 2035
- Figure 29.2 Gene Therapy Market for Intravenous Route, till 2035 (USD Billion)
- Figure 29.3 Gene Therapy Market for Subretinal Route, till 2035 (USD Billion)
- Figure 29.4 Gene Therapy Market for Intratumoral Route, till 2035 (USD Billion)
- Figure 29.5 Gene Therapy Market for Intramuscular Route, till 2035 (USD Billion)
- Figure 29.6 Gene Therapy Market for Other Routes of Administration, till 2035 (USD Billion)
- Figure 30.1 Gene Therapy Market: Distribution by Geographical Regions, 2024, 2029 and 2035
- Figure 30.2 Gene Therapy Market in North America, till 2035 (USD Billion)
- Figure 30.3 Gene Therapy Market in Europe, till 2035 (USD Billion)
- Figure 30.4 Gene Therapy Market in Asia-Pacific, till 2035 (USD Billion)
- Figure 30.5 Gene Therapy Market in Latin America, till 2035 (USD Billion)
- Figure 30.6 Gene Therapy Market in Rest of the World, till 2035 (USD Billion)
- Figure 31.1 Gene Therapy Market: Distribution by Leading Gene Therapy Developers (based on sales of gene therapies in the year 2024 (USD Billion))
- Figure 31.2 Gene Therapy Market: Distribution by Leading Gene Therapy Developers (based on the forecasted sales of gene therapies in the year 2035 (USD Billion))
- Figure 32.1 Gene Therapy Market: Adstiladrin Sales Forecast, till 2035 (USD Million)
- Figure 32.2 Gene Therapy Market: BEQVEZ Sales Forecast, till 2035 (USD Million)
- Figure 32.3 Gene Therapy Market: Casgevy Sales Forecast, till 2035 (USD Million)
- Figure 32.4 Gene Therapy Market: Elevidys Sales Forecast, till 2035 (USD Million)
- Figure 32.5 Gene Therapy Market: Gendicine Sales Forecast, till 2035 (USD Million)
- Figure 32.6 Gene Therapy Market: Hemgenix Sales Forecast, till 2035 (USD Million)
- Figure 32.7 Gene Therapy Market: Imlygic Sales Forecast, till 2035 (USD Million)
- Figure 32.8 Gene Therapy Market: Libmeldy Sales Forecast, till 2035 (USD Million)
- Figure 32.9 Gene Therapy Market: Luxturna Sales Forecast, till 2035 (USD Million)
- Figure 32.10 Gene Therapy Market: LYFGENIA Sales Forecast, till 2035 (USD Million)
- Figure 32.11 Gene Therapy Market: Neovasculgen Sales Forecast, till 2035 (USD Million)
- Figure 32.12 Gene Therapy Market: Oncorine Sales Forecast, till 2035 (USD Million)
- Figure 32.13 Gene Therapy Market: Roctavian Sales Forecast, till 2035 (USD Million)
- Figure 32.14 Gene Therapy Market: SKYSONA Sales Forecast, till 2035 (USD Million)
- Figure 32.15 Gene Therapy Market: Strimvelis Sales Forecast, till 2035 (USD Million)
- Figure 32.16 Gene Therapy Market: Upstaza Sales Forecast, till 2035 (USD Million)
- Figure 32.17 Gene Therapy Market: VYJUVEKT Sales Forecast, till 2035 (USD Million)
- Figure 32.18 Gene Therapy Market: Zolgensma Sales Forecast, till 2035 (USD Million)
- Figure 32.19 Gene Therapy Market: Zynteglo Sales Forecast, till 2035 (USD Million)
- Figure 32.20 Gene Therapy Market: AAV-RPE65 Sales Forecast, till 2035 (USD Million)
- Figure 32.21 Gene Therapy Market: ABO-102 (UX111) Sales Forecast, till 2035 (USD Million)
- Figure 32.22 Gene Therapy Market: AGTC 501 (rAAV2tYF-GRK1-RPGR) Sales Forecast, till 2035 (USD Million)
- Figure 32.23 Gene Therapy Market: Crestostimogene Grenadenorepvec (CG0070) Sales Forecast, till 2035 (USD Million)
- Figure 32.24 Gene Therapy Market: Dirloctocogene samoparvovec (SPK-8011) Sales Forecast, till 2035 (USD Million)
- Figure 32.25 Gene Therapy Market: DTx-301 Sales Forecast, till 2035 (USD Million)
- Figure 32.26 Gene Therapy Market: DTx-401 Sales Forecast, till 2035 (USD Million)
- Figure 32.27 Gene Therapy Market: Generx (Ad5FGF-4) Sales Forecast, till 2035 (USD Million)
- Figure 32.28 Gene Therapy Market: Giroctocogene fitelparvovec (SB-525 / PF-07055480) Sales Forecast, till 2035 (USD Million)
- Figure 32.29 Gene Therapy Market: Hologene 5 Sales Forecast, till 2035 (USD Million)
- Figure 32.30 Gene Therapy Market: INVOSSA (TG-C) Sales Forecast, till 2035 (USD Million)
- Figure 32.31 Gene Therapy Market: LUMEVOQ Sales Forecast, till 2035 (USD Million)
- Figure 32.32 Gene Therapy Market: NFS-01 (rAAV2-ND4) Sales Forecast, till 2035 (USD Million)
- Figure 32.33 Gene Therapy Market: NTLA-2001 Sales Forecast, till 2035 (USD Million)
- Figure 32.34 Gene Therapy Market: Olvi-Vec (Olvimulogene nanivacirepvec) Sales Forecast, till 2035 (USD Million)
- Figure 32.35 Gene Therapy Market: ProstAtak Sales Forecast, till 2035 (USD Million)
- Figure 32.36 Gene Therapy Market: pz-cel (Prademagene zamikeracel / EB-101) Sales Forecast, till 2035 (USD Million)
- Figure 32.37 Gene Therapy Market: RGX-121 Sales Forecast, till 2035 (USD Million)
- Figure 32.38 Gene Therapy Market: RGX-314 Sales Forecast, till 2035 (USD Million)
- Figure 32.39 Gene Therapy Market: VGX-3100 Sales Forecast, till 2035 (USD Million)
- Figure 33.1 Gene Editing: Key Application Areas
- Figure 33.2 Emerging Gene Editing Platforms
- Figure 34.1 Viral Vectors: Key Manufacturing Steps
- Figure 35.1 Steps Involved in the Gene Therapy Supply Chain
- Figure 35.2 Key Responsibilities of Stakeholders Involved in Gene Therapies Supply Chain
- Figure 35.3 Key Steps Involved in the Implementation of a Supply Chain Strategy
- Figure 35.4 Comparison of Logistics Processes for Autologous and Allogeneic Therapies
- Figure 35.5 Global Regulatory Authorities for Gene Therapy Supply Chain
- Figure 35.6 Overview of Supply Chain Orchestration Platform
- Figure 37.1 Conclusion: Overall Market Landscape (I / II)
- Figure 37.2 Conclusion: Overall Market Landscape (II / II)
- Figure 37.3 Conclusion: Developer Landscape
- Figure 37.4 Conclusion: Patent Analysis
- Figure 37.5 Conclusion: Mergers and Acquisitions
- Figure 37.6 Conclusion: Funding and Investment Analysis
- Figure 37.7 Conclusion: Clinical Trial Analysis
- Figure 37.8 Conclusion: Demand Analysis
- Figure 37.9 Conclusion: Market Sizing and Opportunity Analysis (I / II)
- Figure 37.10 Conclusion: Market Sizing and Opportunity Analysis (II / II)
 基因治療合作與授權協議:2016-2025
 基因治療市場機會、成長促進因素、產業趨勢分析及預測(2024-2032年)
 北美、歐洲和亞太地區基因治療細胞培養基市場規模、佔有率和趨勢分析報告:按產品類型、載體類型、最終用戶、地區和細分市場預測(2026-2033 年)
 基因治療市場按載體類型、治療方法、目標基因組、遞送方法、給藥途徑、患者類型、治療領域和最終用戶分類——全球預測 2025-2032全球基因治療培養基市場:市場規模、佔有率和趨勢分析(按產品、載體類型、最終用途和地區分類),細分市場預測(2026-2033 年)
 基因治療市場
 細胞·基因治療工具
 2032 年端粒基因治療市場預測:按治療類型、給藥方式、發展階段、載體類型、疾病適應症、應用、最終用戶和地區進行的全球分析GMP級細胞培養基市場(依產品類型、成分、形式、細胞類型和應用)-2025-2030年全球預測
 全球基因治療市場 - 2025 年至 2030 年預測