


 |
市場調查報告書
商品編碼
1616886
細胞治療製造市場:各細胞治療類型,細胞來源,各產業規模,各製造商類型,各地區:到2035年前的產業趨勢與全球預測Cell Therapy Manufacturing Market by Type of Cell Therapy, Source of Cells, Scale of Operation, Type of Manufacturer and Geography : Industry Trends and Global Forecasts, Till 2035 |
||||||
全球細胞療法製造市場規模預計將從目前的 49 億美元增長到 2035 年的 138.3 億美元,到 2035 年的預測期間複合年增長率為 9.90%。
細胞療法的最新進展,以及 FDA 批准的幾種細胞療法,凸顯了這些創新療法在治療癌症、罕見疾病和慢性疾病方面的潛力。因此,醫療保健部門越來越重視這種有前景的治療方法。值得注意的是,目前不同地區正在進行超過 1,930 項臨床試驗,研究細胞療法治療各種疾病。此外,幾種商業化的細胞療法已成為醫療保健行業最暢銷的藥物。例如,Gilead Sciences 報告 Yescarta® 年銷售額超過 15 億美元。鑑於越來越多的證據支持細胞療法的臨床益處和治療潛力,利害關係人的焦點現在轉向優化細胞療法的製造流程。目前,有超過260家工業和非工業公司涉足細胞治療製造業。值得注意的是,超過 50% 的細胞療法製造業位於美國。
細胞療法製造市場是由各個利益相關者不斷努力降低與製造相關的複雜性所推動的,並且對此類療法進步的重視預計將在未來實現健康成長。細胞療法相對較高的療效引起了各大製藥公司對該市場日益濃厚的興趣和參與。這對於細胞療法的日益普及發揮關鍵作用。
本報告提供全球細胞治療製造市場相關調查,提供市場概要,以及各細胞治療類型,細胞來源,各產業規模,各製造商類型,各地區的趨勢,及加入此市場的主要企業簡介等資訊。
目錄
第1章 序文
第2章 調查手法
第3章 經濟以及其他的計劃特有的考慮事項
第4章 摘要整理
第5章 簡介
第6章 細胞治療廠商(產業參與企業):市場形勢
第7章 細胞治療廠商(非前世的業緣界參與企業):市場形勢
第8章 法規情形
第9章 課題克服的藍圖
第10章 細胞治療製造的自動化技術
第11章 企業簡介:產業參與企業
第12章 企業簡介:產業外企業
第13章 細胞治療製造的非營利團體
第14章 臨床試驗的分析
第15章 夥伴關係和合作
第16章 最近的擴張
第17章 大型製藥公司的配合措施
第18章 容量分析
第19章 需求分析
第20章 原價分析
第21章 是製造還是購買意思決策架構
第22章 細胞治療製造組織的總持有成本
第23章 全球細胞治療製造市場
第24章 細胞治療製造市場(各細胞治療類型)
第25章 細胞治療製造市場(細胞來源)
第26章 細胞治療製造市場(各產業規模)
第27章 細胞治療製造市場(各製造商類型)
第28章 細胞治療製造市場(各地區)
第29章 SWOT分析
第30章 調查分析
第31章 結論
第32章 執行洞察
- 章概要
- Invetech
- John Goldman Centre for Cellular Therapy, Imperial College London
- Cellistic
- FamiCord
- GenCure
- Japan Tissue Engineering
- Medace
- Laboratory For Cell and Gene Medicine, University of Stanford
- Sumitomo Pharma
- RoslinCT
- Discovery Life Sciences
- Glycostem Therapeutics
- Bio Elpida
- Gracell Biotechnologies
- Kadimastem
- RoslinCT
- University of Minnesota
- Lion TCR
- Center for Commercialization of Cancer Immunotherapy/C3i
- Waisman Biomanufacturing
- Yposkesi
- Cell Therapies
- CiMaas
第33章 附錄1:表格形式的資料
第34章 附錄2:企業·團體一覽
CELL THERAPY MANUFACTURING MARKET: OVERVIEW
As per Roots Analysis, the global cell therapy manufacturing market is estimated to grow from USD 4.90 billion in the current year to USD 13.83 billion by 2035, at a CAGR of 9.90% during the forecast period, till 2035.
The market sizing and opportunity analysis has been segmented across the following parameters:
Type of Cell Therapy
- T Cell Therapies
- NK Cell Therapies
- Dendritic Cell Therapies
- Stem Cell Therapies
Source of Cells
- Autologous
- Allogeneic
- Unspecified
Scale of Operation
- Clinical
- Commercial
Type of Manufacturer
- In-house Manufacturing
- Contract Manufacturing Organization
Key Geographical Regions
- North America
- Europe
- Asia-Pacific
- Rest of the World
CELL THERAPY MANUFACTURING MARKET: GROWTH AND TRENDS
Recent advancements in cellular therapies, along with several FDA-approved cell therapies, highlight the potential of these innovative therapies for treating cancer, rare diseases, and chronic illnesses. As a result, the healthcare sector is increasingly prioritizing this promising therapeutic approach. It is worth noting that more than 1,930 clinical trials are currently underway to investigate cell therapies for the treatment of a wide range of diseases, across different geographies. Moreover, several commercialized cell therapies have emerged as top selling drugs in the healthcare industry. For example, Gilead Sciences reported that Yescarta(R) has achieved annual sales surpassing USD 1.5 billion. Given the substantial evidence supporting the clinical advantages and therapeutic potential of cellular therapies, the focus of stakeholders has now shifted to optimizing the cell therapy manufacturing process. At present, over 260 industry and non-industry players are engaged in the cell therapy manufacturing industry. Notably, over 50% of the organizations in the cell therapy manufacturing industry are based in the US.
Given the continuous efforts of various stakeholders to ease the manufacturing related complexities, and a heightened emphasis on the advancement of such therapies, we anticipate a healthy growth in the cell therapy manufacturing market in the foreseen future. Owing to the relatively high efficacy of cell therapies, there is an increased interest and involvement of the big pharma players in this market. This has played a crucial role in the increasing adoption of cell therapies.
CELL THERAPY MANUFACTURING MARKET: KEY INSIGHTS
The report delves into the current state of the cell therapy manufacturing market and identifies potential growth opportunities within the industry. Some key findings from the report include:
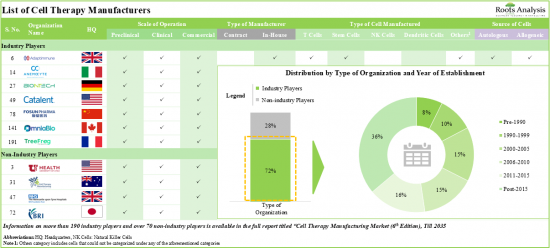
1. Presently, over 265 industry and non-industry stakeholders are engaged in cell therapy manufacturing; more than 70% of these are industry players, with the required capability to manufacture various types of cells.
2. Immune cells and stem cells are the most prominent type of cells being manufactured by stakeholders in this industry; over 60% of the players operate at preclinical, clinical and commercial scales of operation.
3. More than 70 automation technologies are currently available for the manufacturing of cell therapies to minimize manual interventions; this is likely to attract the interest of stakeholders in the cell therapy domain.
4. In the past few years, the number of clinical studies has increased at an annualized rate of nearly 10% across the world; majority of the clinical studies are evaluating cell therapies in phase I studies.
5. The rise in partnership activity in this domain highlights the growing interest of players in the cell therapy manufacturing market; majority of the deals have been inked for the clinical manufacturing of T cell therapies.
6. To gain a competitive edge and establish themselves as one-stop shops, stakeholders are actively consolidating their capabilities related to cell therapy manufacturing through mergers and acquisitions.
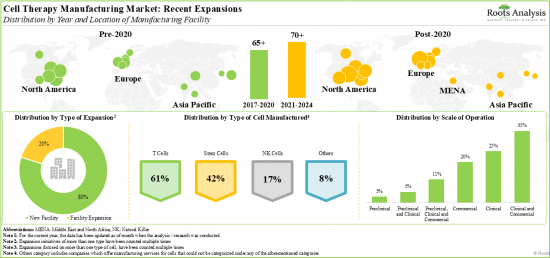
7. 80% of the industry players have expanded their existing capacities and capabilities through the establishment of new facilities; among these more than 40% of facilities are dedicated to the manufacturing of T cells.
8. Nearly 50% of the big pharma initiatives have been undertaken for the purpose of expanding their portfolio and capabilities through partnerships and collaborations; among these, 70% initiatives were undertaken post-2019.
9. More than 70% of the current installed cell therapy manufacturing capacity (in terms of number of cleanrooms) is presently available with industry players; maximum capacity is installed in facilities based in North America.
10. In 2035, more than 45% of the clinical demand for cell therapies is likely to be generated by T cell therapies, including CAR-T, TCR and TIL therapies, for the treatment of patients suffering from various disorders.
11. Owing to the increased disease burden and shift in patient preferences towards tailored cell therapies, the market is poised to witness substantial growth in the next decade.
12. The cell therapy manufacturing domain is poised to grow at a CAGR of 10%; the opportunity is well distributed across different types of cell therapies, sources of cells, scale of operation, type of manufacturer and geography.
CELL THERAPY MANUFACTURING MARKET: KEY SEGMENTS
Currently, T Cell Therapy Holds Maximum Share of the Cell Therapy Manufacturing Market
Based on the type of cell therapy, the market is segmented into T cell therapies, NK cell therapies, dendritic cell therapies and stem cell therapies. It is worth highlighting that the market for dendritic cell therapies is likely to grow at a relatively faster pace (CAGR of 11.1%) in the next decade. This can be attributed to high effectiveness of dendritic cell therapies in treating oncological disorders.
At Present, Autologous Source of Cell Market Segment Captures the Largest Market Share of the Overall Cell Therapy Manufacturing Market
Based on the source of cell, the market is segmented into autologous, allogeneic, and unspecified sources. It is worth highlighting that autologous source of cell is likely to grow at an annualized rate of 9.8% in the next decade. This can be attributed to the fact that more than 90% of the FDA approved cell therapies are derived from the patients.
Cell Therapies Manufactured at Clinical Scale is Likely to Dominate the Cell Therapy Manufacturing Market During the Forecast Period
Based on scale of operation, the market is segmented into clinical and commercial. It is worth highlighting that the cell therapies manufactured at clinical scale capture the larger share of the market and is poised to capture 58% of the revenue share by 2035. This can be attributed to the increasing number of cell therapy pipeline candidates in clinical trial phases.
Contract Manufacturing is Likely to Dominate the Cell Therapy Manufacturing Market During the Forecast Period
Based on type of manufacturer, the market is segmented into contract manufacturing and in-house manufacturing. It is worth highlighting that, currently, contract manufacturing of cell therapies holds the larger share in the cell therapy manufacturing market. This trend is unlikely to change in the coming decade. This can be attributed to the fact that contract manufacturers offer scalability and flexibility, enabling them to quickly adapt to evolving manufacturing needs and accommodate increased production volumes. In addition, by outsourcing cell therapy manufacturing operations, the drug developers can prevent significant capital investments for the establishment of in-house manufacturing facilities
North America Accounts for the Largest Share of the Market
Based on key geographical regions, the market is segmented into North America, Europe, Asia-Pacific and Rest of the World. It is worth highlighting that, over the years, the market in Asia-Pacific is expected to grow at a higher CAGR.
Example Players in the Cell Therapy Manufacturing Market
- AGC Biologics
- BioNTech Innovative Manufacturing Services
- Cell and Gene Therapy Catapult
- Cell Therapies
- Center for Cell and Gene Therapy, Baylor College of Medicine
- Centre for Cell Manufacturing Ireland, National University of Ireland
- Charles River Laboratories
- Clinical Cell and Vaccine Production Facility, University of Pennsylvania
- FUJIFILM Cellular Dynamics
- Guy's and St. Thomas' GMP Facility, Guy's Hospital
- KBI Biopharma
- Laboratory for Cell and Gene Medicine, Stanford University
- Lonza
- MEDINET
- Minaris Regenerative Medicine
- Molecular and Cellular Therapeutics, University of Minnesota
- Newcastle Cellular Therapies Facility, Newcastle University
- Nikon CeLL Innovation
- Rayne Cell Therapy Suite, King's College London
- RoslinCT
- Scottish National Blood Transfusion Services Cellular Therapy Facility, Scottish Centre for Regenerative Medicine
- Sydney Cell and Gene Therapy
- Thermo Fisher Scientific
- WuXi AppTec
Primary Research Overview
The opinions and insights presented in this study were influenced by discussions conducted with multiple stakeholders. The research report features detailed transcripts of interviews held with the following industry stakeholders:
- Marketing Manager, Cell Therapy, Invetech
- Director, Imperial College London
- Marketing Director, Cellistic
- Chief Commercial Officer and Executive Vice-President, FamiCord
- Senior Director of Sales Advanced Therapies, GenCure
- Business Administration Department Manager, Japan Tissue Engineering
- Chief Business Officer, Medace
- Director of Finance and Facility Operations, Laboratory for Cell and Gene Medicine, University of Stanford
- Senior Director, Sumitomo Pharma
- Chief Executive Officer, RoslinCT
- Chief Technical Officer, Cell and Gene Therapy, Discovery Life Sciences
- Chief Executive Officer, Glycostem Therapeutics
- General Manager, Bio Elpida
- Chief Executive Officer, Gracell Biotechnologies
- Executive VP Research and Development, Kadimastem
- Ex-Business Development Manager, Roslin CT
- Professor and American Red Cross Chair in Transfusion Medicine, University of Minnesota
- Ex- Co-Founder and Chief Executive Officer, Lion TCR
- Ex-Manager, Business Development & Operations-cGMP Manufacturing Unit, C3i Center for Commercialization of Cancer Immunotherapy
- Manager of Business Development, Waisman Biomanufacturing
- Ex-Department Leader, Cell Therapy Innovation and Development, Yposkesi
- Ex-Chief Executive Officer, Cell Therapies
- Chief Executive Officer, CiMaas
CELL THERAPY MANUFACTURING MARKET: RESEARCH COVERAGE
- The report features an in-depth analysis of the cell therapy manufacturing market, focusing on key market segments, including type of cell therapy, source of cells, scale of operation, type of manufacturer and key geographical regions.
- The report analyzes various factors such as drivers, restraints, opportunities, and challenges affecting the market growth.
- A comprehensive evaluation of companies involved in cell therapy manufacturing, considering various parameters, such as company size, year of establishment, location of headquarters, location of manufacturing facilities, type of manufacturer (in-house manufacturers and contract manufacturing organizations), type of cell manufactured (immune cells, stem cells and others), source of cells (autologous and allogeneic), scale of operation (preclinical, clinical and commercial) and additional services offered (research and development, cell culture development, cell banking, documentation, testing, packaging, supply chain management and regulatory support).
- Thorough analysis of non-industry players involved in cell therapy manufacturing, detailing information on their year of establishment, location of headquarters, location of manufacturing facilities, type of manufacturer (in-house manufacturers and contract manufacturing organizations), type of cell manufactured (immune cells, stem cells and others), source of cells (autologous and allogeneic), scale of operation (preclinical, clinical and commercial) and additional services offered (research and development, cell culture development, cell banking, documentation, testing, packaging, supply chain management and regulatory support).
- A comprehensive discussion on regulations governing cell therapy manufacturing across different regions, specifically North America (with an emphasis on the US), Europe, and Asia (highlighting Japan and China). This analysis includes a review of the various certifications and accreditations granted to manufacturing facilities by key regulatory authorities worldwide.
- An overview of the diverse roadmaps released by various global agencies in order to advance the cell therapy manufacturing process.
- An in-depth analysis of the impact of technological automation on cell therapy manufacturing aims to enhance existing production methods by utilizing closed and single-use systems. The discussion includes a strategic roadmap outlining the necessary steps for developing automation devices, bolstered by two illustrative case studies. Additionally, it offers a qualitative assessment of the costs associated with manufacturing cell-based therapies through manual versus automated processes. Furthermore, it lists organizations that provide automated technologies for manufacturing operations or assist therapy developers in automating their cell therapy production processes.
- In-depth profiles of key industry players in cell therapy manufacturing market, focusing on company overviews, service portfolio, manufacturing capabilities and facilities, recent developments, and an informed future outlook.
- In-depth profiles of key non-industry players in cell therapy manufacturing market, focusing on organization overviews, service portfolio and manufacturing facilities.
- A comprehensive overview of non-profit organizations engaged in the manufacturing of cell therapies, including a list of organizations actively involved in the development and production of cell-based therapies across various regions. This discussion will also highlight different international and national societies dedicated to disseminating knowledge about advancements in these therapies to the broader community.
- Examination of completed, ongoing, and planned clinical studies based on parameters like trial registration year, enrolled patient population, trial status, trial phase, type of sponsor / collaborator, patient segment, study design, most active players (in terms of number of clinical trial conducted) and geographical distribution of trials.
- An analysis of partnerships established in this sector, since 2016, based on several relevant parameters, such as the year of partnership, type of partnership, type of cells manufactured, scale of operation, most active players (in terms of number of partnerships) and geographical distribution.
- An examination of the different expansion efforts made by service providers in this field to enhance their cell therapy manufacturing capabilities, since 2017. This analysis considers various factors, including the year of expansion, type of expansion, type of cells produced, scale of operations, location of the expanded manufacturing facilities and the most active companies based on the number of expansion initiatives undertaken.
- Assessment of the various cell therapy manufacturing focused initiatives undertaken by big pharma players, based on several relevant parameters, such as number of initiatives, year of initiative, purpose of initiative, type of initiative, scale of operation and type of cell manufactured.
- Estimation of global cell-based therapies manufacturing capacity, derived from data provided by various industry and non-industry sources in the public domain. This analysis emphasizes the distribution of the available capacity (in terms of cleanroom area and number of cleanrooms) on the basis of scale of operation (preclinical, clinical and commercial), and key geographical regions (North America, Europe, Asia Pacific and Rest of the World).
- Informed estimates of the annual commercial and clinical demand for cell therapies (in terms of number of patients), based on type of cell therapy and key geographical regions.
- An in-depth examination of the various factors that may impact the pricing of cell-based therapies, highlights the different models and strategies used by manufacturers to establish the prices of their proprietary products.
- A qualitative analysis that highlights the various factors that need to be taken into consideration by cell therapy developers, while deciding whether to manufacture their respective products in-house or engage the services of a CMO.
- A comprehensive total cost of ownership analysis for cell therapy manufacturing organizations, categorized by company size, spanning 20 years.
KEY QUESTIONS ANSWERED IN THIS REPORT
- How many companies are currently engaged in this market?
- Which are the leading CDMOs / CMOs in this market?
- What kind of partnership models are commonly adopted by industry stakeholders?
- What kinds of expansion initiatives have been undertaken by industry stakeholders?
- What are the factors that are likely to influence the evolution of this market?
- What is the current and future market size?
- What is the CAGR of this market?
- How is the current and future market opportunity likely to be distributed across key market segments?
REASONS TO BUY THIS REPORT
- The report provides a comprehensive market analysis, offering detailed revenue projections of the overall market and its specific sub-segments. This information is valuable to both established market leaders and emerging entrants.
- Stakeholders can leverage the report to gain a deeper understanding of the competitive dynamics within the market. By analyzing the competitive landscape, businesses can make informed decisions to optimize their market positioning and develop effective go-to-market strategies.
- The report offers stakeholders a comprehensive overview of the market, including key drivers, barriers, opportunities, and challenges. This information empowers stakeholders to stay abreast of market trends and make data-driven decisions to capitalize on growth prospects.
ADDITIONAL BENEFITS
- Complimentary PPT Insights Packs
- Complimentary Excel Data Packs for all Analytical Modules in the Report
- 10% Free Content Customization
- Detailed Report Walkthrough Session with Research Team
- Free Updated report if the report is 6-12 months old or older
TABLE OF CONTENTS
1. PREFACE
- 1.1. Introduction
- 1.2. Market Share Insights
- 1.3. Key Market Insights
- 1.4. Report Coverage
- 1.5. Key Questions Answered
- 1.6. Chapter Outlines
2. RESEARCH METHODOLOGY
- 2.1. Chapter Overview
- 2.2. Research Assumptions
- 2.3. Project Methodology
- 2.4. Forecast Methodology
- 2.5. Robust Quality Control
- 2.6. Key Market Segmentations
- 2.7. Key Considerations
- 2.7.1. Demographics
- 2.7.2. Economic Factors
- 2.7.3. Government Regulations
- 2.7.4. Supply Chain
- 2.7.5. COVID Impact / Related Factors
- 2.7.6. Market Access
- 2.7.7. Healthcare Policies
- 2.7.8. Industry Consolidation
3. ECONOMIC AND OTHER PROJECT SPECIFIC CONSIDERATIONS
- 3.1. Chapter Overview
- 3.2. Market Dynamics
- 3.2.1. Time Period
- 3.2.1.1. Historical Trends
- 3.2.1.2. Current and Forecasted Estimates
- 3.2.2. Currency Coverage
- 3.2.2.1. Overview of Major Currencies Affecting the Market
- 3.2.2.2. Impact of Currency Fluctuations on the Industry
- 3.2.3. Foreign Exchange Impact
- 3.2.3.1. Evaluation of Foreign Exchange Rates and their Impact on Market
- 3.2.3.2. Strategies for Mitigating Foreign Exchange Risk
- 3.2.4. Recession
- 3.2.4.1. Historical Trends Analysis of Past Recessions and Lessons Learnt
- 3.2.4.2. Assessment of Current Economic Conditions and Potential Impact on the Market
- 3.2.5. Inflation
- 3.2.5.1. Measurement and Analysis of Inflationary Pressures in the Economy
- 3.2.5.2. Potential Impact of Inflation on the Market Evolution
- 3.2.1. Time Period
4. EXECUTIVE SUMMARY
5. INTRODUCTION
- 5.1. Chapter Overview
- 5.2. Introduction to Cell-based Therapies
- 5.2.1. Comparison of Cell-based Therapies and Other Biotechnological Products
- 5.2.2. Classification of Advanced Therapy Medicinal Products (ATMPs)
- 5.2.3. Current Market Landscape of ATMPs
- 5.3. Overview of Cell Therapy Manufacturing
- 5.4. Cell Therapy Manufacturing Models
- 5.4.1. Centralized Manufacturing
- 5.4.2. Decentralized Manufacturing
- 5.5. Scalability of Cell Therapy Manufacturing Processes
- 5.5.1. Scale-up
- 5.5.2. Scale-out
- 5.6. Types of Cell Therapy Manufacturers
- 5.7. Key Challenges for Manufacturing Cell Therapies
- 5.8. Key Factors Influencing Cell Therapy Manufacturing
- 5.8.1. Characterization
- 5.8.2. Cost of Goods
- 5.9. Automation of Cell Therapy Manufacturing Processes
- 5.10. Cell Therapy Manufacturing Supply Chain
- 5.11. Future Perspectives
6. CELL THERAPY MANUFACTURERS (INDUSTRY PLAYERS): MARKET LANDSCAPE
- 6.1. Chapter Overview
- 6.2. Industry Players: Overall Market Landscape
- 6.2.1. Analysis by Year of Establishment
- 6.2.2. Analysis by Company Size
- 6.2.3. Analysis by Location of Headquarters
- 6.2.4. Analysis by Company Size and Location of Headquarters
- 6.2.5. Analysis by Location of Manufacturing Facility
- 6.2.6. Analysis by Type of Manufacturer
- 6.2.7. Analysis by Location of Headquarters and Type of Manufacturer
- 6.2.8. Analysis by Type of Cell Manufactured
- 6.2.9. Analysis by Location of Headquarters and Type of Cell Manufactured
- 6.2.10. Analysis by Source of Cells
- 6.2.11. Analysis by Type of Cell Manufactured and Source of Cells
- 6.2.12. Analysis by Scale of Operation
- 6.2.13. Analysis by Additional Services Offered
- 6.2.14. Analysis by Company Size and Additional Services Offered
7. CELL THERAPY MANUFACTURERS (NON-INDUSTRY PLAYERS): MARKET LANDSCAPE
- 7.1. Chapter Overview
- 7.2. Non-Industry Players: Overall Market Landscape
- 7.2.1. Analysis by Year of Establishment
- 7.2.2. Analysis by Location of Headquarters
- 7.2.3. Analysis by Location of Manufacturing Facility
- 7.2.4. Analysis by Type of Manufacturer
- 7.2.5. Analysis by Location of Headquarters and Type of Manufacturer
- 7.2.6. Analysis by Type of Cell Manufactured
- 7.2.7. Analysis by Location of Headquarters and Type of Cell Manufactured
- 7.2.8. Analysis by Source of Cells
- 7.2.9. Analysis by Type of Cell Manufactured and Source of Cells
- 7.2.10. Analysis by Scale of Operation
- 7.2.11. Analysis by Additional Services Offered
8. REGULATORY LANDSCAPE
- 8.1. Chapter Overview
- 8.2. Current Scenario
- 8.2.1. Regulatory Guidelines in North America
- 8.2.2. Regulatory Guidelines in Europe
- 8.2.3. Regulatory Guidelines in Asia Pacific
- 8.2.3.1. Regulatory Guidelines in Japan
- 8.2.3.2. Regulatory Guidelines in China
- 8.2.4. Conditional Approvals
- 8.3. Regulatory Authorities for Cell Therapy Manufacturing
- 8.3.1. Cell Therapy Manufacturing (Industry Players): Regulatory Authorities
- 8.4. Summary of Guidelines for Early-Stage Manufacturing of Cell Therapies
- 8.5. Existing Challenges to Early-Stage Manufacturing of Cell Therapies
- 8.6. Variability in Regulatory Guidelines across Different Geographies
9. ROADMAPS FOR OVERCOMING CHALLENGES
- 9.1. Chapter Overview
- 9.2. Roadmap for the US
- 9.2.1. Cell Processing
- 9.2.2. Cell Preservation, Distribution and Handling
- 9.2.3. Process Automation and Data Analytics
- 9.2.4. Process Monitoring and Quality Control
- 9.2.5. Standardization and Regulatory Support
- 9.2.6. Workforce Development
- 9.2.7. Supply Chain and Logistics
- 9.3. Roadmaps for Other Geographies
- 9.3.1. Europe
- 9.3.2. Asia Pacific
10. AUTOMATION TECHNOLOGIES FOR CELL THERAPY MANUFACTURING
- 10.1. Chapter Overview
- 10.2. Automation of Cell Therapy Manufacturing Processes
- 10.2.1. Closed Systems
- 10.2.2. Single-use Systems
- 10.2.3. Modular Systems
- 10.3. Growth Drivers and Roadblocks
- 10.4. Case Studies
- 10.4.1. Roadmap to Develop an Automated Cell Manufacturing / Processing Device
- 10.4.2. Automating the Cell Therapy Manufacturing Process
- 10.5. GMP-in-a-Box
- 10.6. List of Automated and Closed Cell Therapy Processing Systems
- 10.7. Comparative Analysis of Manual and Automated Processes
11. COMPANY PROFILES: INDUSTRY PLAYERS
- 11.1. Chapter Overview
- 11.2. Service Providers in North America
- 11.2.1 AGC Biologics
- 11.2.1.1. Company Overview
- 11.2.1.2. Financial Information
- 11.2.1.3. Service Portfolio
- 11.2.1.4. Manufacturing Facilities and Capabilities
- 11.2.1.5. Recent Developments and Future Outlook
- 11.2.2. Charles River Laboratories
- 11.2.2.1. Company Overview
- 11.2.2.2 Financial Information
- 11.2.2.3. Service Portfolio
- 11.2.2.4. Manufacturing Facilities and Capabilities
- 11.2.2.5. Recent Developments and Future Outlook
- 11.2.3. FUJIFILM Cellular Dynamics
- 11.2.3.1. Company Overview
- 11.2.3.2. Service Portfolio
- 11.2.3.3. Manufacturing Facilities and Capabilities
- 11.2.3.4. Recent Developments and Future Outlook
- 11.2.4. KBI Biopharma
- 11.2.4.1. Company Overview
- 11.2.4.2. Financial Information
- 11.2.4.3. Service Portfolio
- 11.2.4.4. Manufacturing Facilities and Capabilities
- 11.2.4.5. Recent Developments and Future Outlook
- 11.2.5. Thermo Fisher Scientific
- 11.2.5.1. Company Overview
- 11.2.5.2. Financial Information
- 11.2.5.3. Service Portfolio
- 11.2.5.4. Manufacturing Facilities and Capabilities
- 11.2.5.5. Recent Developments and Future Outlook
- 11.2.6. WuXi Advanced Therapies
- 11.2.6.1. Company Overview
- 11.2.6.2. Service Portfolio
- 11.2.6.3. Manufacturing Facilities and Capabilities
- 11.2.6.4. Recent Developments and Future Outlook
- 11.2.1 AGC Biologics
- 11.3. Service Providers in Europe
- 11.3.1. BioNTech Innovative Manufacturing Services
- 11.3.1.1. Company Overview
- 11.3.1.2. Service Portfolio
- 11.3.1.3. Manufacturing Facilities and Capabilities
- 11.3.1.4. Recent Developments and Future Outlook
- 11.3.2. Cell and Gene Therapy Catapult
- 11.3.2.1. Company Overview
- 11.3.2.2. Service Portfolio
- 11.3.2.3. Manufacturing Facilities and Capabilities
- 11.3.2.4. Recent Developments and Future Outlook
- 11.3.3. Lonza
- 11.3.3.1. Company Overview
- 11.3.3.2. Financial Information
- 11.3.3.3. Service Portfolio
- 11.3.3.4. Manufacturing Facilities and Capabilities
- 11.3.3.5. Recent Developments and Future Outlook
- 11.3.4. RoslinCT
- 11.3.4.1. Company Overview
- 11.3.4.2. Service Portfolio
- 11.3.4.3. Manufacturing Facilities and Capabilities
- 11.3.4.4. Recent Developments and Future Outlook
- 11.3.1. BioNTech Innovative Manufacturing Services
- 11.4. Service Providers in Asia Pacific
- 11.4.1. Cell Therapies
- 11.4.1.1. Company Overview
- 11.4.1.2. Service Portfolio
- 11.4.1.3. Manufacturing Facilities and Capabilities
- 11.4.1.4. Recent Developments and Future Outlook
- 11.4.2. Minaris Regenerative Medicine
- 11.4.2.1. Company Overview
- 11.4.2.2. Service Portfolio
- 11.4.2.3. Manufacturing Facilities and Capabilities
- 11.4.2.4. Recent Developments and Future Outlook
- 11.4.3. MEDINET
- 11.4.3.1. Company Overview
- 11.4.3.2. Service Portfolio
- 11.4.3.3. Manufacturing Facilities and Capabilities
- 11.4.3.4. Recent Developments and Future Outlook
- 11.4.4. Nikon CeLL Innovation
- 11.4.4.1. Company Overview
- 11.4.4.2. Service Portfolio
- 11.4.4.3. Manufacturing Facilities and Capabilities
- 11.4.4.4. Recent Developments and Future Outlook
- 11.4.1. Cell Therapies
12. COMPANY PROFILES: NON-INDUSTRY PLAYERS
- 12.1. Chapter Overview
- 12.2. Center for Cell and Gene Therapy, Baylor College of Medicine
- 12.2.1. Overview
- 12.2.2. Service Portfolio
- 12.2.3. Manufacturing Facilities and Capabilities
- 12.3. Centre for Cell Manufacturing Ireland, National University of Ireland
- 12.3.1. Overview
- 12.3.2. Service Portfolio
- 12.3.3. Manufacturing Facilities and Capabilities
- 12.4. Clinical Cell and Vaccine Production Facility, University of Pennsylvania
- 12.4.1. Overview
- 12.4.2. Service Portfolio
- 12.4.3. Manufacturing Facilities and Capabilities
- 12.5. Guy's and St. Thomas' GMP Facility, Guy's Hospital
- 12.5.1. Overview
- 12.5.2. Service Portfolio
- 12.5.3. Manufacturing Facilities and Capabilities
- 12.6. Laboratory for Cell and Gene Medicine, Stanford University
- 12.6.1. Overview
- 12.6.2. Service Portfolio
- 12.6.3. Manufacturing Facilities and Capabilities
- 12.7. Molecular and Cellular Therapeutics, University of Minnesota
- 12.7.1. Overview
- 12.7.2. Service Portfolio
- 12.7.3. Manufacturing Facilities and Capabilities
- 12.8. Newcastle Cellular Therapies Facility, Newcastle University
- 12.8.1. Overview
- 12.8.2. Service Portfolio
- 12.8.3. Manufacturing Facilities and Capabilities
- 12.9. Rayne Cell Therapy Suite, King's College London
- 12.9.1. Overview
- 12.9.2. Service Portfolio
- 12.9.2. Manufacturing Facilities and Capabilities
- 12.10. Scottish National Blood Transfusion Services Cellular Therapy Facility, Scottish Centre for Regenerative Medicine
- 12.10.1. Overview
- 12.10.2. Service Portfolio
- 12.10.2. Manufacturing Facilities and Capabilities
- 12.11. Sydney Cell and Gene Therapy
- 12.11.1. Overview
- 12.11.2. Service Portfolio
- 12.11.3. Manufacturing Facilities and Capabilities
13. NON-PROFIT ORGANIZATIONS IN CELL THERAPY MANUFACTURING
- 13.1. Chapter Overview
- 13.2. Cell Therapy Manufacturing: Non-Profit Organizations
- 13.2.1. CellCAN
- 13.2.2. Cell Therapy Manufacturing Cooperative Research Center
- 13.2.3. National Cell Manufacturing Consortium (NCMC)
- 13.2.4. California Institute of Regenerative Medicine (CIRM)
- 13.3. Cell Therapy Manufacturing: International Societies
14. CLINICAL TRIAL ANALYSIS
- 14.1. Chapter Overview
- 14.2. Scope and Methodology
- 14.3. Cell Therapies: Clinical Trial Analysis
- 14.3.1. Analysis by Trial Registration Year
- 14.3.2. Analysis by Tria Registration Year and Enrolled Patient Population
- 14.3.3. Analysis by Trial Status
- 14.3.4. Analysis by Trial Registration Year and Trial Status
- 14.3.5. Analysis by Trial Phase
- 14.4.6. Analysis of Number of Clinical Trials and Enrolled Patient Population by Trial Phase
- 14.3.7. Analysis by Type of Sponsor / Collaborator
- 14.3.8. Analysis by Patient Segment
- 14.3.9. Analysis by Study Design
- 14.3.10. Most Active Players: Analysis by Number of Registered Trials
- 14.3.11. Analysis by Number of Trials and Geography
- 14.3.12. Analysis by Number of Trials, Trial Status and Geography
- 14.3.13. Analysis by Enrolled Patient Population, Trial Status and Geography
15. PARTNERSHIPS AND COLLABORATIONS
- 15.1. Chapter Overview
- 15.2. Partnership Models
- 15.3. Cell Therapy Manufacturing: List of Partnerships
- 15.3.1. Analysis by Year of Partnership
- 15.3.2. Analysis by Type of Partnership
- 15.3.3. Analysis by Year and Type of Partnership
- 15.4. Analysis by Type of Cells
- 15.5. Analysis by Scale of Operation
- 15.6. Analysis by Region
- 15.6.1. Country-wise Distribution
- 15.6.2. Continent-wise Distribution
- 15.7. Most Active Players: Analysis by Number of Partnerships
- 15.8. Cell Therapy Manufacturing: List of Mergers and Acquisitions
- 15.8.1. Analysis by Year of Agreement
- 15.8.2. Analysis by Type of Agreement
- 15.8.3. Analysis by Year of Acquisition and Type of Cells
- 15.8.4. Analysis by Region
- 15.8.4.1. Country-wise Distribution
- 15.8.4.2. Continent-wise Distribution
- 15.8.4.3. Intercontinental and Intracontinental Deals
- 15.8.5. Ownership Change Matrix
16. RECENT EXPANSIONS
- 16.1. Chapter Overview
- 16.2. Cell Therapy Manufacturing: List of Expansions
- 16.2.1. Analysis by Year of Expansion
- 16.2.2. Analysis by Type of Expansion
- 16.2.3. Analysis by Type of Cell Manufactured
- 16.2.4. Analysis by Scale of Operation
- 16.2.5. Analysis by Location of Manufacturing Facility
- 16.2.6. Analysis by Type of Expansion and Location of Manufacturing Facility
- 16.2.7. Most Active Players: Analysis by Number of Expansions
- 16.2.8. Most Active Players: Analysis by Area of Expansion
- 16.2.9. Analysis by Year and Location of Manufacturing Facility
17. BIG PHARMA INITIATIVES
- 17.1. Chapter Overview
- 17.2. List of Cell Therapy Manufacturing Focused Initiatives of Big Pharma Players
- 17.2.1. Analysis by Number of Initiatives
- 17.2.2. Analysis by Year of Initiative
- 17.2.3. Analysis by Type of Initiative
- 17.2.3.1. Analysis by Type of Partnership
- 17.2.3.2. Analysis by Type of Expansion
- 17.2.4. Analysis by Types of Cells Manufactured
- 17.2.5. Analysis by Scale of Operation
- 17.2.6. Analysis of Big Pharma Players by Year of Initiative
- 17.2.7. Analysis by Year and Type of Initiative
- 17.2.8. Analysis of Big Pharma Players by Types of Cells Manufactured
- 17.2.9. Analysis of Big Pharma Players by Scale of Operation
- 17.3. Competitive Benchmarking of Big Pharmaceutical Players
- 17.3.1. Harvey Ball Analysis: Big Pharma Initiatives Summary
- 17.3.2. Spider Web Analysis: Big Pharmaceutical Players
18. CAPACITY ANALYSIS
- 18.1. Chapter Overview
- 18.2. Industry Players: Key Assumptions and Methodology
- 18.2.1 Cell Therapy Manufacturing: Installed Global Capacity (Number of Cleanrooms)
- 18.2.1.1. Analysis by Company Size
- 18.2.1.2. Analysis by Scale of Operation
- 18.2.1.3. Analysis by Location of Manufacturing Facility
- 18.2.1.4. Analysis by Company Size and Location of Manufacturing Facility
- 18.2.1.5. Analysis by Scale of Operation and Location of Manufacturing Facility
- 18.2.2. Cell Therapy Manufacturing: Installed Global Capacity (Cleanroom Area)
- 18.2.2.1. Analysis by Company Size
- 18.2.2.2. Analysis by Scale of Operation
- 18.2.2.3. Analysis by Location of Manufacturing Facility
- 18.2.2.4. Analysis by Company Size and Location of Manufacturing Facility
- 18.2.2.5. Analysis by Scale of Operation and Location of Manufacturing Facility
- 18.2.1 Cell Therapy Manufacturing: Installed Global Capacity (Number of Cleanrooms)
- 18.3. Non- Industry Players: Key Assumptions and Methodology
- 18.3.1. Cell Therapy Manufacturing: Installed Global Capacity (Number of Cleanrooms)
- 18.3.1.1. Analysis by Scale of Operation
- 18.3.1.2. Analysis by Location of Manufacturing Facility
- 18.3.2. Cell Therapy Manufacturing: Installed Global Capacity (Cleanroom Area)
- 18.3.2.1. Analysis by Scale of Operation
- 18.3.2.2. Analysis by Location of Manufacturing Facility
- 18.3.1. Cell Therapy Manufacturing: Installed Global Capacity (Number of Cleanrooms)
- 18.4. Concluding Remarks
19. DEMAND ANALYSIS
- 19.1. Chapter Overview
- 19.2. Scope and Methodology
- 19.3. Global Demand for Cell Therapy Manufacturing
- 19.4. Global Clinical Demand for Cell Therapy Manufacturing
- 19.4.1. Analysis by Type of Cell Therapy
- 19.4.2. Analysis by Geography
- 19.5. Global Commercial Demand for Cell Therapy Manufacturing
- 19.5.1. Commercial Demand: Analysis by Type of Cell Therapy
- 19.5.2. Commercial Demand: Analysis by Geography
20. COST PRICE ANALYSIS
- 20.1. Chapter Overview
- 20.2. Factors Contributing to the High Price of Cell Therapies
- 20.3. Pricing Models for Cell Therapies
- 20.3.1. Based on Associated Costs for T-Cell Therapies
- 20.3.2. Based on Associated Costs for Stem Cell Therapies
- 20.3.3. Based on Availability of Competing Products
- 20.3.4. Based on Target Patient Segment
- 20.3.5. Based on the Opinions of Industry Experts
- 20.4. Cell Therapy Cost Optimization
- 20.4.1. Role of Cost of Goods Sold
- 20.4.2. Role of Automation
- 20.5. Role of Cell Therapy Contract Manufacturing Organizations
- 20.6. Reimbursement-related Considerations for Cell Therapies
- 20.6.1. Case Study: The National Institute for Health and Care Excellence's (NICE) Appraisal of CAR-T Therapies
21. MAKE VERSUS BUY DECISION MAKING FRAMEWORK
- 21.1. Chapter Overview
- 21.2. Assumptions and Key Parameters
- 21.3. Cell Therapy Manufacturing: Make versus Buy Decision Making
- 21.3.1. Scenario 1
- 21.3.2. Scenario 2
- 21.3.3. Scenario 3
- 21.3.4. Scenario 4
- 21.4. Concluding Remarks
22. TOTAL COST OF OWNERSHIP FOR CELL THERAPY MANUFACTURING ORGANIZATIONS
- 22.1. Chapter Overview
- 22.2. Key Parameters
- 22.3. Assumptions and Methodology
- 22.4. Sample Dataset for the Estimation of Total Cost of Ownership
- 22.5. Total Cost of Ownership for Mid-sized Cell Therapy Manufacturing Organizations, Y0-Y20
- 22.6. Total Cost of Ownership for Mid-sized Cell Therapy Manufacturing Organizations: Analysis by CAPEX and OPEX, Y0 and Y20
- 22.6.1. Total Cost of Ownership for Mid-sized Cell Therapy Manufacturing Organizations: Analysis by CAPEX, Y0
- 22.6.2. Total Cost of Ownership for Mid-sized Cell Therapy Manufacturing Organizations: Analysis by OPEX, Y1-Y20
23. GLOBAL CELL THERAPY MANUFACTURING MARKET
- 23.1. Chapter Overview
- 23.2. Scope of the Forecast
- 23.3. Input Data and Key Assumptions
- 23.4. Forecast Methodology
- 23.5. Global Cell Therapy Manufacturing Market, Historical Trends (since 2022) and Forecasted Estimates (till 2035)
- 23.5.1. Scenario Analysis
- 23.5.1.1 Conservative Scenario
- 23.5.1.2. Optimistic Scenario
- 23.5.1. Scenario Analysis
- 23.6. Key Market Segmentations
24. CELL THERAPY MANUFACTURING MARKET, BY TYPE OF CELL THERAPY
- 24.1. Chapter Overview
- 24.2. Key Assumptions and Methodology
- 24.3. Cell Therapy Manufacturing Market: Distribution by Type of Cell Therapy, 2022, 2024 and 2035
- 24.3.1. T Cell Therapies: Historical Trends (since 2022) and Forecasted Estimates (till 2035)
- 24.3.1.1. CAR-T Cell Therapies: Historical Trends (since 2022) and Forecasted Estimates (till 2035)
- 24.3.1.2. TCR Cell Therapies: Historical Trends (since 2022) and Forecasted Estimates (till 2035)
- 24.3.1.3. TIL Cell Therapies: Historical Trends (since 2022) and Forecasted Estimates (till 2035)
- 24.3.2 Stem Cell Therapies: Historical Trends (since 2022) and Forecasted Estimates (till 2035)
- 24.3.3. Dendritic Cell Therapies: Historical Trends (since 2022) and Forecasted Estimates (till 2035)
- 24.3.4. NK Cell Therapies: Historical Trends (since 2022) and Forecasted Estimates (till 2035)
- 24.3.1. T Cell Therapies: Historical Trends (since 2022) and Forecasted Estimates (till 2035)
- 24.4. Data Triangulation and Validation
25. CELL THERAPY MANUFACTURING MARKET, BY SOURCE OF CELLS
- 25.1 Chapter Overview
- 25.2. Key Assumptions and Methodology
- 25.3. Cell Therapy Manufacturing Market: Distribution by Source of Cells, 2022, 2024 and 2035
- 25.3.1 Autologous Source of Cells: Historical Trends (since 2022) and Forecasted Estimates (till 2035)
- 25.3.2 Allogeneic Source of Cells: Historical Trends (since 2022) and Forecasted Estimates (till 2035)
- 25.3.3 Unspecified Source of Cells: Historical Trends (since 2022) and Forecasted Estimates (till 2035)
- 25.4. Data Triangulation and Validation
26. CELL THERAPY MANUFACTURING MARKET, BY SCALE OF OPERATION
- 26.1. Chapter Overview
- 26.2. Key Assumptions and Methodology
- 26.3. Cell Therapy Manufacturing Market: Distribution by Scale of Operation, 2022, 2024 And 2035
- 26.3.1. Clinical Scale: Historical Trends (since 2022) and Forecasted Estimates (till 2035)
- 26.4. Clinical Cell Therapy Manufacturing Market, by Type of Therapy
- 26.4.1. Clinical Scale Manufacturing Market for T Cell Therapies, till 2035
- 26.4.1.1. Clinical Scale Manufacturing Market for T Cell Therapies: Distribution by Type of Therapy, till 2035
- 26.4.1.2. Clinical Scale Manufacturing Market for T Cell Therapies: Distribution by Source of Cells, till 2035
- 26.4.1.3. Clinical Scale Manufacturing Market for T Cell Therapies: Distribution by Geography, till 2035
- 26.4.2. Clinical Scale Manufacturing Market for NK Cell Therapies, till 2035
- 26.4.2.1. Clinical Scale Manufacturing Market for NK Cell Therapies: Distribution by Source of Cells, till 2035
- 26.4.2.2. Clinical Scale Manufacturing Market for NK Cell Therapies: Distribution by Geography, till 2035
- 26.4.3. Clinical Scale Manufacturing Market for Dendritic Cell Therapies, till 2035
- 26.4.3.1. Clinical Scale Manufacturing Market for Dendritic Cell Therapies: Distribution by Source of Cells, till 2035
- 26.4.3.2. Clinical Scale Manufacturing Market for Dendritic Cell Therapies: Distribution by Geography, till 2035
- 26.4.4. Clinical Scale Manufacturing Market for Stem Cell Therapies, till 2035
- 26.4.4.1. Clinical Scale Manufacturing Market for Stem Cell Therapies: Distribution by Source of Cells, till 2035
- 26.4.4.2. Clinical Scale Manufacturing Market for Stem Cell Therapies: Distribution by Geography, till 2035
- 26.4.5. Commercial Scale: Historical Trends (since 2022) And Forecasted Estimates (till 2035)
- 26.4.1. Clinical Scale Manufacturing Market for T Cell Therapies, till 2035
- 26.5. Commercial Cell Therapy Manufacturing Market, by Type of Cell Therapy
- 26.5.1. Commercial Scale Manufacturing Market for T Cell Therapies, till 2035
- 26.5.1.1. Commercial Scale Manufacturing Market for T Cell Therapies: Distribution by Type of Therapy, till 2035
- 26.5.1.2. Commercial Scale Manufacturing Market for T Cell Therapies: Distribution by Source of Cells, till 2035
- 26.5.1.3. Commercial Scale Manufacturing Market for T Cell Therapies: Distribution by Geography, till 2035
- 26.5.2. Commercial Scale Manufacturing Market for Dendritic Cell Therapies, till 2035
- 26.5.2.1. Commercial Scale Manufacturing Market for Dendritic Cell Therapies: Distribution by Geography, till 2035
- 26.5.3. Commercial Scale Manufacturing Market for Stem Cell Therapies, till 2035
- 26.5.3.1. Commercial Scale Manufacturing Market for Stem Cell Therapies: Distribution by Source of Cells, till 2035
- 26.5.3.2. Commercial Scale Manufacturing Market for Stem Cell Therapies, till 2035: Distribution by Geography
- 26.5.1. Commercial Scale Manufacturing Market for T Cell Therapies, till 2035
- 26.6. Data Triangulation and Validation
27. CELL THERAPY MANUFACTURING MARKET, BY TYPE OF MANUFACTURER
- 27.1. Chapter Overview
- 27.2. Key Assumptions and Methodology
- 27.3. Cell Therapy Manufacturing Market: Distribution by Type of Manufacturer, 2022, 2024 And 2035
- 27.3.1. In-House Manufacturers: Historical Trends (since 2022) and Forecasted Estimates (till 2035)
- 27.3.2. Contract Manufacturing Organizations: Historical Trends (since 2022) and Forecasted Estimates (till 2035)
- 27.4. Data Triangulation and Validation
28. CELL THERAPY MANUFACTURING MARKET, BY GEOGRAPHY
- 28.1. Chapter Overview
- 28.2. Key Assumptions and Methodology
- 28.3. Cell Therapy Manufacturing Market: Distribution by Geography, 2022, 2024 And 2035
- 28.3.1. North America: Historical Trends (since 2022) and Forecasted Estimates (till 2035)
- 28.3.2. Europe: Historical Trends (since 2022) and Forecasted Estimates (till 2035)
- 28.3.3. Asia Pacific: Historical Trends (since 2022) and Forecasted Estimates (till 2035)
- 28.3.4. Rest of the World: Historical Trends (since 2022) And Forecasted Estimates (till 2035)
- 28.4. Data Triangulation and Validation
29. SWOT ANALYSIS
- 29.1. Chapter Overview
- 29.2. Strengths
- 29.3. Weaknesses
- 29.4. Opportunities
- 29.5. Threats
- 29.6. Comparison of SWOT Factors
30. SURVEY ANALYSIS
- 30.1. Chapter Overview
- 30.2. Analysis by Designation of Respondents
- 30.3. Analysis by Type of Cell Therapy
- 30.4. Analysis by Scale of Operation
- 30.5. Analysis by Source of Cells
- 30.6. Analysis by Type of Cell Culture System Used
- 30.7. Analysis by Availability of Fill / Finish Services
31. CONCLUDING REMARKS
32. EXECUTIVE INSIGHTS
- 32.1. Chapter Overview
- 32.2. Invetech
- 32.2.1. Company Snapshot
- 32.2.2. Interview Transcript: Kelly Pisarev Lord (Marketing Manager, Cell Therapy)
- 32.3. John Goldman Centre for Cellular Therapy, Imperial College London
- 32.3.1. Organization Snapshot
- 32.3.2. Interview Transcript: Sandra Loaiza (Director)
- 32.4. Cellistic
- 32.4.1. Company Snapshot
- 32.4.2. Interview Transcript: Rikke Lyngaa (Marketing Director)
- 32.5. Chapter Overview
- 32.5. FamiCord
- 32.5.1. Company Snapshot
- 32.5.2. Interview Transcript: Tomasz Baran (Management Board Vice-President)
- 32.6. GenCure
- 32.6.1. Company Snapshot
- 32.6.2. Interview Transcript: Christie Malone (Senior Director of Sales Advanced Therapies) and Sophie Bardy (Vice President of Marketing)
- 32.7. Japan Tissue Engineering
- 32.7.1. Company Snapshot
- 32.7.2. Interview Transcript: Azusa Kito (Business Administration Department Manager)
- 32.8. Medace
- 32.8.1. Company Snapshot
- 32.8.2. Interview Transcript: Kurt Gielen (Chief Business Officer)
- 32.9. Laboratory For Cell and Gene Medicine, University of Stanford
- 32.9.1. Company Snapshot
- 32.9.2. Interview Transcript: Kathryn Melsop (Director of Finance and Facility Operations)
- 32.10. Sumitomo Pharma
- 32.10.1. Company Snapshot
- 32.10.2. Interview Transcript: Takashi Yoshikawa (Senior Director)
- 32.11. RoslinCT
- 32.11.1. Company Snapshot
- 32.11.2. Interview Transcript: Peter Coleman (Chief Executive Officer)
- 32.12. Discovery Life Sciences
- 32.12.1. Company Snapshot
- 32.12.2. Interview Transcript: Dominic Clarke (Chief Technical Officer, Cell and Gene Therapy)
- 32.13. Glycostem Therapeutics
- 32.13.1. Company Snapshot
- 32.13.2. Interview Transcript: Troels Jordansen (Former Chief Executive Officer)
- 32.14. Bio Elpida
- 32.14.1. Company Snapshot
- 32.14.2. Interview Transcript: Gilles Devillers (President)
- 32.15. Gracell Biotechnologies
- 32.15.1. Company Snapshot
- 32.15.2. Interview Transcript: Wei (William) Cao (Chief Executive Officer)
- 32.16. Kadimastem
- 32.16.1. Company Snapshot
- 32.16.2. Interview Transcript: Arik Hasson (Executive Vice President Research and Development)
- 32.17. RoslinCT
- 32.17.1. Company Snapshot
- 32.17.2. Interview Transcript: Fiona Bellot (Former Business Development Manager)
- 32.18. University of Minnesota
- 32.18.1. Company Snapshot
- 32.18.2. Interview Transcript: David Mckenna (Professor and American Red Cross Chair in Transfusion Medicine)
- 32.19. Lion TCR
- 32.19.1. Company Snapshot
- 32.19.2. Interview Transcript: Victor Lietao Li, (Former Co-Founder and Chief Executive Officer)
- 32.20. Center for Commercialization of Cancer Immunotherapy / C3i
- 32.20.1. Company Snapshot
- 32.20.2. Interview Transcript: Arnaud Deladeriere (Former Manager, Business Development and Operations-cGMP Manufacturing Unit)
- 32.21. Waisman Biomanufacturing
- 32.21.1. Company Snapshot
- 32.21.2. Interview Transcript: Brian Dattilo (Director of Business Development)
- 32.22. Yposkesi
- 32.22.1. Company Snapshot
- 32.22.2. Interview Transcript: Mathilde Girard (Former Department Leader, Cell Therapy Innovation and Development)
- 32.23. Cell Therapies
- 32.23.1. Company Snapshot
- 32.23.2. Interview Transcript: Tim Oldham (Former Chief Executive Officer)
- 32.24. CiMaas
- 32.24.1. Company Snapshot
- 32.24.2. Interview Transcript: Gerard MJ Bos (Chief Executive Officer)
33. APPENDIX 1: TABULATED DATA
34. APPENDIX 2: LIST OF COMPANIES AND ORGANIZATIONS
List of Tables
- Table 5.1 Cell-based Therapies: Key Applications
- Table 5.2 Differences between Cell Therapy and Biotechnological Products
- Table 5.3 Cell-based Therapies: Commercialized Products
- Table 5.4 Assessments for Key Cell Therapy Manufacturing Steps
- Table 5.5 Advantages and Disadvantages of Centralized and Decentralized Manufacturing Models
- Table 6.1 Cell Therapy Manufacturing: List of Industry Players
- Table 6.2 Industry Players: Information on Type of Manufacturer
- Table 6.3 Industry Players: Information on Type of Cell Manufactured
- Table 6.4 Industry Players: Information on Source of Cells and Type of Cells Culture System Used
- Table 6.5 Industry Players: Information on Scale of Operation
- Table 6.6 Industry Players: Information on Additional Services Offered
- Table 7.1 Cell Therapy Manufacturing: List of Non-Industry Players
- Table 7.2 Non-Industry Players: Information on Type of Cell Manufactured
- Table 7.3 Non-Industry Players: Information on Source of Cells and Type of Cells Culture System Used
- Table 7.54 Non-Industry Players: Information on Scale of Operation
- Table 7.5 Non-Industry Players: Information on Additional Services Offered
- Table 8.1 Cell Therapy Manufacturing (Industry Players): Regulatory Authorities
- Table 8.2 Cell Therapy Manufacturing (Non-Industry Players): Regulatory Authorities
- Table 8.3 Summary of Guidelines for Early-Stage Manufacturing of Cell Therapies
- Table 9.1 Cell Therapy Manufacturing: Roadmap for the US
- Table 9.2 Cell Processing: Challenges and Strategies
- Table 9.3 Cell Preservation, Distribution and Handling: Challenges and Strategies
- Table 9.4 Process Monitoring and Quality Control: Challenges and Strategies
- Table 9.5 Standardization and Regulatory Support: Challenges and Strategies
- Table 9.6 Workforce Development: Challenges and Strategies
- Table 9.7 Supply Chain and Logistics: Challenges and Strategies
- Table 9.8 Cell Therapy Manufacturing: Roadmap for the Asia Pacific Economic Cooperation (APEC)
- Table 10.1 Cell Therapy Manufacturing: List of Automated and Closed Cell Therapy Processing Systems
- Table 11.1 Cell Therapy Manufacturing Industry Players: List of Companies Profiled
- Table 11.2 AGC Biologics: Company Snapshot
- Table 11.3 AGC Biologics: Information on Manufacturing Facilities and Capabilities
- Table 11.4 AGC Biologics: Recent Developments and Future Outlook
- Table 11.5 Charles River Laboratories: Company Snapshot
- Table 11.6 Charles River Laboratories: Information on Manufacturing Facilities and Capabilities
- Table 11.7 Charles River Laboratories: Recent Developments and Future Outlook
- Table 11.8 FUJIFILM Cellular Dynamics: Company Snapshot
- Table 11.9 FUJIFILM Cellular Dynamics: Information on Manufacturing Facilities and Capabilities
- Table 11.10 FUJIFILM Cellular Dynamics: Recent Developments and Future Outlook
- Table 11.11 KBI Biopharma: Company Snapshot
- Table 11.12 KBI Biopharma: Information on Manufacturing Facilities and Capabilities
- Table 11.13 KBI Biopharma: Recent Developments and Future Outlook
- Table 11.14 Thermo Fisher Scientific: Company Snapshot
- Table 11.15 Thermo Fisher Scientific: Information on Manufacturing Facilities and Capabilities
- Table 11.16 Thermo Fisher Scientific: Recent Developments and Future Outlook
- Table 11.17 Wuxi Advanced Therapies: Company Snapshot
- Table 11.18 Wuxi Advanced Therapies: Information on Manufacturing Facilities and Capabilities
- Table 11.19 Wuxi Advanced Therapies: Recent Developments and Future Outlook
- Table 11.20 BioNTech: Company Snapshot
- Table 11.21 BioNTech: Information on Manufacturing Facilities and Capabilities
- Table 11.22 BioNTech: Recent Developments and Future Outlook
- Table 11.23 Cell and Gene Therapy Catapult: Company Snapshot
- Table 11.24 Cell and Gene Therapy Catapult: Information on Manufacturing Facilities and Capabilities
- Table 11.25 Cell and Gene Therapy Catapult: Recent Developments and Future Outlook
- Table 11.26 Lonza: Company Snapshot
- Table 11.27 Lonza: Information on Manufacturing Facilities and Capabilities
- Table 11.28 Lonza: Recent Developments and Future Outlook
- Table 11.29 RoslinCT: Company Snapshot
- Table 11.30 RoslinCT: Information on Manufacturing Facilities and Capabilities
- Table 11.31 RoslinCT: Recent Developments and Future Outlook
- Table 11.32 Cell Therapies: Company Snapshot
- Table 11.33 Cell Therapies: Information on Manufacturing Facilities and Capabilities
- Table 11.34 Cell Therapies: Recent Developments and Future Outlook
- Table 11.35 Minaris Regenerative Medicine: Company Snapshot
- Table 11.36 Minaris Regenerative Medicine: Information on Manufacturing Facilities and Capabilities
- Table 11.37 Minaris Regenerative Medicine: Recent Developments and Future Outlook
- Table 11.38 MEDINET: Company Snapshot
- Table 11.39 MEDINET: Information on Manufacturing Facilities and Capabilities
- Table 11.40 Nikon CeLL Innovation: Company Snapshot
- Table 11.41 Nikon CeLL Innovation: Information on Manufacturing Facilities and Capabilities
- Table 12.1 Cell Therapy Manufacturing (Non-Industry Players): List of Organizations Profiled
- Table 12.2 Center for Cell and Gene Therapy: Overview of Manufacturing Facilities and Capabilities
- Table 12.3 Center for Cell Manufacturing Ireland: Overview of Manufacturing Facilities and Capabilities
- Table 12.4 Clinical Cell and Vaccine Production Facility: Overview of Manufacturing Facilities and Capabilities
- Table 12.5 Guy's and St. Thomas GMP Facility: Overview of Manufacturing Facilities and Capabilities
- Table 12.6 Laboratory of Cell and Gene Medicine: Overview of Manufacturing Facilities and Capabilities
- Table 12.7 Molecular and Cellular Therapeutics: Overview of Manufacturing Facilities and Capabilities
- Table 12.8 Newcastle Advanced Therapies: Overview of Manufacturing Facilities and Capabilities
- Table 12.9 Rayne Cell Therapy Suite: Overview of Manufacturing Facilities and Capabilities
- Table 12.10 Scottish National Blood Transfusion Services: Overview of Manufacturing Services and Capabilities
- Table 12.11 Sydney Cell and Gene Therapy: Overview of Manufacturing Facilities and Capabilities
- Table 13.1 Cell Therapy Manufacturing: List of Non-Profit Organizations
- Table 13.2 CellCAN: Overview
- Table 13.3 Cell Therapy Manufacturing Cooperative Research Center: Overview
- Table 13.4 National Cell Manufacturing Consortium: Overview
- Table 13.5 California's Institute of Regenerative Medicine: Overview
- Table 15.1 Cell Therapy Manufacturing: List of Partnerships and Collaborations
- Table 15.2 Partnerships and Collaborations: Information on Type of Cells
- Table 15.3 Partnerships and Collaborations: Information on Types of T Cells and Stem Cells
- Table 15.4 Partnerships and Collaborations: Information on Scale of Operation
- Table 15.5 Cell Therapy Manufacturing: List of Mergers and Acquisitions
- Table 16.1 Cell Therapy Manufacturing: List of Expansions
- Table 16.2 Recent Expansions: Information on Type of Cell Manufactured
- Table 16.3 Recent Expansions: Information on Scale of Operation
- Table 17.1 Big Pharma Players: List of Cell Therapy Manufacturing Focused Initiatives, 2017-2022
- Table 17.2 Big Pharma Players: Information on Type of Cells Manufactured
- Table 17.3 Big Pharma Players: Information on Scale of Operation
- Table 18.1 Average Installed Cell Therapy Manufacturing Capacity (Number of Cleanrooms): Sample Data Set for Industry Players
- Table 18.2 Average Installed Cell Therapy Manufacturing Capacity (Cleanroom Area): Sample Data Set for Industry Players
- Table 18.3 Installed Global Cell Therapy Manufacturing Capacity of Industry Players (Number of Cleanrooms): Distribution by Company Size
- Table 18.4 Installed Global Cell Therapy Manufacturing Capacity of Industry Players (Cleanroom Area): Distribution by Company Size
- Table 18.5 Median Installed Cell Therapy Manufacturing Capacity (Number of Cleanrooms): Data Set for Non-Industry Players
- Table 18.6 Median Installed Cell Therapy Manufacturing Capacity (Cleanroom Area): Dat Set for Non-Industry Players
- Table 20.1 Costs Associated with Manufacturing Stem Cell Therapies
- Table 20.2 Pricing Model: Price of Marketed Drugs (Antibody Drug Conjugates and Monoclonal Antibodies)
- Table 20.3 T-Cell Immunotherapies: Expert Opinions on Pricing
- Table 20.4 CAR-T Cell Therapies: Reimbursement Landscape
- Table 22.1 Total Cost of Ownership: Sample Dataset
- Table 23.1 Active Clinical Studies for Cell Therapies
- Table 23.2 Active Clinical Studies for Cell Therapies: Distribution by Patients Enrolled
- Table 30.1 Survey Insights: Overview of Respondents
- Table 30.2 Survey Insights: Designations and Seniority Levels
- Table 30.3 Survey Insights: Type of Cell Therapy
- Table 30.4 Survey Insights: Scale of Operation
- Table 30.5 Survey Insights: Source of Cells
- Table 30.6 Survey Insights: Cell Culture System
- Table 30.7 Survey Insights: Availability of Fill / Finish Services
- Table 32.1 Invetech: Company Snapshot
- Table 32.2 John Goldman Centre for Cellular Therapy, Imperial College London: Organization Snapshot
- Table 32.3 Cellistic: Company Snapshot
- Table 32.4 FamiCord: Company Snapshot
- Table 32.5 GenCure: Company Snapshot
- Table 32.6 Japan Tissue Engineering: Company Snapshot
- Table 32.7 Medace: Company Snapshot
- Table 32.8 Laboratory for Cell and Gene Medicine, University of Stanford: Organization Snapshot
- Table 32.9 Sumitomo Pharma: Company Snapshot
- Table 32.10 RoslinCT: Company Snapshot
- Table 32.11 Discovery Life Sciences: Company Snapshot
- Table 32.12 Glycostem Therapeutics: Company Snapshot
- Table 32.13 Bio Elpida: Company Snapshot
- Table 32.14 Gracell Biotechnologies: Company Snapshot
- Table 32.15 Kadimastem: Company Snapshot
- Table 32.16 RoslinCT: Company Snapshot
- Table 32.17 University of Minnesota: Organization Snapshot
- Table 32.18 Lion TCR: Company Snapshot
- Table 32.19 Center for Commercialization of Cancer Immunotherapy (C3i): Company Snapshot
- Table 32.20 Yposkesi: Company Snapshot
- Table 32.21 CiMaas: Company Snapshot
- Table 33.1 Industry Players: Distribution by Year of Establishment
- Table 33.2 Industry Players: Distribution by Company Size
- Table 34.3 Industry Players: Distribution by Location of Headquarters (Region)
- Table 34.4 Industry Players: Distribution by Location of Headquarters (Country)
- Table 34.5 Industry Players: Distribution by Company Size and Location of Headquarters
- Table 34.6 Industry Players: Distribution by Location of Manufacturing Facilities (Region)
- Table 34.7 Industry Players: Distribution by Location of Manufacturing Facilities (Country)
- Table 34.8 Industry Players: Distribution by Type of Manufacturer
- Table 34.9 Industry Players: Distribution by Location of Headquarters and Type of Manufacturer
- Table 34.10 Industry Players: Distribution by Type of Cells Manufactured
- Table 34.11 Industry Players: Distribution by Type of Immune Cell Manufactured
- Table 34.12 Industry Players: Distribution by Type of Stem Cell Manufactured
- Table 34.13 Industry Players: Distribution by Location of Headquarters and Type of Cell Manufactured
- Table 34.14 Industry Players: Distribution by Source of Cells
- Table 34.15 Industry Players: Distribution by Type of Cell Manufactured and Source of Cells
- Table 34.16 Industry Players: Distribution by Scale of Operation
- Table 34.17 Industry Players: Distribution by Additional Services Offered
- Table 34.18 Industry Players: Distribution by Company Size and Additional Services Offered
- Table 34.19 Non-Industry Players: Distribution by Year of Establishment
- Table 34.20 Non-Industry Players: Distribution by Location of Headquarters (Region)
- Table 34.21 Non-Industry Players: Distribution by Location of Headquarters (Country)
- Table 34.22 Non-Industry Players: Distribution by Location of Manufacturing Facility (Region)
- Table 34.23 Non-Industry Players: Distribution by Location of Manufacturing Facility (Country)
- Table 34.24 Non-Industry Players: Distribution by Type of Manufacturer
- Table 34.25 Non-Industry Players: Distribution by Location of Headquarters and Type of Manufacturer
- Table 34.26 Non-Industry Players: Distribution by Type of Cell Manufactured
- Table 34.27 Non-Industry Players: Distribution by Type of Immune Cell Manufactured
- Table 34.28 Non-Industry Players: Distribution by Type of Stem Cell Manufactured
- Table 34.29 Non-Industry Players: Distribution by Location of Headquarters and Type of Cell Manufactured
- Table 34.30 Non-Industry Players: Distribution by Source of Cells
- Table 34.31 Non-Industry Players: Distribution by Type of Cell Manufactured and Source of Cells
- Table 34.32 Non-Industry Players: Distribution by Scale of Operation
- Table 34.33 Non-Industry Players: Distribution by Additional Services Offered
- Table 34.34 AGC Biologics: Annual Revenues, FY 2020 Onwards (Billion YEN)
- Table 34.35 Charles River Laboratories: Annual Revenues, FY 2020 Onwards (USD Billion)
- Table 34.36 Thermo Fisher Scientific: Annual Revenues, FY 2020 Onwards (USD Billion)
- Table 34.37 Lonza: Annual Revenues, FY 2019 Onwards (CHF Million)
- Table 34.38 Clinical Trial Analysis: Distribution by Trial Registration Year, since 2018
- Table 34.39 Clinical Trial Analysis: Distribution by Trial Registration Year and Enrolled Patient Population, since 2018
- Table 34.40 Clinical Trial Analysis: Distribution by Trial Status
- Table 34.41 Clinical Trial Analysis: Distribution by Trial Registration Year and Trial Status
- Table 34.42 Clinical Trial Analysis: Distribution by Trial Phase
- Table 34.43 Clinical Trial Analysis: Distribution of Trial Phase by Number of Trials and Enrolled Patient Population
- Table 34.44 Clinical Trial Analysis: Distribution by Type of Sponsor / Collaborator
- Table 34.45 Clinical Trial Analysis: Distribution by Patient Segment
- Table 34.46 Clinical Trial Analysis: Distribution by Study Design
- Table 34.47 Most Active Industry Players: Distribution by Number of Registered Trials
- Table 34.48 Most Active Non-Industry Players: Distribution by Number of Registered Trials
- Table 34.49 Clinical Trial Analysis: Distribution by Number of Trials and Geography
- Table 34.50 Clinical Trial Analysis: Distribution by Number of Trials, Trial Status and Geography
- Table 34.51 Clinical Trial Analysis: Distribution by Enrolled Patient Population, Trial Status and Geography
- Table 34.52 Partnerships and Collaborations: Cumulative Year-wise Trend, since 2016
- Table 34.53 Partnerships and Collaborations: Distribution by Type of Partnership
- Table 34.54 Partnerships and Collaborations: Distribution by Year and Type of Partnership
- Table 34.55 Partnerships and Collaborations: Distribution by Type of Cell
- Table 34.56 Heat Map: Distribution by Year and Type of Cell
- Table 34.57 Partnerships and Collaborations: Distribution by Type of T Cell
- Table 34.58 Partnerships and Collaborations: Distribution by Type of Stem Cell
- Table 34.59 Partnerships and Collaborations: Distribution by Scale of Operation
- Table 34.60 Partnerships and Collaborations: Distribution by Type of Cell and Scale of Operation
- Table 34.61 Partnerships and Collaborations: Country-wise Distribution
- Table 34.62 Partnerships and Collaborations: Continent-wise Distribution
- Table 34.63 Most Active Players: Distribution by Number of Partnerships and Collaborations
- Table 34.64 Mergers and Acquisitions: Cumulative Year-wise Trend, 2016-2022
- Table 34.65 Mergers and Acquisitions: Distribution by Type of Agreement
- Table 34.66 Mergers and Acquisitions: Year-wise Distribution by Type of Cell
- Table 34.67 Mergers and Acquisitions: Country-wise Distribution
- Table 34.68 Mergers and Acquisitions: Continent-wise Distribution
- Table 34.69 Mergers and Acquisitions: Intercontinental and Intracontinental Deals
- Table 34.70 Mergers and Acquisitions: Ownership Change Matrix
- Table 34.71 Recent Expansions: Cumulative Year-wise Trend, since 2016
- Table 34.72 Recent Expansions: Distribution by Type of Expansion
- Table 34.73 Recent Expansions: Distribution by Year and Type of Expansion
- Table 34.74 Recent Expansions: Distribution by Type of Cell Manufactured
- Table 34.75 Recent Expansions: Distribution by Type of Expansion and Type of Cell Manufactured
- Table 34.76 Recent Expansions: Distribution by Scale of Operation
- Table 34.77 Recent Expansions: Distribution by Location of Expanded Facility (Region)
- Table 34.78 Recent Expansions: Distribution by Location of Expanded Facility (Country)
- Table 34.79 Recent Expansions: Distribution by Type of Expansion and Location of Expanded Facility
- Table 34.80 Most Active Players: Distribution by Number of Expansions
- Table 34.81 Most Active Players: Distribution by Area of Expansion (in sq ft)
- Table 34.82 Big Pharma Initiatives: Distribution by Number of Cell Therapy Manufacturing Focused Initiatives
- Table 34.83 Big Pharma Initiatives: Cumulative Distribution by Year of Initiative
- Table 34.84 Big Pharma Initiatives: Distribution by Type of Initiative
- Table 34.85 Big Pharma Initiatives: Distribution by Type of Partnership
- Table 34.86 Big Pharma Initiatives: Distribution by Type of Expansion
- Table 34.87 Big Pharma Initiatives: Distribution by Type of Cells Manufactured
- Table 34.88 Big Pharma Initiatives: Distribution by Scale of Operation
- Table 34.89 Big Pharma Initiatives: Distribution of Big Pharma Players by Year and Number of Initiatives
- Table 34.90 Big Pharma Initiatives: Distribution of Big Pharma Players by Year and Type of Initiative
- Table 34.91 Big Pharma Players: Distribution by Scale of Operation and Big Pharma Players
- Table 34.92 Installed Global Cell Therapy Manufacturing Capacity of Industry Players (Number of Cleanrooms): Distribution by Company Size
- Table 34.93 Installed Global Cell Therapy Manufacturing Capacity of Industry Players (Number of Cleanrooms): Distribution by Scale of Operation
- Table 34.94 Installed Global Cell Therapy Manufacturing Capacity of Industry Players (Number of Cleanrooms): Distribution by Location of Manufacturing Facility
- Table 34.95 Installed Global Cell Therapy Manufacturing Capacity of Industry Players (Number of Cleanrooms): Distribution by Scale of Operation and Location of Manufacturing Facility
- Table 34.96 Installed Global Capacity of Industry Players for Cell Therapy Manufacturing (Number of Cleanrooms): Distribution by Scale of Operation and Location of Manufacturing Facility
- Table 34.97 Installed Global Cell Therapy Manufacturing Capacity of Industry Players (Cleanroom Area): Distribution by Company Size
- Table 34.98 Installed Global Cell Therapy Manufacturing Capacity of Industry Players (Cleanroom Area): Distribution by Scale of Operation
- Table 34.99 Installed Global Cell Therapy Manufacturing Capacity of Industry Players (Cleanroom Area): Distribution by Location of Manufacturing Facility
- Table 34.100 Installed Global Cell Therapy Manufacturing Capacity of Industry Players (Cleanroom Area): Distribution by Company Size and Location of Manufacturing Facility
- Table 34.101 Installed Global Cell Therapy Manufacturing Capacity of Industry Players (Cleanroom Area): Distribution by Scale of Operation and Location of Manufacturing Facility
- Table 34.102 Installed Global Cell Therapy Manufacturing Capacity of Non-Industry Players (Number of Cleanrooms): Distribution by Scale of Operation
- Table 34.103 Installed Global Cell Therapy Manufacturing Capacity of Non-Industry Players (Number of Cleanrooms): Distribution by Location of Manufacturing Facility
- Table 34.104 Installed Global Cell Therapy Manufacturing Capacity of Non-Industry Players (Cleanroom Area): Distribution by Scale of Operation
- Table 34.105 Installed Global Cell Therapy Manufacturing Capacity of Non-Industry Players (Cleanroom Area): Distribution by Location of Manufacturing Facility
- Table 34.106 Global Demand for Cell Therapies, till 2035 (Number of Patients)
- Table 34.107 Global Demand for Cell Therapies, till 2035 (Billion Cells)
- Table 34.108 Global Clinical Demand for Cell Therapies, till 2035 (Number of Patients)
- Table 34.109 Global Clinical Demand for Cell Therapies, till 2035: Distribution by Type of Cell Therapy (Number of Patients)
- Table 34.110 Global Clinical Demand for Cell Therapies, till 2035: Distribution by Geography (Number of Patients)
- Table 34.111 Global Commercial Demand for Cell Therapies, till 2035 (Number of Patients)
- Table 34.112 Global Commercial Demand for Cell Therapies, till 2035: Distribution by Type of Cell Therapy (Number of Patients)
- Table 34.113 Global Commercial Demand for Cell Therapies, till 2035: Distribution by Geography (Number of Patients)
- Table 34.114 Total Cost of Ownership for Mid-sized Cell Therapy Manufacturing Organizations, Y0-Y20 (USD Million)
- Table 34.115 Total Cost of Ownership for Mid-sized Cell Therapy Manufacturing Organizations: Distribution by CAPEX and OPEX, Y0 and Y20 (USD Million)
- Table 34.116 Total Cost of Ownership for Mid-sized Cell Therapy Manufacturing Organizations, Y0: Distribution of CAPEX (USD Million)
- Table 34.117 Total Cost of Ownership for Mid-sized Cell Therapy Manufacturing Organizations, Y1-Y20: Distribution by OPEX (USD Million)
- Table 34.118 Global Cell Therapy Manufacturing Market, Historical Trends (since 2022) and Forecasted Estimates (till 2035) (USD Billion)
- Table 34.119 Cell Therapy Manufacturing Market: Distribution by Type of Cell Therapy, 2022, 2024 and 2035 (USD Million)
- Table 34.120 Cell Therapy Manufacturing Market for T Cell Therapies: Historical Trends (since 2022) and Forecasted Estimates (till 2035) (USD Million)
- Table 34.121 T Cell Therapy Manufacturing Market for CAR-T Cell Therapies: Historical Trends (since 2022) and Forecasted Estimates (till 2035) (USD Million)
- Table 34.122 T Cell Therapy Manufacturing Market for TCR Cell Therapies: Historical Trends (since 2022) and Forecasted Estimates (till 2035) (USD Million)
- Table 34.123 T Cell Therapy Manufacturing Market for TIL Cell Therapies: Historical Trends (since 2022) and Forecasted Estimates (till 2035) (USD Million)
- Table 34.124 Cell Therapy Manufacturing Market for Stem Cell Therapies: Historical Trends (since 2022) and Forecasted Estimates (till 2035) (USD Million)
- Table 34.125 Cell Therapy Manufacturing Market for Dendritic Cell Therapies: Historical Trends (since 2022) and Forecasted Estimates (till 2035) (USD Million)
- Table 34.126 Cell Therapy Manufacturing Market for NK Cell Therapies: Historical Trends (since 2022) and Forecasted Estimates (till 2035) (USD Million)
- Table 34.127 Cell Therapy Manufacturing Market: Distribution by Source of Cells, 2022, 2024, 2035 (USD Million)
- Table 34.128 Cell Therapy Manufacturing Market for Autologous Source of Cells: Historical Trends (since 2022) and Forecasted Estimates (till 2035) (USD Million)
- Table 34.129 Cell Therapy Manufacturing Market for Allogeneic Source of Cells: Historical Trends (since 2022) and Forecasted Estimates (till 2035) (USD Million)
- Table 34.130 Cell Therapy Manufacturing Market for Unspecified Source of Cells: Historical Trends (since 2022) and Forecasted Estimates (till 2035) (USD Million)
- Table 34.131 Cell Therapy Manufacturing Market: Distribution by Scale of Operation, 2022, 2024 and 2035
- Table 34.132 Cell Therapy Manufacturing Market for Clinical Scale: Historical Trends (since 2022) and Forecasted Estimates (till 2035) (USD Million)
- Table 34.133 Clinical Scale Manufacturing Market for T Cell Therapies, till 2035 (USD Million)
- Table 34.134 Clinical Scale Manufacturing Market for T Cell Therapies: Distribution by Type of Therapy, till 2035 (USD Million)
- Table 34.135 Clinical Scale Manufacturing Market for T Cell Therapies: Distribution by Source of Cells, till 2035 (USD Million)
- Table 34.136 Clinical Scale Manufacturing Market for T Cell Therapies: Distribution by Geography, till 2035 (USD Million)
- Table 34.137 Clinical Scale Manufacturing Market for NK Cell Therapies, till 2035 (USD Million)
- Table 34.138 Clinical Scale Manufacturing Market for NK Cell Therapies: Distribution by Source of Cells, till 2035 (USD Million)
- Table 34.139 Clinical Scale Manufacturing Market for NK Cell Therapies: Distribution by Geography, till 2035 (USD Million)
- Table 34.140 Clinical Scale Manufacturing Market for Dendritic Cell Therapies, till 2035 (USD Million)
- Table 34.141 Clinical Scale Manufacturing Market for Dendritic Cell Therapies: Distribution by Source of Cells, till 2035 (USD Million)
- Table 34.142 Clinical Scale Manufacturing Market for Dendritic Cell Therapies: Distribution by Geography, till 2035 (USD Million)
- Table 34.143 Clinical Scale Manufacturing Market for Stem Cell Therapies, till 2035 (USD Million)
- Table 34.144 Clinical Scale Manufacturing Market for Stem Cell Therapies: Distribution by Source of Cells, till 2035 (USD Million)
- Table 34.145 Clinical Scale Manufacturing Market for Stem Cell Therapies: Distribution by Geography, till 2035 (USD Million)
- Table 34.146 Cell Therapy Manufacturing Market for Commercial Scale: Historical Trends (since 2022) and Forecasted Estimates (till 2035) (USD Million)
- Table 34.147 Commercial Scale Manufacturing Market for T Cell Therapies, till 2035 (USD Million)
- Table 34.148 Commercial Scale Manufacturing Market for T Cell Therapies: Distribution by Type of Therapy, till 2035 (USD Million)
- Table 34.149 Commercial Scale Manufacturing Market for T Cell Therapies: Distribution by Source of Cells, till 2035 (USD Million)
- Table 34.150 Commercial Scale Manufacturing Market for T Cell Therapies: Distribution by Geography, till 2035 (USD Million)
- Table 34.151 Commercial Scale Manufacturing Market for Dendritic Cell Therapies, till 2035 (USD Million)
- Table 34. 152 Commercial Scale Manufacturing Market for Dendritic Cell Therapies: Distribution by Geography, till 2035 (USD Million)
- Table 34.153 Commercial Scale Manufacturing Market for Stem Cell Therapies, till 2035 (USD Million)
- Table 34.154 Commercial Scale Manufacturing Market for Stem Cell Therapies: Distribution by Source of Cells, till 2035 (USD Million)
- Table 34.155 Commercial Scale Manufacturing Market for Stem Cell Therapies: Distribution by Geography, till 2035 (USD Million)
- Table 34.156 Cell Therapy Manufacturing Market: Distribution by Type of Manufacturer, 2022, 2024 and 2035
- Table 34.157 Cell Therapy Manufacturing Market for In-house Manufacturers: Historical Trends (since 2022) and Forecasted Estimates (till 2035) (USD Million)
- Table 34.158 Cell Therapy Manufacturing Market for contract manufacturing organizations: Historical Trends (since 2022) and Forecasted Estimates (till 2035) (USD Million)
- Table 34.159 Cell Therapy Manufacturing Market: Distribution by Geography, 2022, 2024 and 2035
- Table 34.160 Cell Therapy Manufacturing Market in North America: Historical Trends (since 2022) and Forecasted Estimates (till 2035) (USD Million)
- Table 34.161 Cell Therapy Manufacturing Market in Europe: Historical Trends (since 2022) and Forecasted Estimates (till 2035) (USD Million)
- Table 34.162 Cell Therapy Manufacturing Market in Asia Pacific: Historical Trends (since 2022) and Forecasted Estimates (till 2035) (USD Million)
- Table 34.163 Cell Therapy Manufacturing Market in Rest of the World: Historical Trends (since 2022) and Forecasted Estimates (till 2035) (USD Million)
- Table 34.164 Survey Insights: Distribution of Respondents by Type of Organization
- Table 34.165 Survey Insights: Distribution of Respondents by Location of Manufacturing Facility
- Table 34.166 Survey Insights: Distribution by Designation and Seniority Level
- Table 34.167 Survey Insights: Distribution by Type of Cell Therapy
- Table 34.168 Survey Insights: Distribution by Scale of Operation
- Table 34.169 Survey Insights: Distribution by Source of Cells
- Table 34.170 Survey Insights: Distribution by Fill / Finish Services
List of Figures
- Figure 2.1 Research Methodology: Project Methodology
- Figure 2.2 Research Methodology: Forecast Methodology
- Figure 2.3 Research Methodology: Robust Quality Control
- Figure 2.4 Research Methodology: Key Market Segmentations
- Figure 3.1 Economic and Other Project Specific Consideration: Lesson Learnt from Past Recessions
- Figure 4.1 Executive Summary: Market Landscape
- Figure 4.2 Executive Summary: Clinical Trial Analysis
- Figure 4.3 Executive Summary: Partnerships and Collaborations
- Figure 4.4 Executive Summary: Mergers and Acquisitions
- Figure 4.5 Executive Summary: Recent Expansions
- Figure 4.6 Executive Summary: Big Pharma Initiatives
- Figure 4.7 Executive Summary: Capacity Analysis
- Figure 4.8 Executive Summary: Demand Analysis
- Figure 4.9 Executive Summary: Market Sizing and Opportunity Analysis
- Figure 5.1 Classification of Advanced Therapy Medicinal Products (ATMPs)
- Figure 5.2 Decentralized Manufacturing: Process Model
- Figure 5.3 Cell Therapy Manufacturing: Type of Manufacturers
- Figure 5.4 Cell Therapies: Challenges and Drivers
- Figure 5.5 Cell Therapies: Potency as a Critical Quality Attribute
- Figure 5.6 Cell Therapy Manufacturing: Supply Chain Model
- Figure 6.1 Industry Players: Distribution by Year of Establishment
- Figure 6.2 Industry Players: Distribution by Company Size
- Figure 6.3 Industry Players: Distribution by Location of Headquarters (Region)
- Figure 6.4 Industry Players: Distribution by Location of Headquarters (Country)
- Figure 6.5 Industry Players: Distribution by Company Size and Location of Headquarters (Region)
- Figure 6.6 Industry Players: Distribution by Location of Manufacturing Facilities (Region)
- Figure 6.7 Industry Players: Distribution by Location of Manufacturing Facilities (Country)
- Figure 6.8 Industry Players: Distribution by Type of Manufacturer
- Figure 6.9 Industry Players: Distribution by Location of Headquarters and Type of Manufacturer
- Figure 6.10 Industry Players: Distribution by Type of Cell Manufactured
- Figure 6.11 Industry Players: Distribution by Type of Immune Cell Manufactured
- Figure 6.12 Industry Players: Distribution by Type of Stem Cell Manufactured
- Figure 6.13 Industry Players: Distribution by Location of Headquarters and Type of Cell Manufactured
- Figure 6.14 Industry Players: Distribution by Source of Cells
- Figure 6.15 Industry Players: Distribution by Type of Cell Manufactured and Source of Cells
- Figure 6.16 Industry Players: Distribution by Scale of Operation
- Figure 6.17 Industry Players: Distribution by Additional Services Offered
- Figure 6.18 Industry Players: Distribution by Company Size and Additional Services Offered
- Figure 7.1 Non-Industry Players: Distribution by Year of Establishment
- Figure 7.2 Non-Industry Players: Distribution by Location of Headquarters (Region)
- Figure 7.3 Non-Industry Players: Distribution by Location of Headquarters (Country)
- Figure 7.4 Non-Industry Players: Distribution by Location of Manufacturing Facility (Region)
- Figure 7.5 Non-Industry Players: Distribution by Location of Manufacturing Facility (Country)
- Figure 7.6 Non-Industry Players: Distribution by Type of Manufacturer
- Figure 7.7 Non-Industry Players: Distribution by Location of Headquarters and Type of Manufacturer
- Figure 7.8 Non-Industry Players: Distribution by Type of Cell Manufactured
- Figure 7.9 Non-Industry Players: Distribution by Type of Immune Cell Manufactured
- Figure 7.10 Non-Industry Players: Distribution by Type of Stem Cell Manufactured
- Figure 7.11 Non-Industry Players: Distribution by Location of Headquarters and Type of Cell Manufactured
- Figure 7.12 Non-Industry Players: Distribution by Source of Cells
- Figure 7.13 Non-Industry Players: Distribution by Type of Cell Manufactured and Source of Cells
- Figure 7.14 Non-Industry Players: Distribution by Scale of Operation
- Figure 7.15 Non-Industry Players: Distribution by Additional Services Offered
- Figure 8.1 Industry Players: Distribution of Manufacturing Facilities by Regulatory Authorities
- Figure 8.2 Cell Therapy Manufacturing (Non-Industry Players): Regulatory Authorities
- Figure 10.1 Key Considerations for Automating Cell Therapy Manufacturing Process
- Figure 10.2 Requirements to Implement Closed Systems in Cell Therapy Manufacturing Processes
- Figure 10.3 Functions of Automated and Closed Systems at Each Step of the Cell Therapy Manufacturing Process
- Figure 10.4 Advantages and Disadvantages of Single-Use System
- Figure 10.5 Growth Drivers and Roadblocks to the Automated and Closed Systems
- Figure 10.6 Cell Therapy Manufacturing: Roadmap for Developing an Automated Device
- Figure 10.7 Cell Therapy Manufacturing: Comparison Between Manual and Automated Processes
- Figure 10.8 Cell Therapy Manufacturing: Comparative Analysis of Manual and Automated Processes Based on Affiliated Costs
- Figure 11.1 AGC Biologics: Annual Revenues, FY 2020 Onwards (YEN Billion)
- Figure 11.2 Charles River Laboratories: Annual Revenues, FY 2020 Onwards (USD Billion)
- Figure 11.3 Thermo Fisher Scientific: Annual Revenues, FY 2020 Onwards (USD Billion)
- Figure 11.4 Lonza: Annual Revenues, FY 2019 Onwards (CHF Million)
- Figure 12.1 Center for Cell and Gene Therapy: Service Portfolio
- Figure 12.2 Center for Cell Manufacturing Ireland: Service Portfolio
- Figure 12.3 Clinical Cell and Vaccine Production Facility: Service Portfolio
- Figure 12.4 Guy's and St Thomas' GMP Facility: Service Portfolio
- Figure 12.5 Laboratory for Cell and Gene Medicine: Service Portfolio
- Figure 12.6 Molecular and Cellular Therapeutics: Service Portfolio
- Figure 12.7 Newcastle Cellular Therapies Facility: Service Portfolio
- Figure 12.8 Rayne Cell Therapy Suite, King's College London: Service Portfolio
- Figure 12.9 Scottish National Blood Transfusion Services Cellular Therapy Facility, Scottish Center for Regenerative Medicine: Service Portfolio
- Figure 12.10 Sydney Cell and Gene Therapy: Service Portfolio
- Figure 14.1 Clinical Trial Analysis: Scope and Methodology
- Figure 14.2 Clinical Trial Analysis: Distribution by Trial Registration Year, since 2018
- Figure 14.3 Clinical Trial Analysis: Distribution by Trial Registration Year and Enrolled Patient Population, since 2018
- Figure 14.4 Clinical Trial Analysis: Distribution by Trial Status
- Figure 14.5 Clinical Trial Analysis: Distribution by Trial Registration Year and Trial Status
- Figure 14.6 Clinical Trial Analysis: Distribution by Trial Phase
- Figure 14.7 Clinical Trial Analysis: Distribution of Trial Phase by Number of Trials and Enrolled Patient Population
- Figure 14.8 Clinical Trial Analysis: Distribution by Type of Sponsor / Collaborator
- Figure 14.9 Clinical Trial Analysis: Distribution by Patient Segment
- Figure 14.10 Clinical Trial Analysis: Distribution by Study Design
- Figure 14.11 Most Active Industry Players: Distribution by Number of Registered Trials
- Figure 14.12 Most Active Non-Industry Players: Distribution by Number of Registered Trials
- Figure 14.13 Clinical Trial Analysis: Distribution by Number of Trials and Geography
- Figure 14.14 Clinical Trial Analysis: Distribution by Number of Trials, Trial Status and Geography
- Figure 14.15 Clinical Trial Analysis: Distribution by Enrolled Patient Population, Trial Status and Geography
- Figure 15.1 Partnerships and Collaborations: Cumulative Year-wise Trend, since 2016
- Figure 15.2 Partnerships and Collaborations: Distribution by Type of Partnership
- Figure 15.3 Partnerships and Collaborations: Distribution by Year and Type of Partnership
- Figure 15.4 Partnerships and Collaborations: Distribution by Type of Cells
- Figure 15.5 Heat Map: Distribution by Year and Type of Cells
- Figure 15.6 Partnerships and Collaborations: Distribution by Type of T-Cells
- Figure 15.7 Partnerships and Collaborations: Distribution by Type of Stem Cells
- Figure 15.8 Partnerships and Collaborations: Distribution by Scale of Operation
- Figure 15.9 Partnerships and Collaborations: Distribution by Type of Cells and Scale of Operation
- Figure 15.10 Partnerships and Collaborations: Country-wise Distribution
- Figure 15.11 Partnerships and Collaborations: Continent-wise Distribution
- Figure 15.12 Most Active Players: Distribution by Number of Partnerships
- Figure 15.13 Mergers and Acquisitions: Cumulative Year-wise Trend, since 2016
- Figure 15.14 Mergers and Acquisitions: Distribution by Type of Agreement
- Figure 15.15 Mergers and Acquisitions: Year-wise Distribution by Type of Cells
- Figure 15.16 Mergers and Acquisitions: Country-wise Distribution
- Figure 15.17 Mergers and Acquisitions: Continent-wise Distribution
- Figure 15.18 Mergers and Acquisitions: Intercontinental and Intracontinental Deals
- Figure 15.19 Mergers and Acquisitions: Ownership Change Matrix
- Figure 16.1 Recent Expansions: Cumulative Year-wise Trend, since 2017
- Figure 16.2 Recent Expansions: Distribution by Type of Expansion
- Figure 16.3 Recent Expansions: Distribution by Year and Type of Expansion
- Figure 16.4 Recent Expansions: Distribution by Type of Cells Manufactured
- Figure 16.5 Recent Expansions: Distribution by Type of Expansion and Type of Cells Manufactured
- Figure 16.6 Recent Expansions: Distribution by Scale of Operation
- Figure 16.7 Recent Expansions: Distribution by Location of Expanded Facility (Region)
- Figure 16.8 Recent Expansions: Distribution by Location of Expanded Facility (Country)
- Figure 16.9 Recent Expansions: Distribution by Type of Expansion and Location of Expanded Facility
- Figure 16.10 Most Active Players: Distribution by Number of Expansions
- Figure 16.11 Most Active Players: Distribution by Area of Expansion (in sq ft)
- Figure 16.12 Recent Expansions: Distribution by Year and Location of Manufacturing Facility
- Figure 17.1 Big Pharma Players: Distribution by Number of Cell Therapy Manufacturing Focused Initiatives
- Figure 17.2 Big Pharma Players: Distribution by Year of Initiative
- Figure 17.3 Big Pharma Initiatives: Distribution by Type of Initiative
- Figure 17.4 Big Pharma Players: Distribution by Type of Partnership
- Figure 17.5 Big Pharma Players: Distribution by Type of Expansion
- Figure 17.6 Big Pharma Players: Distribution by Type of Cells
- Figure 17.7 Big Pharma Players: Distribution by Scale of Operation
- Figure 17.8 Big Pharma Players: Distribution of Big Pharma Players by Year and Number of Initiatives
- Figure 17.9 Big Pharma Players: Distribution by Year and Type of Initiative
- Figure 17.10 Big Pharma Players: Distribution of Type of Cells Manufactured
- Figure 17.11 Big Pharma Players: Distribution by Scale of Operation
- Figure 17.12 Harvey Ball Analysis: Big Pharma Initiatives Summary
- Figure 17.13 Spider Web Analysis: Big Pharmaceutical Players
- Figure 18.1 Sample Dataset Capacity of Industry Players for Cell Therapy Manufacturing (Number of Cleanrooms): Distribution by Company Size Range of Installed Capacity
- Figure 18.2 Sample Dataset Capacity of Industry Players for Cell Therapy Manufacturing (Cleanroom Area, sq. ft.): Distribution by Company Size and Range of Installed Capacity
- Figure 18.3 Installed Global Cell Therapy Manufacturing Capacity of Industry Players (Number of Cleanrooms): Distribution by Company Size
- Figure 18.4 Installed Global Cell Therapy Manufacturing Capacity of Industry Players (Number of Cleanrooms): Distribution by Scale of Operation
- Figure 18.5 Installed Global Cell Therapy Manufacturing Capacity of Industry Players (Number of Cleanrooms): Distribution by Location of Manufacturing Facility
- Figure 18.6 Installed Global Cell Therapy Manufacturing Capacity of Industry Players (Number of Cleanrooms): Distribution by Company Size and Location of Manufacturing Facility
- Figure 18.7 Installed Global Cell Therapy Manufacturing Capacity of Industry Players (Number of Cleanrooms): Distribution by Scale of Operation and Location of Manufacturing Facility
- Figure 18.8 Installed Global Cell Therapy Manufacturing Capacity of Industry Players (Cleanroom Area): Distribution by Company Size
- Figure 18.9 Installed Global Cell Therapy Manufacturing Capacity of Industry Players (in terms of Cleanroom Area): Distribution by Scale of Operation
- Figure 18.10 Installed Global Cell Therapy Manufacturing Capacity of Industry Players (Cleanroom Area): Distribution by Location of Manufacturing Facility
- Figure 18.11 Installed Global Cell Therapy Manufacturing Capacity of Industry Players (Cleanroom Area): Distribution by Company Size and Location of Manufacturing Facility
- Figure 18.12 Installed Global Cell Therapy Manufacturing Capacity of Industry Players (Cleanroom Area): Distribution by Scale of Operation and Location of Manufacturing Facility
- Figure 18.13 Installed Global Cell Therapy Manufacturing Capacity of Non-Industry Players (Number of Cleanrooms): Distribution by Range of Installed Capacity
- Figure 18.14 Installed Global Cell Therapy Manufacturing Capacity of Non-Industry Players (Number of Cleanrooms): Distribution by Scale of Operation
- Figure 18.15 Installed Global Cell Therapy Manufacturing Capacity of Non-Industry Players (Number of Cleanrooms): Distribution by Location of Manufacturing Facility
- Figure 18.16 Installed Global Cell Therapy Manufacturing Capacity of Non-Industry Players (Cleanroom Area): Distribution by Range of Installed Capacity
- Figure 18.17 Installed Global Cell Therapy Manufacturing Capacity of Non-Industry Players (Cleanroom Area): Distribution by Scale of Operation
- Figure 18.18 Installed Global Cell Therapy Manufacturing Capacity of Non-Industry Players (Cleanroom Area): Distribution by Location of Manufacturing Facility
- Figure 19.1 Global Demand for Cell Therapies, till 2035 (in terms of Number of Patients)
- Figure 19.2 Global Demand for Cell Therapies, till 2035 (in terms of Billion Cells)
- Figure 19.3 Global Clinical Demand for Cell Therapies, till 2035 (in terms of Number of Patients)
- Figure 19.4 Global Clinical Demand for Cell Therapies: Distribution by Type of Cell Therapy, till 2035 (in terms of Number of Patients)
- Figure 19.5 Global Clinical Demand for Cell Therapies: Distribution by Geography, till 2035 (in terms of Number of Patients)
- Figure 19.6 Global Commercial Demand for Cell Therapies, till 2035 (in terms of Number of Patients)
- Figure 19.7 Global Commercial Demand for Cell Therapies: Distribution by Type of Cell Therapy, till 2035 (in terms of Number of Patients)
- Figure 19.8 Global Commercial Demand for Cell Therapies: Distribution by Geography, till 2035 (in terms of Number of Patients)
- Figure 20.1 Targeted Therapies: Pricing Model Based on Patient Segment
- Figure 21.1 Make versus Buy Decision Making Framework
- Figure 21.2 Make versus Buy Decision Making: Possible Scenario Descriptions
- Figure 22.1 Total Cost of Ownership: Capital Expenditures (CAPEX)
- Figure 22.2 Total Cost of Ownership: Operational Expenditures (OPEX)
- Figure 22.3 Total Cost of Ownership for Mid-sized Cell Therapy Manufacturing Organizations, Y0-Y20 (USD Million)
- Figure 22.4 Total Cost of Ownership for Mid-sized Cell Therapy Manufacturing Organizations: Distribution by CAPEX and OPEX, Y0 and Y20 (USD Million)
- Figure 22.5 Total Cost of Ownership for Mid-sized Cell Therapy Manufacturing Organizations, Y0: Distribution by CAPEX (USD Million)
- Figure 22.6 Total Cost of Ownership for Mid-sized Cell Therapy Manufacturing Organizations, Y1-Y20: Distribution by OPEX (USD Million)
- Figure 23.1 Global Cell Therapy Manufacturing Market, Historical Trends (since 2022) and Forecasted Estimates (till 2035) (USD Billion)
- Figure 23.2 Global Cell Therapy Manufacturing Market, Forecasted Estimates (till 2035): Conservative Scenario (USD Billion)
- Figure 23.3 Global Cell Therapy Manufacturing Market, Forecasted Estimates (till 2035): Optimistic Scenario (USD Billion)
- Figure 24.1 Cell Therapy Manufacturing Market: Distribution by Type of Cell Therapy, 2022, 2024 and 2035
- Figure 24.2 Cell Therapy Manufacturing Market for T Cell Therapies: Historical Trends (since 2022) and Forecasted Estimates (till 2035) (USD Million)
- Figure 24.3 T Cell Therapy Manufacturing Market for CAR-T Cell Therapies: Historical Trends (since 2022) and Forecasted Estimates (till 2035) (USD Million)
- Figure 24.4 T Cell Therapy Manufacturing Market for TCR Cell Therapies: Historical Trends (since 2022) and Forecasted Estimates (till 2035) (USD Million)
- Figure 24.5 T Cell Therapy Manufacturing Market for TIL Cell Therapies: Historical Trends (since 2022) and Forecasted Estimates (till 2035) (USD Million)
- Figure 24.6 Cell Therapy Manufacturing Market for Stem Cell Therapies: Historical Trends (since 2022) and Forecasted Estimates (till 2035) (USD Million)
- Figure 24.7 Cell Therapy Manufacturing Market for Dendritic Cell Therapies: Historical Trends (since 2022) and Forecasted Estimates (till 2035) (USD Million)
- Figure 24.8 Cell Therapy Manufacturing Market for NK Cell Therapies: Historical Trends (since 2022) and Forecasted Estimates (till 2035) (USD Million)
- Figure 25.1 Cell Therapy Manufacturing Market: Distribution by Source of Cells, 2022, 2024 and 2035
- Figure 25.2 Cell Therapy Manufacturing Market for Autologous Source of Cells: Historical Trends (since 2022) and Forecasted Estimates (till 2035) (USD Million)
- Figure 25.3 Cell Therapy Manufacturing Market for Allogeneic Source of Cells: Historical Trends (since 2022) and Forecasted Estimates (till 2035) (USD Million)
- Figure 25.4 Cell Therapy Manufacturing Market for Unspecified Source of Cells: Historical Trends (since 2022) and Forecasted Estimates (till 2035) (USD Million)
- Figure 26.1 Cell Therapy Manufacturing Market: Distribution by Scale of Operation, 2022, 2024 and 2035
- Figure 26.2 Cell Therapy Manufacturing Market for Clinical Scale: Historical Trends (since 2022) and Forecasted Estimates (till 2035) (USD Million)
- Figure 26.3 Clinical Scale Manufacturing Market for T Cell Therapies, till 2035 (USD Million)
- Figure 26.4 Clinical Scale Manufacturing Market for T Cell Therapies: Distribution by Type of Therapy, till 2035 (USD Million)
- Figure 26.5 Clinical Scale Manufacturing Market for T Cell Therapies: Distribution by Source of Cells, till 2035 (USD Million)
- Figure 26.6 Clinical Scale Manufacturing Market for T Cell Therapies: Distribution by Geography, till 2035 (USD Million)
- Figure 26.7 Clinical Scale Manufacturing Market for NK Cell Therapies, till 2035 (USD Million)
- Figure 26.8 Clinical Scale Manufacturing Market for NK Cell Therapies: Distribution by Source of Cells, till 2035 (USD Million)
- Figure 26.9 Clinical Scale Manufacturing Market for NK Cell Therapies: Distribution by Geography, till 2035 (USD Million)
- Figure 26.10 Clinical Scale Manufacturing Market for Dendritic Cell Therapies, till 2035 (USD Million)
- Figure 26.11 Clinical Scale Manufacturing Market for Dendritic Cell Therapies: Distribution by Source of Cells, till 2035 (USD Million)
- Figure 26.12 Clinical Scale Manufacturing Market for Dendritic Cell Therapies: Distribution by Geography, till 2035 (USD Million)
- Figure 26.13 Clinical Scale Manufacturing Market for Stem Cell Therapies, till 2035 (USD Million)
- Figure 26.14 Clinical Scale Manufacturing Market for Stem Cell Therapies: Distribution by Source of Cells, till 2035 (USD Million)
- Figure 26.15 Clinical Scale Manufacturing Market for Stem Cell Therapies: Distribution by Geography, till 2035 (USD Million)
- Figure 26.16 Cell Therapy Manufacturing Market for Commercial Scale: Historical Trends (since 2022) and Forecasted Estimates (till 2035) (USD Million)
- Figure 26.17 Commercial Scale Manufacturing Market for T Cell Therapies, till 2035 (USD Million)
- Figure 26.18 Commercial Scale Manufacturing Market for T Cell Therapies: Distribution by Type of Therapy, till 2035 (USD Million)
- Figure 26.19 Commercial Scale Manufacturing Market for T Cell Therapies: Distribution by Source of Cells, till 2035 (USD Million)
- Figure 26.20 Commercial Scale Manufacturing Market for T Cell Therapies: Distribution by Geography, till 2035 (USD Million)
- Figure 26.21 Commercial Scale Manufacturing Market for Dendritic Cell Therapies, till 2035 (USD Million)
- Figure 26.22 Commercial Scale Manufacturing Market for Dendritic Cell Therapies: Distribution by Geography, till 2035 (USD Million)
- Figure 26.23 Commercial Scale Manufacturing Market for Stem Cell Therapies, till 2035 (USD Million)
- Figure 26.24 Commercial Scale Manufacturing Market for Stem Cell Therapies: Distribution by Source of Cells, till 2035 (USD Million)
- Figure 26.25 Commercial Scale Manufacturing Market for Stem Cell Therapies: Distribution by Geography, till 2035 (USD Million
- Figure 27.1 Cell Therapy Manufacturing Market: Distribution by Type of Manufacturer, 2022, 2024 and 2035
- Figure 27.2 Cell Therapy Manufacturing Market for In-house Manufacturers: Historical Trends (since 2022) and Forecasted Estimates (till 2035) (USD Million)
- Figure 27.3 Cell Therapy Manufacturing Market for Contract Manufacturing Organizations: Historical Trends (since 2022) and Forecasted Estimates (till 2035) (USD Million)
- Figure 28.1 Cell Therapy Manufacturing Market: Distribution by Geography, 2022, 2024 and 2035
- Figure 28.2 Cell Therapy Manufacturing Market in North America: Historical Trends (since 2022) and Forecasted Estimates (till 2035) (USD Million)
- Figure 28.3 Cell Therapy Manufacturing Market in Europe: Historical Trends (since 2022) and Forecasted Estimates (till 2035) (USD Million)
- Figure 28.4 Cell Therapy Manufacturing Market in Asia Pacific: Historical Trends (since 2022) and Forecasted Estimates (till 2035) (USD Million)
- Figure 28.5 Cell Therapy Manufacturing Market in Rest of the World: Historical Trends (since 2022) and Forecasted Estimates (till 2035) (USD Million
- Figure 29.1 Cell Therapy Manufacturing: SWOT Analysis
- Figure 29.2 Comparison of SWOT Factors: Harvey Ball Analysis
- Figure 30.1 Survey Insights: Distribution of Respondents by Type of Organization
- Figure 30.2 Survey Insights: Distribution of Respondents by Location of Manufacturing Facility
- Figure 30.3 Survey Insights: Distribution by Designation and Seniority of Respondents
- Figure 30.4 Survey Insights: Distribution by Type of Cell Therapy
- Figure 30.5 Survey Insights: Distribution by Scale of Operation
- Figure 30.6 Survey Insights: Distribution by Source of Cells
- Figure 30.7 Survey Insights: Distribution by Cell Culture System
- Figure 30.8 Survey Insights: Distribution by Availability of Fill / Finish Services
- Figure 31.1 Concluding Remarks: Market Landscape
- Figure 31.2 Concluding Remarks: Partnerships and Collaborations
- Figure 31.3 Concluding Remarks: Mergers and Acquisitions
- Figure 31.4 Concluding Remarks: Recent Expansions
- Figure 31.5 Concluding Remarks: Big Pharma Initiatives
- Figure 31.6 Concluding Remarks: Capacity Analysis
- Figure 31.7 Concluding Remarks: Demand Analysis
- Figure 31.8 Concluding Remarks: Total Cost of Ownership
- Figure 31.9 Concluding Remarks: Market Sizing and Opportunity Analysis (1/2)
- Figure 31.10 Concluding Remarks: Market Sizing and Opportunity Analysis (2/2)
 細胞治療培養基市場:產業趨勢及全球預測(至 2035 年)-依產品類型、細胞治療類型、企業規模、終端使用者類型及地區劃分
 細胞療法市場
 細胞療法領域的合作與授權協議(2016-2025)
 細胞治療處理:全球市場與技術細胞治療包裝市場:2035年前的產業趨勢全球預測:各包裝治療類型,各包裝設計,各產業規模,主要地區
 細胞和基因治療供應鏈軟體市場分析及預測(至 2034 年):類型、產品、服務、技術、組件、應用、流程、部署、最終用戶和階段
 先進治療藥物CDMO市場按產品類型、服務類型、治療領域、應用和最終用戶分類 - 全球預測(2025-2032年)同種異體細胞療法市場:依最終用戶、生產技術、適應症、細胞來源和產品類型分類-2025-2032年全球預測按產品類型、應用、技術、最終用戶和製程類型分類的自動化和封閉式細胞治療處理系統市場—2025-2032年全球預測無細胞療法市場按產品類型、應用、最終用戶、技術和療法類型分類-2025-2032年全球預測