


 |
市場調查報告書
商品編碼
1624829
T細胞療法的全球市場:各治療類型,各適應症,標的抗原,主要各地區:產業趨勢與2035年前的全球預測T-Cell Therapy Market by Type of Therapy, Target Indications, Target Antigens, and Key Geographical Regions : Industry Trends and Global Forecasts, Till 2035 |
||||||
全球 T 細胞治療市場規模預計將從目前的 35 億美元增長到 2035 年的 337.2 億美元,到 2035 年的預測期間複合年增長率為 23%。
癌症是全世界導致死亡的主要原因之一。根據國際癌症研究機構 (IARC) 預測,到 2040 年,全球將新增 2,750 萬癌症相關病例,1,630 萬人死亡。儘管癌症藥物是藥物開發中最活躍的領域之一,但該領域仍存在一些未滿足的需求。此外,化療、手術和放射治療等傳統癌症治療方法對晚期癌症的療效非常有限。為了滿足這些未滿足的需求,人們正在努力開發更有針對性的抗癌藥物,而T細胞免疫療法,特別是CAR T細胞療法,可以選擇副作用最小的腫瘤細胞,成為清除腫瘤的有力選擇。免疫療法本質上是利用人體自身的免疫系統及其組成部分來對抗癌症。
近年來,CAR-T療法成功地獲得了醫藥市場的巨大佔有率。許多此類標靶療法已經獲得批准,強大的開發管線表明 CAR-T 療法市場可能會繼續穩定成長。此外,該領域的持續研究活動導致了多個新分子標靶的發現,進一步加強了該領域領先公司的研究管線。在創新技術平台、有利的資金和有希望的臨床試驗結果的推動下,CAR-T 療法市場有望長期成長。
本報告提供全球T細胞療法市場相關調查,提供市場概要,以及各治療類型,各適應症,標的抗原,各地區的趨勢,及加入此市場的主要企業簡介等資訊。
目錄
第1章 序文
第2章 摘要整理
第3章 簡介
第4章 CAR-T細胞療法:市場形勢
第5章 TCR為基礎的治療方法:市場形勢
第6章 TIL為基礎的治療方法:市場形勢
第7章 重要的洞察
第8章 臨床試驗的分析
第9章 主要意見領袖
第10章 CAR-T細胞療法的簡介
- 章節概述
- Kymriah/Tisagenlecleucel/CTL019(諾華)
- Yescarta/Axiskabutageneciloleucel/KTE-C19(吉利德科學)
- Tecartus/Brexucabtagene Autoleucel(吉利德科學)
- Brayange/Lysocabtagenmalaleucel/JCAR017(百時美施貴寶)
- Abecma/BB2121/Idekabutagen Biculcel(百時美施貴寶)
- Kalbikti/Siltakabutagene Autoleucel/LCAR-B38M CAR-T/JNJ-68284528(楊森)
- Carteyva/Lermacabtagene Autoleucel/JWCAR029(JW Therapeutics)
- TBI-1501/CD19 CAR-T 細胞療法(Takara Bio)
- AUTO1/Obecabutagene Autoleucel/Ovecel (Autolus)
- AUTO3/CD19/22 CAR-T(Autolus)
第11章 TCR為基礎的治療簡介
- 章節概述
- Kimmtrak/IMCgp100/Tebentafusp (Immunocore)
- GSK3377794/NY-ESO-1C259 T 細胞/Letetresgene Autoleucel(葛蘭素史克)
- ADP-A2M4/Afamitregen Autoleucel/Afamicel(Adaptimmune Therapeutics)
- JTCR016(朱諾療法)
- TBI-1301(寶生物)
- MDG1011(Medigene)
第12章 TIL為基礎的治療簡介
- 章節概述
- LN-144/Lifileucel(Iovance Biotherapeutics)
- LN-145(Iovance 生物治療公司)
- ITIL-168(Instil Bio)
- LTX-315(Lytix Biopharma)
第13章 新興技術
第14章 夥伴關係和合作
第15章 資金籌措與投資分析
第16章 專利分析
第17章 其他的T細胞免疫療法
第18章 案例研究:細胞治療的製造
第19章 原價分析
第20章 市場預測與機會分析
第21章 推銷分析
第22章 企業簡介
- 章概要
- Adaptimmune Therapeutics
- Alaunos Therapeutics
- Autolus
- bluebird Bio
- Bristol Myers Squibb
- Carsgen Therapeutics
- Cellectis
- Cellular Biomedicine Group
- Gilead Sciences
- GlaxoSmithKline
- Immatics
- Immunocore
- Innovative Cellular Therapeutics
- Iovance Biotherapeutics
- Kuur Therapeutics
- Lion TCR
- Noile-Immune Biotech
- Novartis
- Shanghai GeneChem
- Sinobioway Cell Therapy
- Takara Bio
- Wellington Zhaotai Therapies
- Zelluna immunotherapy
第23章 結論
第24章 執行洞察
第25章 附錄1:表格形式的資料
第26章 附錄2:企業·團體一覽
T-CELL THERAPY MARKET: OVERVIEW
As per Roots Analysis, the global T-Cell therapy market is estimated to grow from USD 3.5 billion in the current year to USD 33.72 billion by 2035, at a CAGR of 23% during the forecast period, till 2035.
The market sizing and opportunity analysis has been segmented across the following parameters:
Type of Therapy
- CAR-T
- TCR
- TIL
Target Indication
- Acute Lymphoblastic Leukemia
- Non-Hodgkin's Lymphoma
- Melanoma
- Bladder Cancer
- Lung Cancer
- Head and Neck Cancer
- Multiple Myeloma
- Sarcoma
- Chronic Lymphocytic Leukemia
- Ovarian Cancer
- Esophageal Cancer
- Colorectal Cancer
- Nasopharyngeal Carcinoma
- Hepatocellular Carcinoma
- Acute Myeloid Leukemia
- Renal Cell Carcinoma
Type of Target Antigens
- CD19
- BCMA
- CD19/22
- EGFR
- NY-ESO-1
- Gp100
- P53
- EBV
- MUC2
Key Geography
- North America
- Europe
- Asia-Pacific
- Latin America
- Middle East and North Africa
T-CELL THERAPY MARKET: GROWTH AND TRENDS
Cancer is one of the leading causes of mortality worldwide. As per the International Agency for Research on Cancer (IARC), by 2040, there are likely to be 27.5 million new cases and 16.3 million deaths related to cancer, globally. Despite the fact that cancer therapeutics is one of the most active areas, in terms of drug development, there are several unmet needs in this domain. Moreover, conventional cancer treatments, such as chemotherapy, surgery, and radiation therapy, have demonstrated very limited efficacy in late-stage cancers. In order to cater to the unmet needs of the industry, more initiatives are being taken to develop more targeted anti-cancer therapies, T-cell immunotherapy, specifically CAR-T cell therapies, has emerged as a highly potent option to selectively eliminate the tumor cells with minimal side effects. Immunotherapies essentially make use of body's own immune system, or its components, to fight against cancer.
Over the past few years, CAR-T therapies have been successful in carving out a significant share of the pharmaceutical market. A number of such targeted therapies have already been approved whilst a robust development pipeline indicates that CAR-T therapies market is likely to grow at a steady pace in the foreseen future. Moreover, the ongoing research activity in this field has led to the discovery of several novel molecular targets, further strengthening the research pipelines of the companies in this domain. Driven by the availability of innovative technology platforms, lucrative funding and encouraging clinical trial results suggest that the CAR-T therapies market is poised to grow in the long run, as multiple product candidates are expected to receive marketing approval in the coming decade.
T-CELL THERAPY MARKET: KEY INSIGHTS
The report delves into the current state of the T-Cell therapy market and identifies potential growth opportunities within the industry. Some key findings from the report include:
1. With some approved therapies and over 970 preclinical / clinical product candidates, CAR-T cell immunotherapies comprise the most active segment of this domain.
2. More than 100 industry and non-industry players are currently evaluating the potential of over 190 TCR cell immunotherapies to treat various oncological and non-oncological disorders.
3. In addition, over 75 TIL immunotherapies are being evaluated across different stages of preclinical / clinical development either as monotherapies or in combination with other drugs.
4. Apart from CAR-T, TCR and TIL-based products, close to 205 other T-cell immunotherapies are marketed / under development for the treatment of a wide range of oncological and non-oncological indications.
5. Close to 200 players claim to have the required capabilities to manufacture different types of cell therapies; such firms also offer a wide range of services across different stages of product development.
6. Across each type of T-cell therapy, at least 80% of the players are developing autologous therapy candidates targeting various disease indications; CD19 and BCMA emerged as the most popular target antigens.
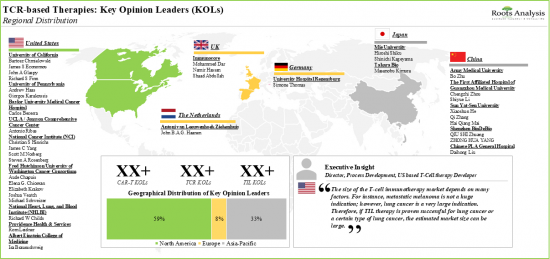
7. A number of scientists from renowned universities are presently involved in clinical development efforts of TCR-based therapies; these KOLs are primarily based in the US and China.
8. Specifically, for CAR-T cell therapies, extensive efforts are underway to improve the CAR constructs across successive generations, involving alterations in the scFv region and using different types of gene delivery vectors.
9. In the last 10 years, over 750 clinical trials have been registered across different geographies for CAR-T cell therapies; extensive efforts are underway to improve successive generations of therapies.
10. A rise in partnerships, in the recent past, involving both international and indigenous stakeholders, validates the growing interest in this domain.
11. More than 75 patents have been granted / filed for TCR-based therapies, primarily led by the non-industry players.
12. With the growing focus on the development pipeline and encouraging clinical results, the market is anticipated to witness an annualized growth rate of over 20%, during the next decade.
13. The projected opportunity within the T-cell Therapies market is expected to be well distributed across different geographical regions and key / emerging players.
T-CELL THERAPY MARKET: KEY SEGMENTS
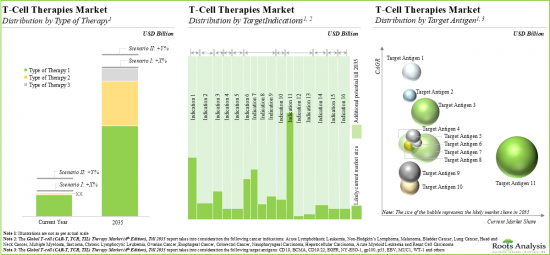
CAR-T Therapy is Likely to Dominate the T-Cell Therapy Market During the Forecast Period
Based on the type of therapy, the market is segmented into CAR T cell therapy, TCR therapy, and TIL therapy. At present, CAR-T therapy segment holds the maximum share of the T-Cell therapy market and this trend is likely to remain the same in the coming decade. This can be primally attributed to the proven efficacy of CAR-T therapy in various cancer treatments, such as acute lymphoblastic leukemia, chronic lymphocytic leukemia, multiple myeloma, myeloid leukemia, and non-Hodgkin's lymphoma. It is worth highlighting that T-cell therapy market for TCR therapy is likely to grow at a relatively higher CAGR, during the forecast period.
Currently, Non-Hodgkin's Lymphoma Segment Occupies the Largest Share of the T-Cell Therapy Market
Based on the type of target indications, the market is segmented into acute lymphoblastic leukemia, non-Hodgkin's lymphoma, melanoma, bladder cancer, lung cancer, head and neck cancer, multiple myeloma, sarcoma, chronic lymphocytic leukemia, ovarian cancer, esophageal cancer, colorectal cancer, nasopharyngeal carcinoma, hepatocellular carcinoma, acute myeloid leukemia and renal cell carcinoma. At present, non-Hodgkin's lymphoma holds the maximum share of the T-Cell therapy market. This trend is likely to remain the same in the forthcoming years. It is worth highlighting that T-Cell therapy market for sarcoma is likely to grow at a relatively higher CAGR, during the forecast period.
Currently, CD19 Captures the Largest Share of the T-Cell Therapy Market
Based on the type of target antigens, the market is segmented into CD19, BCMA, CD19/22, EGFR, NY-ESO-1, gp100, p53, EBV, MUC1, WT-1 and others. At present, the CD19 segment holds the maximum share of the T-Cell therapy market. Owing to its proven efficacy against various types of cancer, such as leukemia and lymphoma, CD19 antigen is anticipated to foster the demand for T-cell therapy over the forecast period.
Europe Accounts for the Largest Share of the Market
Based on key geographical regions, the market is segmented into North America, Europe, Asia-Pacific, Middle East and North Africa, and Latin America. Majority share is expected to be captured by drug developers based in Europe. It is worth highlighting that rising prevalence various types of cancer, such as hematologic malignancies and solid tumors, and a surge in demand for cancer treatment will drive the growth of the market in Europe.
Example Players in the T-Cell Therapy Market
- Autolus
- Adaptimmune Therapeutics
- Alaunos Therapeutics
- bluebird Bio
- Bristol Myers Squibb
- Carsgen Therapeutics
- Cellectis
- Cellular Biomedicine Group
- Gilead Sciences
- GlaxoSmithKline
Primary Research Overview
The opinions and insights presented in this study were influenced by discussions conducted with multiple stakeholders. The research report features detailed transcripts of interviews held with the following industry stakeholders:
- Former Chief Executive Officer, Cell Therapies
- Chief Executive Officer, Glycostem Therapeutics
- Chief Executive Officer, Gracell Biotechnologies
- Co-Founder and Chief Executive Officer, Lion TCR
- Chief Executive Officer, TxCell
- Vice President, Scientific Affairs, Kite Pharma
- Manager of Business Development, Waisman Biomanufacturing
- Vice President (Immuno-Oncology), Celyad
- Former Director, Process Development, Iovance Biotherapeutics
- Former Competitive Intelligence Manager, Strategy & Business Development, Theravectys
- Professor of Medicine and Director, Department of Oncology, Changhai Hospital
- Assistant Professor of Medicine, University of Colorado
T-CELL THERAPY MARKET: RESEARCH COVERAGE
- Market Sizing and Opportunity Analysis: The report features an in-depth analysis of the T-Cell therapy market, focusing on key market segments, including [A] type of therapy, [B] target indications, [C] target antigens and [D] key geographical regions.
- Market Landscape: A comprehensive evaluation of T-cell immunotherapies, considering various parameters, such as [A] type of developer, [B] phase of development, [C] therapeutic area, [D] key target indication, [E] key target antigen, [F] source of T-cells, [G] route of administration, [H] dose frequency, [I] patient segment, [J] type of therapy and [K] most active industry and non-industry players (in terms of number of pipeline candidates). Additionally, it highlights the developer landscape based on some relevant parameters, including [L] year of establishment, [M] company size and [N] location of headquarters.
- Key Insights: An analysis of key insights derived from the study featuring a competitive analysis, highlighting the popular target antigens related to hematological malignancies and solid tumors. Additionally, it includes CAR construct analysis of clinical-stage CAR-T therapies based on the generation of CAR (first generation, second generation, third generation, and fourth generation), type of binding domain (murine, humanized, fully human, and rabbit derived), type of virus used (lentivirus and retrovirus), type of gene transfer method used (transduction and transfection) and type of co-stimulatory domain used.
- Clinical Trials Analysis: Examination of completed, ongoing, and planned clinical studies of various CAR-Ts, TCRs, and TIL therapies, based on parameters like [A] trial registration year, [B] enrolled patient population, [C] trial recruitment status, [D] trial phase, [E] target patient segment, [F] type of sponsor/collaborator, [G] most active players and [H] regional distribution of trials.
- Key Opinion Leaders (KOLs) Analysis: An in-depth examination that emphasizes the key opinion leaders (KOLs) within this field includes an evaluation of various principal investigators overseeing clinical trials associated with CAR-Ts, TCRs and TILs therapies. In addition, the chapter highlights the most prominent KOLs, based on our proprietary and third-party scoring criteria.
- Drug Profiles: In-depth profiles of marketed and mid- to late-stage clinical products (phase I/II or above), focusing on [A] therapy overviews, [B] its mechanism of action, [C] dosage information, [D] details on the cost, [E] sales information (wherever available), [F] clinical development plan, [G] and key clinical trial results.
- Company Profiles: In-depth profiles of key industry players in engaged in the development of T-cell immunotherapies, focusing on [A] product portfolio specific to CAR-T, TCR and TIL therapies, [B] technology portfolio (if available), [C] recent developments related to T-cell immunotherapies, [D] manufacturing capabilities of the companies and [E] details related to the strategic / venture capital investments made in these companies.
- Emerging Technologies: A comprehensive examination of advanced technology platforms utilized in the development of T-cell therapies, including profiles of major technology providers. Additionally, it includes a comparative analysis of various gene editing platforms employed in T-cell therapy development, focusing on several parameters, such as ease of system design, cost of technology, level of toxicity and efficiency of technology.
- Partnerships and Collaborations: An analysis of partnerships established in this sector, covering R&D agreements, license agreements (specific to technology platforms and product candidates), product development and commercialization agreements, manufacturing agreements, clinical trial collaborations, product supply management agreements, joint ventures and others.
- Funding and Investment Analysis: A detailed evaluation of the investments received by the companies that have proprietary T-cell based products/technologies, encompassing seed financing, venture capital financing, capital raised from IPOs and subsequent offerings, grants and debt financing.
- Patent Analysis: Detailed analysis of various patents filed / granted related to CAR-Ts, TCRs and TILs therapies based on [A] type of patent, [B] publication year, [C] geographical distribution, [D] cooperative patent classification (CPC) symbols, [E] emerging focus areas, [F] type of applicant, [G] leading players (on the basis of number of patents) and [H] patent benchmarking. It also includes a patent benchmarking analysis and a detailed valuation analysis.
- Case Study 1: A case study on other T-cell-based therapies, apart from CAR-Ts, TCRs and TILs, including a detailed analysis of approved / pipeline products, featuring information on the current phase of development, target therapeutic area(s), type of T-cells used and source of T-cells.
- Case Study 2: A case study on manufacturing cell therapy products, highlighting the key challenges, and a detailed list of contract service providers and in-house manufacturers involved in this space.
- Cost Price Analysis: A comprehensive exploration of the various factors that form the pricing of cell-based therapies. This includes an examination of the different models and strategies that pharmaceutical companies may consider when determining the price of T-cell-based immunotherapies that are likely to enter the market in the near future.
- Promotional Analysis: A review of the key promotional strategies being adopted by the developers of the approved CAR-T cell therapies, namely Kymriah(R), Yescarta(R), Tecartus(TM), Breyanzi(R), Abecma(TM), Carvykti(TM) and TCR-based therapies (Kimmtrak(R)).
KEY QUESTIONS ANSWERED IN THIS REPORT
- How many companies are currently engaged in this market?
- Which are the leading companies in this market?
- What kind of partnership models are commonly adopted by industry stakeholders?
- What factors are likely to influence the evolution of this market?
- What is the current and future market size?
- What is the CAGR of this market?
- How is the current and future market opportunity likely to be distributed across key market segments?
REASONS TO BUY THIS REPORT
- The report provides a comprehensive market analysis, offering detailed revenue projections of the overall market and its specific sub-segments. This information is valuable to both established market leaders and emerging entrants.
- Stakeholders can leverage the report to gain a deeper understanding of the competitive dynamics within the market. By analyzing the competitive landscape, businesses can make informed decisions to optimize their market positioning and develop effective go-to-market strategies.
- The report offers stakeholders a comprehensive overview of the market, including key drivers, barriers, opportunities, and challenges. This information empowers stakeholders to stay abreast of market trends and make data-driven decisions to capitalize on growth prospects.
ADDITIONAL BENEFITS
- Complimentary PPT Insights Packs
- Complimentary Excel Data Packs for all Analytical Modules in the Report
- 10% Free Content Customization
- Detailed Report Walkthrough Session with Research Team
- Free Updated report if the report is 6-12 months old or older
TABLE OF CONTENTS
1. PREFACE
- 1.1. Scope of the Report
- 1.2. Market Segmentations
- 1.3. Research Methodology
- 1.4. Key Questions Answered
- 1.5. Chapter Outlines
2. EXECUTIVE SUMMARY
3. INTRODUCTION
- 3.1. Chapter Overview
- 3.2. Pillars of Cancer Therapy
- 3.3. Overview of Immunotherapies
- 3.4. Fundamentals of Cancer Immunotherapy
- 3.5. Classification of Cancer Immunotherapies
- 3.5.1. By Mechanism of Action
- 3.5.2. By Type of Target
- 3.5.3. By Approach
- 3.5.4. By Product Class
- 3.6. T-Cell Immunotherapies
- 3.6.1. Historical Evolution
- 3.6.2. Key Considerations for Developing T-Cell Immunotherapies
- 3.6.3. Strategies Employed for the Redirection of T-Cells
- 3.6.4. Manufacturing of Engineered T-Cells
- 3.6.5. T-Cell Transduction and Transfection Methods
- 3.7. Chimeric Antigen Receptor T-Cell (CAR-T) Therapy
- 3.7.1. Development History
- 3.7.2. Anatomical Layout of CAR
- 3.7.3. Development of CAR-T Cells
- 3.7.4. Universal CAR-T Cells
- 3.7.5. Route of Administration
- 3.7.6. Case Study on CD19 CAR-T Cell Therapies
- 3.7.7. Challenges Associated with Use of CAR-T Cell Therapies
- 3.8. T-Cell Receptor (TCR)-based Cell Therapy
- 3.8.1. Development History
- 3.8.2. Anatomical Layout of TCR
- 3.8.3. Development of TCR Therapy
- 3.8.4. Comparison of CAR-T and TCR-based Therapies
- 3.9. Tumor Infiltrating Lymphocyte (TIL)-based Cell Therapy
- 3.9.1. Development History
- 3.9.2. Development of TILs Therapy
- 3.10. Key Benefits and Roadblocks
- 3.11. Concluding Remarks
4. CAR-T CELL THERAPIES: MARKET LANDSCAPE
- 4.1. Chapter Overview
- 4.2. CAR-T Cell Therapies: Overall Market Landscape
- 4.2.1. Analysis by Type of Developer
- 4.2.2. Analysis by Phase of Development
- 4.2.3. Analysis by Therapeutic Area
- 4.2.4. Analysis by Phase of Development and Therapeutic Area
- 4.2.5. Analysis by Key Target Indications
- 4.2.6. Analysis by Key Target Antigens
- 4.2.7. Analysis by Source of T-Cells
- 4.2.8. Analysis by Phase of Development and Source of T-Cells
- 4.2.9. Analysis by Route of Administration
- 4.2.10. Analysis by Dosing Frequency
- 4.2.11. Analysis by Target Patient Segment
- 4.2.12. Analysis by Type of Therapy
- 4.2.13. Most Active Industry Players: Analysis by Number of CAR-T Cell Therapies
- 4.2.14. Most Active Non-Industry Players: Analysis by Number of CAR-T Cell Therapies
- 4.3. CAR-T Cell Therapies: Overall Developer Landscape
- 4.3.1. Analysis by Year of Establishment
- 4.3.2. Analysis by Company Size
- 4.3.3. Analysis by Location of Headquarters
5. TCR-BASED THERAPIES: MARKET LANDSCAPE
- 5.1. Chapter Overview
- 5.2. TCR-based Therapies: Overall Market Landscape
- 5.2.1. Analysis by Type of Developer
- 5.2.2. Analysis by Phase of Development
- 5.2.3. Analysis by Therapeutic Area
- 5.2.4. Analysis by Phase of Development and Therapeutic Area
- 5.2.5. Analysis by Key Target Indication
- 5.2.6. Analysis by Key Target Antigen
- 5.2.7. Analysis by Source of T-Cells
- 5.2.8. Analysis by Route of Administration
- 5.2.9. Analysis by Phase of Development and Route of Administration
- 5.2.10. Analysis by Dosing Frequency
- 5.2.11. Analysis by Target Patient Segment
- 5.2.12. Analysis by Type of Therapy
- 5.2.13. Analysis by Phase of Development and Type of Therapy
- 5.2.14. Most Active Industry Players: Analysis by Number of TCR-based Therapies
- 5.2.15. Most Active Non-Industry Players: Analysis by Number of TCR-based Therapies
- 5.3. TCR-based Therapies: Overall Developer Landscape
- 5.3.1. Analysis by Year of Establishment
- 5.3.2. Analysis by Company Size
- 5.3.3. Analysis by Location of Headquarters
6. TIL-BASED THERAPIES: MARKET LANDSCAPE
- 6.1. Chapter Overview
- 6.2. TIL-based Therapies: Overall Market Landscape
- 6.2.1. Analysis by Type of Developer
- 6.2.2. Analysis by Phase of Development
- 6.2.3. Analysis by Therapeutic Area
- 6.2.4. Analysis by Key Target Indication
- 6.2.5. Analysis by Source of T-Cells
- 6.2.6. Analysis by Route of Administration
- 6.2.7. Analysis by Dosing Frequency
- 6.2.8. Analysis by Target Patient Segment
- 6.2.9. Analysis by Type of Therapy
- 6.2.10. Most Active Industry Players: Analysis by Number of TIL-based Therapies
- 6.2.11. Most Active Non-Industry Players: Analysis by Number of TIL-based Therapies
- 6.3. TIL-based Therapies: Overall Developer Landscape
- 6.3.1. Analysis by Year of Establishment
- 6.3.2. Analysis by Company Size
- 6.3.3. Analysis by Location of Headquarters
7. KEY INSIGHTS
- 7.1. Chapter Overview
- 7.2. T-Cell Immunotherapies: Competitive Analysis by Popular Target Antigen
- 7.2.1. Popular Targets Related to Hematological Malignancies
- 7.2.2. Popular Targets Related to Solid Tumors
- 7.3. T-Cell Immunotherapies: CAR Construct Analysis
- 7.3.1. Analysis by Generation of CAR
- 7.3.2. Analysis by Type of scFv Antibody
- 7.3.3. Analysis by Type of Virus Used
- 7.3.4. Analysis by Type of Gene Transfer Method Used
- 7.3.5. Analysis by Co-Stimulatory Domain
8. CLINICAL TRIAL ANALYSIS
- 8.1. Chapter Overview
- 8.2. Scope and Methodology
- 8.3. CAR-T Cell Therapies: Clinical Trial Analysis
- 8.3.1. Analysis by Trial Registration Year
- 8.3.2. Analysis by Trial Registration Year and Enrolled Patient Population
- 8.3.3. Analysis by Trial Status
- 8.3.4. Analysis by Trial Registration Year and Trial Status
- 8.3.5. Analysis by Trial Phase
- 8.3.6. Analysis by Trial Phase and Enrolled Patient Population
- 8.3.7. Analysis by Target Patient Segment
- 8.3.8. Analysis by Type of Sponsor / Collaborator
- 8.3.9. Analysis by Study Design
- 8.3.10. Most Active Industry Players: Analysis by Number of Registered Trials
- 8.3.11. Most Active Non-Industry Players: Analysis by Number of Registered Trials
- 8.3.12. Analysis by Key Focus Areas (Word Cloud Representation)
- 8.3.13. Analysis of Clinical Trials by Geography
- 8.3.14. Analysis of Enrolled Patient Population by Geography
- 8.4. TCR-based Therapies: Clinical Trial Analysis
- 8.4.1. Analysis by Trial Registration Year
- 8.4.2. Analysis by Trial Registration Year and Enrolled Patient Population
- 8.4.3. Analysis by Trial Status
- 8.4.4. Analysis by Trial Registration Year and Trial Status
- 8.4.5. Analysis by Trial Phase
- 8.4.6. Analysis by Trial Phase and Enrolled Patient Population
- 8.4.7. Analysis by Target Patient Segment
- 8.4.8. Analysis by Type of Sponsor / Collaborator
- 8.4.9. Analysis by Study Design
- 8.4.10. Most Active Industry Players: Analysis by Number of Registered Trials
- 8.4.11. Most Active Non-Industry Players: Analysis by Number of Registered Trials
- 8.4.12. Analysis by Key Focus Areas (Word Cloud Representation)
- 8.4.13. Analysis of Clinical Trials by Geography
- 8.4.14. Analysis of Enrolled Patient Population by Geography
- 8.5. TIL-based Therapies: Clinical Trial Analysis
- 8.5.1. Analysis by Trial Registration Year
- 8.5.2. Analysis by Trial Registration Year and Enrolled Patient Population
- 8.5.3. Analysis by Trial Status
- 8.5.4. Analysis by Trial Registration Year and Trial Status
- 8.5.5. Analysis by Trial Phase
- 8.5.6. Analysis by Trial Phase and Enrolled Patient Population
- 8.5.7. Analysis by Target Patient Segment
- 8.5.8. Analysis by Type of Sponsor / Collaborator
- 8.5.9. Analysis by Study Design
- 8.5.10. Most Active Industry Players: Analysis by Number of Registered Trials
- 8.5.11. Most Active Non-Industry Players: Analysis by Number of Registered Trials
- 8.5.12. Analysis by Key Focus Areas (Word Cloud Representation)
- 8.5.13. Analysis of Clinical Trials by Geography
- 8.5.14. Analysis of Enrolled Patient Population by Geography
9. KEY OPINION LEADERS
- 9.1. Chapter Overview
- 9.2. Assumptions and Key Parameters
- 9.3. Methodology
- 9.4. CAR-T Cell Therapies: Key Opinion Leaders
- 9.4.1. Analysis by Type of Organization
- 9.4.2. Analysis by Affiliated Organization
- 9.4.3. Analysis by Qualification
- 9.4.4. Analysis by Geographical Location of KOLs
- 9.4.5. KOL Activeness versus KOL Strength
- 9.4.6. Most Prominent KOLs: Analysis by RA score
- 9.4.7. Most Prominent KOLs: Comparison of RA Score and Third-Party Score
- 9.5. TCR-based Therapies: Key Opinion Leaders
- 9.5.1. Analysis by Type of Organization
- 9.5.2. Analysis by Affiliated Organization
- 9.5.3. Analysis by Qualification
- 9.5.4. Analysis by Geographical Location of KOLs
- 9.5.5. KOL Activeness versus KOL Strength
- 9.5.6. Most Prominent KOLs: Analysis by RA score
- 9.5.7. Most Prominent KOLs: Comparison of RA Score and Third-Party Score
- 9.6. TIL-based Therapies: Key Opinion Leaders
- 9.6.1. Analysis by Type of Organization
- 9.6.2. Analysis by Affiliated Organization
- 9.6.3. Analysis by Qualification
- 9.6.4. Analysis by Geographical Location of KOLs
- 9.6.5. KOL Activeness versus KOL Strength
- 9.6.6. Most Prominent KOLs: Analysis by RA score
- 9.6.7. Most Prominent KOLs: Comparison of RA Score and Third-Party Score
10. CAR-T CELL THERAPY PROFILES
- 10.1. Chapter Overview
- 10.2. Kymriah / Tisagenlecleucel / CTL019 (Novartis)
- 10.2.1. Therapy Overview
- 10.2.2. Clinical Trial Information
- 10.2.3. Clinical Trial Endpoints
- 10.2.4. Clinical Trial Results
- 10.2.5. Estimated Sales Revenues
- 10.3. Yescarta / Axiscabtagene Ciloleucel / KTE-C19 (Gilead Sciences)
- 10.3.1. Therapy Overview
- 10.3.2. Clinical Trial Information
- 10.3.3. Clinical Trial Endpoints
- 10.3.4. Clinical Trial Results
- 10.3.5. Estimated Sales Revenues
- 10.4. Tecartus / Brexucabtagene Autoleucel (Gilead Sciences)
- 10.4.1. Therapy Overview
- 10.4.2. Clinical Trial Information
- 10.4.3. Clinical Trial Endpoints
- 10.4.4. Clinical Trial Results
- 10.4.5. Estimated Sales Revenues
- 10.5. Breyanzi / Lisocabtagene Maraleucel / JCAR017 (Bristol Myers Squibb)
- 10.5.1. Therapy Overview
- 10.5.2. Clinical Trial Information
- 10.5.3. Clinical Trial Endpoints
- 10.5.4. Clinical Trial Results
- 10.5.5. Estimated Sales Revenues
- 10.6. Abecma / BB2121 / Idecabtagene Vicleucel (Bristol Myers Squibb)
- 10.6.1. Therapy Overview
- 10.6.2. Clinical Trial Information
- 10.6.3. Clinical Trial Endpoints
- 10.6.4. Clinical Trial Results
- 10.6.5. Estimated Sales Revenues
- 10.7. Carvykti / Ciltacabtagene Autoleucel / LCAR-B38M CAR-T / JNJ-68284528 (Janssen)
- 10.7.1. Therapy Overview
- 10.7.2. Clinical Trial Information
- 10.7.3. Clinical Trial Endpoints
- 10.7.4. Clinical Trial Results
- 10.7.5. Estimated Sales Revenues
- 10.8. Carteyva / Relmacabtagene Autoleucel / JWCAR029 (JW Therapeutics)
- 10.8.1. Therapy Overview
- 10.8.2. Clinical Trial Information
- 10.8.3. Clinical Trial Endpoints
- 10.8.4. Clinical Trial Results
- 10.8.5. Estimated Sales Revenues
- 10.9. TBI-1501 / CD19 CAR-T Cell Therapy (Takara Bio)
- 10.9.1. Therapy Overview
- 10.9.2. Clinical Trial Information
- 10.9.3. Clinical Trial Endpoints
- 10.9.4. Estimated Sales Revenues
- 10.10. AUTO1 / Obecabtagene Autoleucel / obe-cel (Autolus)
- 10.10.1. Therapy Overview
- 10.10.2. Clinical Trial Information
- 10.10.3. Clinical Trial Endpoints
- 10.10.4. Clinical Trial Results
- 10.10.5. Estimated Sales Revenues
- 10.11. AUTO3 / CD19/22 CAR-T (Autolus)
- 10.11.1. Therapy Overview
- 10.11.2. Clinical Trial Information
- 10.11.3. Clinical Trial Endpoints
- 10.11.4. Clinical Trial Results
- 10.11.5. Estimated Sales Revenues
11. TCR-BASED THERAPY PROFILES
- 11.1. Chapter Overview
- 11.2. Kimmtrak / IMCgp100 / Tebentafusp (Immunocore)
- 11.2.1. Therapy Overview
- 11.2.2. Clinical Trial Information
- 11.2.3. Clinical Trial Endpoints
- 11.2.4. Clinical Trial Results
- 11.2.5. Estimated Sales Revenues
- 11.3. GSK3377794 / NY-ESO-1C259 T-Cells / Letetresgene Autoleucel (GlaxoSmithKline)
- 11.3.1. Therapy Overview
- 11.3.2. Clinical Trial Information
- 11.3.3. Clinical Trial Endpoints
- 11.3.4. Clinical Trial Results
- 11.3.5. Estimated Sales Revenues
- 11.4. ADP-A2M4 / Afamitresgene Autoleucel / Afami-cel (Adaptimmune Therapeutics)
- 11.4.1. Therapy Overview
- 11.4.2. Clinical Trial Information
- 11.4.3. Clinical Trial Endpoints
- 11.4.4. Clinical Trial Results
- 11.4.5. Estimated Sales Revenues
- 11.5. JTCR016 (Juno Therapeutics)
- 11.5.1. Therapy Overview
- 11.5.2. Clinical Trial Information
- 11.5.3. Clinical Trial Endpoints
- 11.5.4. Estimated Sales Revenues
- 11.6. TBI-1301 (Takara Bio)
- 11.6.1. Therapy Overview
- 11.6.2. Clinical Trial Information
- 11.6.3. Clinical Trial Endpoints
- 11.6.4. Clinical Trial Results
- 11.6.5. Estimated Sales Revenues
- 11.7. MDG1011 (Medigene)
- 11.7.1. Therapy Overview
- 11.7.2. Clinical Trial Information
- 11.7.3. Clinical Trial Endpoints
- 11.7.4. Clinical Trial Results
- 11.7.5. Estimated Sales Revenues
12. TIL-BASED THERAPY PROFILES
- 12.1. Chapter Overview
- 12.2. LN-144 / Lifileucel (Iovance Biotherapeutics)
- 12.2.1. Therapy Overview
- 12.2.2. Clinical Trial Information
- 12.2.3. Clinical Trial Endpoints
- 12.2.4. Clinical Trial Results
- 12.2.5. Estimated Sales Revenues
- 12.3. LN-145 (Iovance Biotherapeutics)
- 12.3.1. Therapy Overview
- 12.3.2. Clinical Trial Information
- 12.3.3. Clinical Trial Endpoints
- 12.3.4. Clinical Trial Results
- 12.3.5. Estimated Sales Revenues
- 12.4. ITIL-168 (Instil Bio)
- 12.4.1. Therapy Overview
- 12.4.2. Clinical Trial Information
- 12.4.3. Clinical Trial Endpoints
- 12.4.4. Clinical Trial Results
- 12.4.5. Estimated Sales Revenues
- 12.5. LTX-315 (Lytix Biopharma)
- 12.5.1. Therapy Overview
- 12.5.2. Clinical Trial Information
- 12.5.3. Clinical Trial Endpoints
- 12.5.4. Clinical Trial Results
- 12.5.5. Estimated Sales Revenues
13. EMERGING TECHNOLOGIES
- 13.1. Chapter Overview
- 13.2. Genome Editing Technologies
- 13.2.1. Technology Overview
- 13.2.2. Applications of Genome Editing Technologies
- 13.2.3. Emerging Technology Platforms for T-Cell Therapies
- 13.2.3.1. CRISPR / CAS9 System
- 13.2.3.1.1. Key Components
- 13.2.3.1.2. Mechanism of Action
- 13.2.3.1.3. Targeting Efficiency and Challenges
- 13.2.3.1.4. Next-Gen CRISPR Technology
- 13.2.3.1.5. Technology Providers
- 13.2.3.1.5.1. Intellia Therapeutics
- 13.2.3.1.5.2. Editas Medicine
- 13.2.3.1.5.3. CRISPR Therapeutics
- 13.2.3.1.5.4. Beam Therapeutics
- 13.2.3.1.5.5. Gracell Technologies
- 13.2.3.1.5.6. Caribou Biosciences
- 13.2.3.1.5.7. Nanjing Bioheng Biotech
- 13.2.3.1.5.8. Intima Biosciences
- 13.2.3.1.5.9. KSQ Therapeutics
- 13.2.3.1.5.10. Refuge Biotechnologies
- 13.2.3.2. TALENS
- 13.2.3.2.1. Key Components and Function
- 13.2.3.2.2. Mechanism of Action
- 13.2.3.2.3. Advantages and Challenges
- 13.2.3.2.4. Technology Providers
- 13.2.3.2.4.1. Cellectis
- 13.2.3.2.4.2. Editas Medicine
- 13.2.3.3. MegaTAL
- 13.2.3.3.1. Mechanism of Action
- 13.2.3.3.2. Technology Providers
- 13.2.3.3.2.1. bluebird bio
- 13.2.3.3.2.2. Precision Biosciences
- 13.2.3.4. Zinc Finger Nuclease
- 13.2.3.4.1. Mechanism of Action
- 13.2.3.4.2. Technology Providers
- 13.2.3.4.2.1. Sangamo Therapeutics
- 13.2.3.1. CRISPR / CAS9 System
- 13.2.4. Competitive Analysis: Gene Editing Platforms
- 13.3. Designing T-Cell Therapies with Improved Characteristics
- 13.3.1. Technologies for Targeting Multiple Cancers
- 13.3.1.1. Antibody Coupled T-Cell Receptor
- 13.3.1.1.1. Cogent Biosciences
- 13.3.1.2. NKR-T Platform
- 13.3.1.2.1. Celyad
- 13.3.1.2.2. Glycostem
- 13.3.1.2.3. CatamaranBio
- 13.3.1.1. Antibody Coupled T-Cell Receptor
- 13.3.2. Technologies for Improved Safety
- 13.3.2.1. Armored CAR and EGFRt Technology
- 13.3.2.1.1. Juno Therapeutics
- 13.3.2.2. Rheoswitch Therapeutic System
- 13.3.2.2.1. Intrexon
- 13.3.2.2.2. Precigen
- 13.3.2.3. Inducible Caspase 9 Safety Switch
- 13.3.2.3.1. Bellicum Pharmaceuticals
- 13.3.2.3.1.1. CaspaCIDe Technology
- 13.3.2.3.1.2. CIDeCAR Technology
- 13.3.2.3.1.3. GoCAR-T Technology
- 13.3.2.3.1. Bellicum Pharmaceuticals
- 13.3.2.4. On-OFF Switch, Multiple Companies
- 13.3.2.4.1. Inhibitory CAR (iCAR) (Juno Therapeutics)
- 13.3.2.4.2. On-OFF Switch (Theravectys)
- 13.3.2.5. Other Technologies to Improve CAR-T Safety
- 13.3.2.1. Armored CAR and EGFRt Technology
- 13.3.3. Allogeneic Technologies
- 13.3.3.1. CIK CAR-T Cells (Formula Pharmaceuticals)
- 13.3.3.2. Allogeneic Platform (CELYAD)
- 13.3.3.3. Allogeneic Platform (Cellectis)
- 13.3.3.4. AlloCAR T (Allogene Therapeutics)
- 13.3.1. Technologies for Targeting Multiple Cancers
- 13.4. Future Perspectives
14. PARTNERSHIPS AND COLLABORATIONS
- 14.1. Chapter Overview
- 14.2. Partnership Models
- 14.3. T-Cell Immunotherapies Market: Partnerships and Collaborations
- 14.3.1. Analysis by Year of Partnership
- 14.3.2. Analysis by Type of Partnership
- 14.3.3. Analysis by Type of Product
- 14.3.4. Analysis by Year of Partnership and Type of Product
- 14.3.5. Analysis by Type of Partnership and Type of Product
- 14.3.6. Analysis by Type of Partner
- 14.3.7. Analysis by Type of Product and Type of Partner
- 14.3.8. Most Popular Products: Analysis by Number of Partnerships
- 14.3.9. Most Active Industry Players: Analysis by Number of Partnerships
- 14.3.10. Most Active Non-Industry Players: Analysis by Number of Partnerships
- 14.3.11. Analysis by Geography
- 14.3.11.1. Intercontinental and Intracontinental Agreements
- 14.3.11.2. International and Local Deals
15. FUNDING AND INVESTMENT ANALYSIS
- 15.1. Chapter Overview
- 15.2. Type of Funding
- 15.3. T-Cell Immunotherapy Market: Funding and Investment Analysis
- 15.3.1. Analysis of Instances by Year
- 15.3.2. Analysis of Amount Invested by Year
- 15.3.3. Analysis by Type of Funding
- 15.3.4. Analysis of Amount Invested across Different Types of Therapies
- 15.3.5. Analysis by Type of Investor
- 15.3.6. Most Active Players: Analysis by Number of Instances
- 15.3.7. Most Active Investors: Analysis by Amount Invested
- 15.3.8. Analysis of Amount Invested by Geography
- 15.3.9. Most Active Investors: Analysis by Number of Funding Instances
16. PATENT ANALYSIS
- 16.1. Chapter Overview
- 16.2. Scope and Methodology
- 16.3. Patent Analysis: Distribution by Type of Patent
- 16.4. CAR-T Cell Therapies: Patent Analysis
- 16.4.1. Analysis by Patent Publication Year
- 16.4.2. Analysis by Patent Application Year
- 16.4.3. Analysis by Geography
- 16.4.4. Analysis by Type of Player
- 16.4.5. Analysis by CPC Symbols
- 16.4.6. Analysis by Key Focus Area
- 16.4.7. Leading Players: Analysis by Number of Patents
- 16.4.8. Car-T Cell Therapies: Patent Benchmarking
- 16.4.9. Analysis By Patent Characteristics
- 16.4.10. Car-T Cell Therapies: Patent Valuation
- 16.5. TCR- based Therapies
- 16.5.1. Analysis by Patent Publication Year
- 16.5.2. Analysis By Patent Application Year
- 16.5.3. Analysis by Geography
- 16.5.4. Analysis by Type of Player
- 16.5.5. Analysis by CPC Symbols
- 16.5.6. Analysis by Key Focus Area
- 16.5.7. Leading Player: Analysis by Number of Patents
- 16.5.8. TCR-based Therapies: Patent Benchmarking
- 16.5.9. Analysis By Patent Characteristics
- 16.5.10. TCR-based Cell Therapies: Patent Valuation
- 16.6. TIL- based Therapies
- 16.6.1. Analysis by Patent Publication Year
- 16.6.2. Analysis By Patent Application Year
- 16.6.3. Analysis by Geography
- 16.6.4. Analysis by Type of Player
- 16.6.5. Analysis by CPC Symbols
- 16.6.6. Analysis by Key Focus Area
- 16.6.7. Leading Player: Analysis by Number of Patents
- 16.6.8. TIL-based Therapies: Patent Benchmarking
- 16.6.9. Analysis By Patent Characteristics
- 16.6.10. TIL-based Therapies: Patent Valuation
17. OTHER T-CELL IMMUNOTHERAPIES
- 17.1. Chapter Overview
- 17.2. Other T-Cell Immunotherapies
- 17.2.1. Fucosylated T-Cell Therapies
- 17.2.2. Gamma Delta T-Cell Therapies
- 17.2.3. PD-1 Knockout Engineered T-Cell Therapies
- 17.2.4. TAC T-Cell Therapies
- 17.2.5. T-Cell Vaccines
- 17.2.6. Treg Cell Therapies
- 17.2.7. Virus-Driven T-Cell Therapies
- 17.3. Other T-Cell Immunotherapies: Market Overview
- 17.3.1. Analysis by Type of T-Cell
- 17.3.2. Analysis by Source of T-Cell
- 17.3.3. Analysis by Phase of Development
- 17.3.4. Analysis by Therapeutic Area
- 17.4. Key Considerations for Developing T-Cell Immunotherapies
- 17.5. Concluding Remarks
18. CASE STUDY: CELL THERAPY MANUFACTURING
- 18.1. Chapter Overview
- 18.2. Overview of Cell Therapy Manufacturing
- 18.3. Cell Therapy Manufacturing Models
- 18.3.1. Centralized Manufacturing Model
- 18.3.2. Decentralized Manufacturing Model
- 18.4. Scalability of Cell Therapy Manufacturing Processes
- 18.4.1. Scale-Up
- 18.4.2. Scale-Out
- 18.5. Types of Cell Therapy Manufacturers
- 18.6. Key Challenges Related to Manufacturing of Cell Therapies
- 18.7. Important Factors for Cell Therapy Manufacturing
- 18.7.1. Characterization
- 18.7.2. Cost of Goods
- 18.8. Automation of Cell Therapy Manufacturing Process
- 18.9. Cell Therapy Manufacturing Supply Chain
- 18.10. Comparison of Player Having In-House Capabilities and Contract Manufacturers
- 18.11. Regulatory Landscape
- 18.12. Future Perspectives
19. COST PRICE ANALYSIS
- 19.1. Chapter Overview
- 19.2. Factors Contributing to the High Price of Cell / Gene Therapies
- 19.3. Pricing Models for T-Cell Immunotherapies
- 19.3.1. Based on Associated Costs
- 19.3.2. Based on Availability of Competing Products
- 19.3.3. Based on Patient Segment
- 19.3.4. Based on Opinions of Industry Experts
- 19.4. Reimbursement related Considerations for T-Cell Immunotherapies
- 19.4.1. Case Study: The National Institute for Health and Care Excellence (NICE) Appraisal of CAR-T therapies
20. MARKET FORECAST AND OPPORTUNITY ANALYSIS
- 20.1. Chapter Overview
- 20.2. Scope and Limitations
- 20.3. Key Assumptions And Forecast Methodology
- 20.4. Overall T-Cell Immunotherapy Market, till 2035
- 20.4.1. T-Cell Immunotherapy Market: Analysis by Type of Therapy
- 20.4.2. T-Cell Immunotherapy Market: Analysis by Target Indication
- 20.4.3. T-Cell Immunotherapy Market: Analysis by Target Antigen
- 20.4.4. T-Cell Immunotherapy Market: Analysis by Key Players
- 20.4.5. T-Cell Immunotherapy Market: Analysis by Geography
- 20.5. T-Cell Immunotherapy Market: Value Creation Analysis
- 20.6. Overall CAR-T Cell Therapies Market, till 2035
- 20.6.1. CAR-T Cell Therapies Market: Analysis by Target Indication
- 20.6.2. CAR-T Cell Therapies Market: Analysis by Target Antigen
- 20.6.3. CAR-T Cell Therapies Market: Analysis by Key Players
- 20.6.4. CAR-T Cell Therapies Market: Analysis by Geography
- 20.6.5. Product Wise Sales Forecast
- 20.6.5.1. Kymriah / Tisagenlecleucel / CTL019 (Novartis)
- 20.6.5.1.1. Sales Forecast (USD Million)
- 20.6.5.1.2. Net Present Value
- 20.6.5.1.3. Value Creation Analysis
- 20.6.5.2. Yescarta / Axiscabtagene Ciloleucel / KTE-C19 (Gilead Sciences)
- 20.6.5.2.1. Sales Forecast (USD Million)
- 20.6.5.2.2. Net Present Value (USD Million)
- 20.6.5.2.3. Value Creation Analysis
- 20.6.5.3. Tecartus / Brexucabtagene Autoleucel (Gilead Sciences)
- 20.6.5.3.1. Sales Forecast (USD Million)
- 20.6.5.3.2. Net Present Value (USD Million)
- 20.6.5.3.3. Value Creation Analysis
- 20.6.5.4. Abecma / BB2121 / Idecabtagene Vicleucel (Bristol Myers Squibb)
- 20.6.5.4.1. Sales Forecast (USD Million)
- 20.6.5.4.2. Net Present Value (USD Million)
- 20.6.5.4.3. Value Creation Analysis
- 20.6.5.5. Carvykti / Ciltacabtagene Autoleucel / LCAR-B38M CAR-T / JNJ-68284528 (Janssen)
- 20.6.5.5.1. Sales Forecast (USD Million)
- 20.6.5.5.2. Net Present Value (USD Million)
- 20.6.5.5.3. Value Creation Analysis
- 20.6.5.6. Breyanzi / Lisocabtagene Maraleucel / JCAR017 (Bristol Myers Squibb)
- 20.6.5.6.1. Sales Forecast (USD Million)
- 20.6.5.6.2. Net Present Value (USD Million)
- 20.6.5.6.3. Value Creation Analysis
- 20.6.5.7. Carteyva / Relmacabtagene Autoleucel / JWCAR029 (JW Therapeutics)
- 20.6.5.7.1. Sales Forecast (USD Million)
- 20.6.5.7.2. Net Present Value (USD Million)
- 20.6.5.7.3. Value Creation Analysis
- 20.6.5.8. BCMA CAR-T Cells (Shanghai Unicar-Therapy Bio-medicine Technology)
- 20.6.5.8.1. Sales Forecast (USD Million)
- 20.6.5.8.2. Net Present Value (USD Million)
- 20.6.5.8.3. Value Creation Analysis
- 20.6.5.9. CD19 CAR-T (Wuhan Si'an Medical Technology)
- 20.6.5.9.1. Sales Forecast (USD Million)
- 20.6.5.9.2. Net Present Value (USD Million)
- 20.6.5.9.3. Value Creation Analysis
- 20.6.5.10. Descartes-11 (Cartesian Therapeutics)
- 20.6.5.10.1. Sales Forecast (USD Million)
- 20.6.5.10.2. Net Present Value (USD Million)
- 20.6.5.10.3. Value Creation Analysis
- 20.6.5.11. Descartes-08 (Cartesian Therapeutics)
- 20.6.5.11.1. Sales Forecast (USD Million)
- 20.6.5.11.2. Net Present Value (USD Million)
- 20.6.5.11.3. Value Creation Analysis
- 20.6.5.12. Zamtocabtagene Autoleucel / MB-CART2019.1 (Miltenyi Biomedicine)
- 20.6.5.12.1. Sales Forecast (USD Million)
- 20.6.5.12.2. Net Present Value (USD Million)
- 20.6.5.12.3. Value Creation Analysis
- 20.6.5.13. CNCT19 / HY001 (Juventas Cell Therapy)
- 20.6.5.13.1. Sales Forecast (USD Million)
- 20.6.5.13.2. Net Present Value (USD Million)
- 20.6.5.13.3. Value Creation Analysis
- 20.6.5.14. CD30.CAR-T / TT11 (Tessa Therapeutics)
- 20.6.5.14.1. Sales Forecast (USD Million)
- 20.6.5.14.2. Net Present Value (USD Million)
- 20.6.5.14.3. Value Creation Analysis
- 20.6.5.15. TAK-007 (Takeda)
- 20.6.5.15.1. Sales Forecast (USD Million)
- 20.6.5.15.2. Net Present Value (USD Million)
- 20.6.5.15.3. Value Creation Analysis
- 20.6.5.16. AUTO1 (Autolus)
- 20.6.5.16.1. Sales Forecast (USD Million)
- 20.6.5.16.2. Net Present Value (USD Million)
- 20.6.5.16.3. Value Creation Analysis
- 20.6.5.17. AUTO3 (Autolus)
- 20.6.5.17.1. Sales Forecast (USD Million)
- 20.6.5.17.2. Net Present Value (USD Million)
- 20.6.5.17.3. Value Creation Analysis
- 20.6.5.18. CD19-CAR-T (Bioray Laboratories)
- 20.6.5.18.1. Sales Forecast (USD Million)
- 20.6.5.18.2. Net Present Value (USD Million)
- 20.6.5.18.3. Value Creation Analysis
- 20.6.5.19. Humanized CD19-CAR-T (Shanghai Unicar-Therapy Bio-medicine Technology)
- 20.6.5.19.1. Sales Forecast (USD Million)
- 20.6.5.19.2. Net Present Value (USD Million)
- 20.6.5.19.3. Value Creation Analysis
- 20.6.5.20. IM19 CAR-T (Beijing Immunochina Medical Science & Technology)
- 20.6.5.20.1. Sales Forecast (USD Million)
- 20.6.5.20.2. Net Present Value (USD Million)
- 20.6.5.20.3. Value Creation Analysis
- 20.6.5.21. CCT301 CAR-T (Shanghai PerHum Therapeutics)
- 20.6.5.21.1. Sales Forecast (USD Million)
- 20.6.5.21.2. Net Present Value (USD Million)
- 20.6.5.21.3. Value Creation Analysis
- 20.6.5.22. BinD19 (Shenzhen BinDeBio)
- 20.6.5.22.1. Sales Forecast (USD Million)
- 20.6.5.22.2. Net Present Value (USD Million)
- 20.6.5.22.3. Value Creation Analysis
- 20.6.5.23. CARCIK-CD19 (CoImmune)
- 20.6.5.23.1. Sales Forecast (USD Million)
- 20.6.5.23.2. Net Present Value (USD Million)
- 20.6.5.23.3. Value Creation Analysis
- 20.6.5.24. PBCAR269A (Precision BioSciences / Servier)
- 20.6.5.24.1. Sales Forecast (USD Million)
- 20.6.5.24.2. Net Present Value (USD Million)
- 20.6.5.24.3. Value Creation Analysis
- 20.6.5.25. CD123 CAR-T cells (Chongqing Precision Biotechnology)
- 20.6.5.25.1. Sales Forecast (USD Million)
- 20.6.5.25.2. Net Present Value (USD Million)
- 20.6.5.25.3. Value Creation Analysis
- 20.6.5.26. BCMA CAR-T (Chongqing Precision Biotechnology)
- 20.6.5.26.1. Sales Forecast (USD Million)
- 20.6.5.26.2. Net Present Value (USD Million)
- 20.6.5.26.3. Value Creation Analysis
- 20.6.5.27. CD19/CD22-CAR-T (Shanghai Unicar-Therapy Bio-medicine Technology)
- 20.6.5.27.1. Sales Forecast (USD Million)
- 20.6.5.27.2. Net Present Value (USD Million)
- 20.6.5.27.3. Value Creation Analysis
- 20.6.5.28. GC012F / Dual CAR-BCMA-19 (Gracell Biotechnology)
- 20.6.5.28.1. Sales Forecast (USD Million)
- 20.6.5.28.2. Net Present Value (USD Million)
- 20.6.5.28.3. Value Creation Analysis
- 20.6.5.29. iC9-CAR19 T cells (Bellicum Pharmaceuticals)
- 20.6.5.29.1. Sales Forecast (USD Million)
- 20.6.5.29.2. Net Present Value (USD Million)
- 20.6.5.29.3. Value Creation Analysis
- 20.6.5.30. ALLO-501A / ALLO-501 (Allogene Therapeutics)
- 20.6.5.30.1. Sales Forecast (USD Million)
- 20.6.5.30.2. Net Present Value (USD Million)
- 20.6.5.30.3. Value Creation Analysis
- 20.6.5.31. CD19/CD20-CAR-T (Yake Biotechnology)
- 20.6.5.31.1. Sales Forecast (USD Million)
- 20.6.5.31.2. Net Present Value (USD Million)
- 20.6.5.31.3. Value Creation Analysis
- 20.6.5.32. CD7 CAR-T (PersonGen BioTherapeutics)
- 20.6.5.32.1. Sales Forecast (USD Million)
- 20.6.5.32.2. Net Present Value (USD Million)
- 20.6.5.32.3. Value Creation Analysis
- 20.6.5.33. Anti-FLT3 CAR-T / TAA05 (PersonGen BioTherapeutics)
- 20.6.5.33.1. Sales Forecast (USD Million)
- 20.6.5.33.2. Net Present Value (USD Million)
- 20.6.5.33.3. Value Creation Analysis
- 20.6.5.34. CT053 (CARsgen Therapeutics)
- 20.6.5.34.1. Sales Forecast (USD Million)
- 20.6.5.34.2. Net Present Value (USD Million)
- 20.6.5.34.3. Value Creation Analysis
- 20.6.5.35. Anti-ALPP CAR-T Cells (TCRCure Biopharma)
- 20.6.5.35.1. Sales Forecast (USD Million)
- 20.6.5.35.2. Net Present Value (USD Million)
- 20.6.5.35.3. Value Creation Analysis
- 20.6.5.36. BCMA targeted prime CAR-T cells (Chongqing Precision Biotechnology)
- 20.6.5.36.1. Sales Forecast (USD Million)
- 20.6.5.36.2. Net Present Value (USD Million)
- 20.6.5.36.3. Value Creation Analysis
- 20.6.5.37. ALLO-605 (Allogene Therapeutics)
- 20.6.5.37.1. Sales Forecast (USD Million)
- 20.6.5.37.2. Net Present Value (USD Million)
- 20.6.5.37.3. Value Creation Analysis
- 20.6.5.38. WU CART 007 (Wugen)
- 20.6.5.38.1. Sales Forecast (USD Million)
- 20.6.5.38.2. Net Present Value (USD Million)
- 20.6.5.38.3. Value Creation Analysis
- 20.6.5.39. CT103A (Nanjing IASO Biotherapeutics)
- 20.6.5.39.1. Sales Forecast (USD Million)
- 20.6.5.39.2. Net Present Value (USD Million)
- 20.6.5.39.3. Value Creation Analysis
- 20.6.5.1. Kymriah / Tisagenlecleucel / CTL019 (Novartis)
- 20.7. Overall TCR-based Therapies Market
- 20.7.1. TCR-Based Therapies Market: Analysis by Target Indication
- 20.7.2. TCR-Based Therapies Market: Analysis by Target Antigen
- 20.7.3. TCR-Based Therapies Market: Analysis by Key Players
- 20.7.4. TCR-Based Therapies Market: Analysis by Geography
- 20.7.5. Product Wise Sales Forecast
- 20.7.5.1. Kimmtrak (IMCgp100 / Tebentafusp) (Immunocore)
- 20.7.5.1.1. Sales Forecast (USD Million)
- 20.7.5.1.2. Net Present Value (USD Million)
- 20.7.5.1.3. Value Creation Analysis
- 20.7.5.2. GSK3377794 (GlaxoSmithKline)
- 20.7.5.2.1. Sales Forecast (USD Million)
- 20.7.5.2.2. Net Present Value (USD Million)
- 20.7.5.2.3. Value Creation Analysis
- 20.7.5.3. YT-E001 (China Immunotech)
- 20.7.5.3.1. Sales Forecast (USD Million)
- 20.7.5.3.2. Net Present Value (USD Million)
- 20.7.5.3.3. Value Creation Analysis
- 20.7.5.4. ADP-A2M4 / Afamitresgene Autoleucel / Afami-cel (Adaptimmune Therapeutics)
- 20.7.5.4.1. Sales Forecast (USD Million)
- 20.7.5.4.2. Net Present Value (USD Million)
- 20.7.5.4.3. Value Creation Analysis
- 20.7.5.5. EBV-specific TCR-T cell with anti-PD1 auto-secreted element (TCRCure Biopharma)
- 20.7.5.5.1. Sales Forecast (USD Million)
- 20.7.5.5.2. Net Present Value (USD Million)
- 20.7.5.5.3. Value Creation Analysis
- 20.7.5.6. NTLA-5001 (Intellia Therapeutics)
- 20.7.5.6.1. Sales Forecast (USD Million)
- 20.7.5.6.2. Net Present Value (USD Million)
- 20.7.5.6.3. Value Creation Analysis
- 20.7.5.7. TBI-1301 (Takara Bio)
- 20.7.5.7.1. Sales Forecast (USD Million)
- 20.7.5.7.2. Net Present Value (USD Million)
- 20.7.5.7.3. Value Creation Analysis
- 20.7.5.8. LMBP2-specific TCR-T (Xinqiao Hospital of Chongqing / TCR CURE Biopharma Technology)
- 20.7.5.8.1. Sales Forecast (USD Million)
- 20.7.5.8.2. Net Present Value (USD Million)
- 20.7.5.8.3. Value Creation Analysis
- 20.7.5.9. FH-MCVA2TCR (TCRCure Biopharma)
- 20.7.5.9.1. Sales Forecast (USD Million)
- 20.7.5.9.2. Net Present Value (USD Million)
- 20.7.5.9.3. Value Creation Analysis
- 20.7.5.1. Kimmtrak (IMCgp100 / Tebentafusp) (Immunocore)
- 20.8. Overall TIL-Based Therapies Market
- 20.8.1. TIL-Based Therapies Market: Analysis by Target Indication
- 20.8.2. TIL-Based Therapies Market: Analysis by Key Players
- 20.8.3. TIL-Based Therapies Market: Analysis by Geography
- 20.8.3.1. Lifileucel / LN-144 (Iovance Biotherapeutics)
- 20.8.3.1.1. Sales Forecast (USD Million)
- 20.8.3.1.2. Net Present Value (USD Million)
- 20.8.3.1.3. Value Creation Analysis
- 20.8.3.2. LN-145 (Iovance Biotherapeutics)
- 20.8.3.2.1. Sales Forecast (USD Million)
- 20.8.3.2.2. Net Present Value (USD Million)
- 20.8.3.2.3. Value Creation Analysis
- 20.8.3.3. LTX-315 and TILs (Lytix Biopharma)
- 20.8.3.3.1. Sales Forecast (USD Million)
- 20.8.3.3.2. Net Present Value (USD Million)
- 20.8.3.3.3. Value Creation Analysis
- 20.8.3.4. TILs (Prometheus Laboratories)
- 20.8.3.4.1. Sales Forecast (USD Million)
- 20.8.3.4.2. Net Present Value (USD Million)
- 20.8.3.4.3. Value Creation Analysis
- 20.8.3.5. Donor Lymphocyte Infusion (Incyte)
- 20.8.3.5.1. Sales Forecast (USD Million)
- 20.8.3.5.2. Net Present Value (USD Million)
- 20.8.3.5.3. Value Creation Analysis
- 20.8.3.6. ITIL-168 (Instil Bio)
- 20.8.3.6.1. Sales Forecast (USD Million)
- 20.8.3.6.2. Net Present Value (USD Million)
- 20.8.3.6.3. Value Creation Analysis
- 20.8.3.7. IOV-2001 (Iovance Biotherapeutics)
- 20.8.3.7.1. Sales Forecast (USD Million)
- 20.8.3.7.2. Net Present Value (USD Million)
- 20.8.3.7.3. Value Creation Analysis
- 20.8.3.8. TILs (CAR-T (Shanghai) Cell Biotechnology)
- 20.8.3.8.1. Sales Forecast (USD Million)
- 20.8.3.8.2. Net Present Value (USD Million)
- 20.8.3.8.3. Value Creation Analysis
- 20.8.3.9. TILs (Bristol-Myers Squibb)
- 20.8.3.9.1. Sales Forecast (USD Million)
- 20.8.3.9.2. Net Present Value (USD Million)
- 20.8.3.9.3. Value Creation Analysis
- 20.8.3.1. Lifileucel / LN-144 (Iovance Biotherapeutics)
21. PROMOTIONAL ANALYSIS
- 21.1. Chapter Overview
- 21.2. Channels Used for Promotional Campaigns
- 21.3. Summary of Product Website Analysis
- 21.4. Summary of Patient Support Services and Informative Downloads
- 21.5. Kymriah: Promotional Analysis
- 21.5.1. Drug Overview
- 21.5.2. Product Website Analysis
- 21.5.2.3. Informative Downloads
- 21.5.3. Patient Support Services
- 21.6. Yescarta: Promotional Analysis
- 21.6.1. Drug Overview
- 21.6.2. Product Website Analysis
- 21.6.2.3. Informative Downloads
- 21.6.3. Patient Support Services
- 21.7. Tecartus: Promotional Analysis
- 21.7.1. Drug Overview
- 21.7.2. Product Website Analysis
- 21.7.3. Patient Support Services
- 21.8. Breyanzi: Promotional Analysis
- 21.8.1. Drug Overview
- 21.8.2. Product Website Analysis
- 21.8.3. Patient Support Services
- 21.9. Abecma: Promotional Analysis
- 21.9.1. Drug Overview
- 21.9.2. Product Website Analysis
- 21.9.3. Patient Support Services
- 21.10. Carvykti: Promotional Analysis
- 21.10.1. Drug Overview
- 21.10.2. Product Website Analysis
- 21.10.3. Patient Support Services
- 21.11. Kimmtrak: Promotional Analysis
- 21.11.1. Drug Overview
- 21.11.2. Product Website Analysis
- 21.11.3. Patient Support Services
22. COMPANY PROFILES
- 22.1. Chapter Overview
- 22.2. Adaptimmune Therapeutics
- 22.3. Alaunos Therapeutics
- 22.4. Autolus
- 22.5. bluebird Bio
- 22.6. Bristol Myers Squibb
- 22.7. Carsgen Therapeutics
- 22.8. Cellectis
- 22.9. Cellular Biomedicine Group
- 22.10. Gilead Sciences
- 22.11. GlaxoSmithKline
- 22.12. Immatics
- 22.13. Immunocore
- 22.14. Innovative Cellular Therapeutics
- 22.15. Iovance Biotherapeutics
- 22.16. Kuur Therapeutics
- 22.17. Lion TCR
- 22.18. Noile-Immune Biotech
- 22.19. Novartis
- 22.20. Shanghai GeneChem
- 22.21. Sinobioway Cell Therapy
- 22.22. Takara Bio
- 22.23. Wellington Zhaotai Therapies
- 22.24. Zelluna immunotherapy
23. CONCLUDING REMARKS
24. EXECUTIVE INSIGHTS
- 24.1. Chapter Overview
- 24.2. Cell Therapies
- 24.2.1. Interview Transcript: Former Chief Executive Officer
- 24.3. Glycostem Therapeutics
- 24.3.1. Interview Transcript: Chief Executive Officer
- 24.4. Gracell Biotechnologies
- 24.4.1. Interview Transcript: Chief Executive Officer
- 24.5. Lion TCR
- 24.5.1. Interview Transcript: Co-Founder and Chief Executive Officer
- 24.6. TxCell
- 24.6.1. Interview Transcript: Chief Executive Officer
- 24.7. Kite Pharma
- 24.7.1. Interview Transcript: Vice President, Scientific Affairs
- 24.8. Celyad
- 24.8.1. Interview Transcript: Vice President, Immuno-Oncology
- 24.9. Iovance Biotherapeutics
- 24.9.1. Interview Transcript: Former Director, Process Development
- 24.10. Waisman Biomanufacturing
- 24.10.1. Interview Transcript: Director, Business Development
- 24.11. Theravectys
- 24.11.1. Interview Transcript: Former Competitive Intelligence Manager, Strategy & Business Development
- 24.12. Changhai Hospital
- 24.12.1. Interview Transcript: Professor of Medicine and Director, Department of Oncology
- 24.13. University of Colorado
- 24.13.1. Interview Transcript: Assistant Professor of Medicine
25. APPENDIX 1: TABULATED DATA
26. APPENDIX 2: LIST OF COMPANIES AND ORGANIZATIONS
List of Tables
- Table 3.1 Types of Immunotherapies and Affiliated Mechanisms of Action
- Table 3.2 FDA Approved Antibody based Cancer Therapeutics
- Table 3.3 Key Characteristics of CAR-T Cells
- Table 3.4 Comparison of First and Second-Generation CAR-Ts
- Table 3.5 CD19 CAR-T Cells: Preclinical Results
- Table 3.6 Other Targets under Clinical / Preclinical Studies for CAR-T Cell Therapies
- Table 3.7 CAR-T Cell and TCR-based Therapies: Key Differences
- Table 4.1 CAR-T Cell Therapies: Clinical Pipeline
- Table 4.2 CAR-T Cell Therapies: Information on Route of Administration, Source of T-Cells, Target Patient Segment, Type of Therapy and Dosing Frequency
- Table 4.3 CAR-T Cell Therapies: Preclinical Pipeline
- Table 4.4 List of CAR-T cells Developers
- Table 5.1 TCR-based Therapies: Clinical Pipeline
- Table 5.2 TCR-based Therapies: Information on Route of Administration, Source of T-Cells, Dosing Frequency, Target Patient Segment and Type of Therapy
- Table 5.3 TCR-based Therapies: Preclinical Pipeline
- Table 5.4 List of TCR-based Developers,
- Table 6.1 TIL-based Therapies: Clinical Pipeline
- Table 6.2 TIL-based Therapies: Information on Route of Administration, Source of T-Cells, Dosing Frequency, Target Patient Segment and Type of Therapy
- Table 6.3 TIL-based Therapies: Preclinical Pipeline
- Table 6.4 List of TIL-based Developers
- Table 7.1 CAR-T Therapies: Information on Constructs of Clinical Candidates
- Table 10.1 CAR-T Cell Therapies: List of Therapies Profiled
- Table 10.2 Therapy Profile: Kymriah(R) (Novartis)
- Table 10.3 Kymriah(R): Clinical Trial Information
- Table 10.4 Kymriah(R): Clinical Trial Endpoints
- Table 10.5 Kymriah(R): Clinical Trial Results
- Table 10.6 Therapy Profile: Yescarta(R) (Gilead Sciences)
- Table 10.7 Yescarta(R): Clinical Trial Information
- Table 10.8 Yescarta(R): Clinical Trial Endpoints
- Table 10.9 Yescarta(R): Clinical Trial Results
- Table 10.10 Therapy Profile: Tecartus(TM) (Gilead Sciences)
- Table 10.11 Tecartus(TM): Clinical Trial Information
- Table 10.12 Tecartus(TM): Clinical Trial Endpoints
- Table 10.13 Tecartus(TM): Clinical Trial Results
- Table 10.14 Therapy Profile: Breyanzi(R) (Bristol Myers Squibb)
- Table 10.15 Breyanzi(R): Clinical Trial Information
- Table 10.16 Breyanzi(R): Clinical Trial Endpoints
- Table 10.17 Breyanzi(R): Clinical Trial Results
- Table 10.18 Therapy Profile: Abecma(R) (Bristol Myers Squibb)
- Table 10.19 Abecma(R): Clinical Trial Information
- Table 10.20 Abecma(R): Clinical Trial Endpoints
- Table 10.21 Abecma(R): Clinical Trial Results
- Table 10.22 Therapy Profile: Carvykti(TM) (Janssen)
- Table 10.23 Carvykti(TM): Clinical Trial Information
- Table 10.24 Carvykti(TM): Clinical Trial Endpoints
- Table 10.25 Carvykti(TM): Clinical Trial Results
- Table 10.26 Therapy Profile: Carteyva (JW Therapeutics)
- Table 10.27 Carteyva: Clinical Trial Information
- Table 10.28 Carteyva: Clinical Trial Endpoints
- Table 10.29 Carteyva: Clinical Trial Results
- Table 10.30 Therapy Profile: TBI-1501 (Takara Bio)
- Table 10.31 TBI-1501: Clinical Trial Information
- Table 10.32 TBI-1501: Clinical Trial Endpoints
- Table 10.33 Therapy Profile: AUTO1 (Autolus)
- Table 10.34 AUTO1: Clinical Trial Information
- Table 10.35 AUTO1: Clinical Trial Endpoints
- Table 10.36 AUTO1: Clinical Trial Results
- Table 10.37 Therapy Profile: AUTO3 (Autolus)
- Table 10.38 AUTO3: Clinical Trial Information
- Table 10.39 AUTO3: Clinical Trial Endpoints
- Table 10.40 AUTO3: Clinical Trial Results
- Table 11.1 TCR Cell Therapies: List of Therapies Profiled
- Table 11.2 Therapy Profile: Kimmtrak (Immunocore)
- Table 11.3 Kimmtrak: Clinical Trial Information
- Table 11.4 Kimmtrak: Clinical Trial Endpoints
- Table 11.5 Kimmtrak: Clinical Trial Results
- Table 11.6 Therapy Profile: GSK3377794 (GlaxoSmithKline)
- Table 11.7 GSK3377794: Clinical Trial Information
- Table 11.8 GSK3377794: Clinical Trial Endpoints
- Table 11.9 GSK3377794: Clinical Trial Results
- Table 11.10 Therapy Profile: ADP-A2M4 (Adaptimmune Therapeutics)
- Table 11.11 ADP-A2M4: Clinical Trial Information
- Table 11.12 ADP-A2M4: Clinical Trial Endpoints
- Table 11.13 ADP-A2M4: Clinical Trial Results
- Table 11.14 Therapy Profile: JTCR016 (Juno Therapeutics (Bristol Myers Squibb))
- Table 11.15 JTCR016: Clinical Trial Information
- Table 11.16 JTCR016: Clinical Trial Endpoints
- Table 11.17 Therapy Profile: TBI-1301 (Takara Bio)
- Table 11.18 TBI-1301: Clinical Trial Information
- Table 11.19 TBI-1301: Clinical Trial Endpoints
- Table 11.20 TBI-1301: Clinical Trial Results
- Table 11.21 Therapy Profile: MDG1011 (Medigene)
- Table 11.22 MDG1011: Clinical Trial Information
- Table 11.23 MDG1011: Clinical Trial Endpoints
- Table 11.24 MDG1011: Clinical Trial Results
- Table 12.1 TIL Cell Therapies: List of Therapies Profiled
- Table 12.2 Therapy Profile: LN-144 (Iovance Biotherapeutics)
- Table 12.3 LN-144: Clinical Trial Information
- Table 12.4 LN-144: Clinical Trial Endpoints
- Table 12.5 LN-144: Clinical Trial Results
- Table 12.6 Therapy Profile: LN-145 (Iovance Biotherapeutics)
- Table 12.7 LN-145: Clinical Trial Information
- Table 12.8 LN-145: Clinical Trial Endpoints
- Table 12.9 LN-145: Clinical Trial Results
- Table 12.10 Therapy Profile: ITIL-168 (Instil Bio)
- Table 12.11 ITIL-168: Clinical Trial Information
- Table 12.12 ITIL-168: Clinical Trial Endpoints
- Table 12.13 ITIL-168: Clinical Trial Results
- Table 12.14 Therapy Profile: LTX-315 (Lytix Biopharma)
- Table 12.15 LTX-315: Clinical Trial Information
- Table 12.16 LTX-315: Clinical Trial Endpoints
- Table 12.17 LTX-315: Clinical Trial Results
- Table 13.1 Bellicum Pharmaceuticals: Key Switch Technologies
- Table 13.2 Technologies For CAR-T Safety Enhancement
- Table 14.1 T-Cell Immunotherapies Market: List of Partnerships and Collaborations, since 2005
- Table 15.1 T-Cell Immunotherapies: Funding and Investments, since 2000
- Table 15.2 T-Cell Immunotherapies: Summary of Investments
- Table 16.1 CART-Cell Therapy Patent Analysis: Prominent CPC Symbols
- Table 16.2 CART-Cell Therapy Patent Analysis: Most Popular CPC Symbols
- Table 16.3 CART-Cell Therapy Patent Analysis: List of Top CPC Symbols
- Table 16.4 CART-Cell Therapy Patent Analysis: Summary of Benchmarking Analysis
- Table 16.5 CART-Cell Therapy Patent Analysis: Categorization based on Weighted Valuation Scores
- Table 16.6 TCR-based Therapy Patent Analysis: Prominent CPC Symbols
- Table 16.7 TCR-based Therapy Patent Analysis: Most Popular CPC Symbols
- Table 16.8 TCR-based Therapy Patent Analysis: List of Top CPC Symbols
- Table 16.9 TCR-based Therapy Patent Analysis: Summary of Benchmarking Analysis
- Table 16.10 TCR-based Therapy Patent Analysis: Categorization based on Weighted Valuation Scores
- Table 16.11 TIL-based Therapy Patent Analysis: Prominent CPC Symbols
- Table 16.12 TIL-based Therapy Patent Analysis: Most Popular CPC Symbols
- Table 16.13 TIL-based Therapy Patent Analysis: List of Top CPC Symbols
- Table 16.14 TIL-based Therapy Patent Analysis: Summary of Benchmarking Analysis
- Table 16.15 TIL-based Therapy Patent Analysis: Categorization based on Weighted Valuation Scores
- Table 17.1 Characteristic Properties of Treg Cells
- Table 17.2 Other T-Cell Immunotherapies: Therapy Candidate Pipeline
- Table 18.1 Assessment Strategies for Different Manufacturing Processes
- Table 18.2 Advantages and Disadvantages of Centralized and Decentralized Manufacturing Models
- Table 18.3 Cell Therapy Manufacturing: Companies with In-House Capabilities and Contract Manufacturers
- Table 19.1 Price of Marketed Gene / Cell Therapies
- Table 19.2 Price of Marketed Targeted Drugs
- Table 19.3 T-Cell Immunotherapies: Expert Opinions on Pricing
- Table 19.4 CAR-T Cell Therapies: Reimbursement Landscape
- Table 20.1 T-Cell Immunotherapies: List of Forecasted Molecules
- Table 20.2 Kymriah(R) / Tisagenlecleucel / CTL019 (Novartis): Net Present Value (USD Million)
- Table 20.3 Kymriah(R) / Tisagenlecleucel / CTL019 (Novartis): Value Creation Analysis (USD Million)
- Table 20.4 Yescarta(R) / Axiscabtagene Ciloleucel / KTE-C19 (Gilead Sciences): Net Present Value (USD Million)
- Table 20.5 Yescarta(R) / Axiscabtagene Ciloleucel / KTE-C19 (Gilead Sciences): Value Creation Analysis (USD Million)
- Table 20.6 Tecartus(TM) / Brexucabtagene Autoleucel (Gilead Sciences): Net Present Value (USD Million)
- Table 20.7 Tecartus(TM) / Brexucabtagene Autoleucel (Gilead Sciences): Value Creation Analysis (USD Million)
- Table 20.8 Abecma(R) / BB2121 / Idecabtagene Vicleucel (Bristol Myers Squibb): Net Present Value (USD Million)
- Table 20.9 Abecma(R) / BB2121 / Idecabtagene Vicleucel (Bristol Myers Squibb): Value Creation Analysis (USD Million)
- Table 20.10 Carvykti(TM) / Ciltacabtagene Autoleucel / LCAR-B38M CAR-T / JNJ-68284528 (Janssen): Net Present Value (USD Million)
- Table 20.11 Carvykti(TM) / Ciltacabtagene Autoleucel / LCAR-B38M CAR-T / JNJ-68284528 (Janssen): Value Creation Analysis (USD Million)
- Table 20.12 Breyanzi(R) / Lisocabtagene Maraleucel / JCAR017 (Bristol Myers Squibb): Net Present Value (USD Million)
- Table 20.13 Breyanzi(R) / Lisocabtagene Maraleucel / JCAR017 (Bristol Myers Squibb): Value Creation Analysis (USD Million)
- Table 20.14 Carteyva(R) / Relmacabtagene Autoleucel / JWCAR029 (JW Therapeutics): Net Present Value (USD Million)
- Table 20.15 Carteyva(R) / Relmacabtagene Autoleucel / JWCAR029 (JW Therapeutics): Value Creation Analysis (USD Million)
- Table 20.16 BCMA CAR-T Cells (Shanghai Unicar-Therapy Bio-medicine Technology): Net Present Value (USD Million)
- Table 20.17 BCMA CAR-T Cells (Shanghai Unicar-Therapy Bio-medicine Technology): Value Creation Analysis (USD Million)
- Table 20.20 CD19 CAR-T (Wuhan Si'an Medical Technology): Net Present Value (USD Million)
- Table 20.21 CD19 CAR-T (Wuhan Si'an Medical Technology): Value Creation Analysis (USD Million)
- Table 20.22 Descartes-11 (Cartesian Therapeutics): Net Present Value (USD Million)
- Table 20.23 Descartes-11 (Cartesian Therapeutics): Value Creation Analysis (USD Million)
- Table 20.24 Descartes-08 (Cartesian Therapeutics): Net Present Value (USD Million)
- Table 20.25 Descartes-08 (Cartesian Therapeutics): Value Creation Analysis (USD Million)
- Table 20.26 Zamtocabtagene Autoleucel / MB-CART2019.1 (Miltenyi Biomedicine): Net Present Value (USD Million)
- Table 20.27 Zamtocabtagene Autoleucel / MB-CART2019.1 (Miltenyi Biomedicine): Value Creation Analysis (USD Million)
- Table 20.28 CNCT19 / HY001 (Juventas Cell Therapy): Net Present Value (USD Million)
- Table 20.29 CNCT19 / HY001 (Juventas Cell Therapy): Value Creation Analysis (USD Million)
- Table 20.30 CD30.CAR-T / TT11 (Tessa Therapeutics): Net Present Value (USD Million)
- Table 20.31 CD30.CAR-T / TT11 (Tessa Therapeutics): Value Creation Analysis (USD Million)
- Table 20.32 TAK-007 (Takeda): Net Present Value (USD Million)
- Table 20.33 TAK-007 (Takeda): Value Creation Analysis (USD Million)
- Table 20.34 AUTO1 (Autolus): Net Present Value (USD Million)
- Table 20.35 AUTO1 (Autolus): Value Creation Analysis (USD Million)
- Table 20.36 AUTO3 (Autolus): Net Present Value (USD Million)
- Table 20.37 AUTO3 (Autolus): Value Creation Analysis (USD Million)
- Table 20.38 CD19-CAR-T (Bioray Laboratories): Net Present Value (USD Million)
- Table 20.39 CD19-CAR-T (Bioray Laboratories): Value Creation Analysis (USD Million)
- Table 20.40 Humanized CD19-CAR-T (Shanghai Unicar-Therapy Bio-medicine Technology): Net Present Value (USD Million)
- Table 20.41 Humanized CD19-CAR-T (Shanghai Unicar-Therapy Bio-medicine Technology): Value Creation Analysis (USD Million)
- Table 20.42 Humanized CD19-CAR-T (IM19 CAR-T (Beijing Immunochina Medical Science & Technology): Net Present Value (USD Million)
- Table 20.43 Humanized CD19-CAR-T (IM19 CAR-T (Beijing Immunochina Medical Science & Technology): Value Creation Analysis (USD Million)
- Table 20.44 CCT301 CAR-T (Shanghai PerHum Therapeutics): Net Present Value (USD Million)
- Table 20.45 CCT301 CAR-T (Shanghai PerHum Therapeutics): Value Creation Analysis (USD Million)
- Table 20.46 BinD19 (Shenzhen BinDeBio): Net Present Value (USD Million)
- Table 20.47 BinD19 (Shenzhen BinDeBio): Value Creation Analysis (USD Million)
- Table 20.48 CARCIK-CD19 (CoImmune): Net Present Value (USD Million)
- Table 20.49 CARCIK-CD19 (CoImmune): Value Creation Analysis (USD Million)
- Table 20.50 PBCAR269A (Precision BioSciences / Servier): Net Present Value (USD Million)
- Table 20.51 PBCAR269A (Precision BioSciences / Servier): Value Creation Analysis (USD Million)
- Table 20.52 CD123 CAR-T cells (Chongqing Precision Biotechnology): Net Present Value (USD Million)
- Table 20.53 CD123 CAR-T cells (Chongqing Precision Biotechnology): Value Creation Analysis (USD Million)
- Table 20.54 BCMA CAR-T (Chongqing Precision Biotechnology): Net Present Value (USD Million)
- Table 20.55 BCMA CAR-T (Chongqing Precision Biotechnology): Value Creation Analysis (USD Million)
- Table 20.56 CD19/CD22-CAR-T (Shanghai Unicar-Therapy Bio-medicine Technology): Net Present Value (USD Million)
- Table 20.57 CD19/CD22-CAR-T (Shanghai Unicar-Therapy Bio-medicine Technology): Value Creation Analysis (USD Million)
- Table 20.58 GC012F / Dual CAR-BCMA-19 (Gracell Biotechnology): Net Present Value (USD Million)
- Table 20.59 GC012F / Dual CAR-BCMA-19 (Gracell Biotechnology): Value Creation Analysis (USD Million)
- Table 20.60 iC9-CAR19 T cells (Bellicum Pharmaceuticals): Net Present Value (USD Million)
- Table 20.61 iC9-CAR19 T cells (Bellicum Pharmaceuticals): Value Creation Analysis (USD Million)
- Table 20.62 ALLO-501A / ALLO-501 (Allogene Therapeutics): Net Present Value (USD Million)
- Table 20.63 ALLO-501A / ALLO-501 (Allogene Therapeutics): Value Creation Analysis (USD Million)
- Table 20.64 CD19/CD20-CAR-T (Yake Biotechnology): Net Present Value (USD Million)
- Table 20.65 CD19/CD20-CAR-T (Yake Biotechnology): Value Creation Analysis (USD Million)
- Table 20.66 CD7 CAR-T (PersonGen BioTherapeutics): Net Present Value (USD Million)
- Table 20.67 CD7 CAR-T (PersonGen BioTherapeutics): Value Creation Analysis (USD Million)
- Table 20.68 Anti-FLT3 CAR-T / TAA05 (PersonGen BioTherapeutics): Net Present Value (USD Million)
- Table 20.69 Anti-FLT3 CAR-T / TAA05 (PersonGen BioTherapeutics): Value Creation Analysis (USD Million)
- Table 20.70 CT053 (CARsgen Therapeutics): Net Present Value (USD Million)
- Table 20.71 CT053 (CARsgen Therapeutics): Value Creation Analysis (USD Million)
- Table 20.72 Anti-ALPP CAR-T Cells (TCRCure Biopharma): Net Present Value (USD Million)
- Table 20.73 Anti-ALPP CAR-T Cells (TCRCure Biopharma): Value Creation Analysis (USD Million)
- Table 20.74 BCMA targeted prime CAR-T cells (Chongqing Precision Biotechnology): Net Present Value (USD Million)
- Table 20.75 BCMA targeted prime CAR-T cells (Chongqing Precision Biotechnology): Value Creation Analysis (USD Million)
- Table 20.76 ALLO-605 (Allogene Therapeutics): Net Present Value (USD Million)
- Table 20.77 ALLO-605 (Allogene Therapeutics): Value Creation Analysis (USD Million)
- Table 20.78 WU CART 007 (Wugen): Net Present Value (USD Million)
- Table 20.79 WU CART 007 (Wugen): Value Creation Analysis (USD Million)
- Table 20.80 CT103A (Nanjing IASO Biotherapeutics): Net Present Value (USD Million)
- Table 20.81 CT103A (Nanjing IASO Biotherapeutics): Value Creation Analysis (USD Million)
- Table 20.82 Kimmtrak (IMCgp100 / Tebentafusp) (Immunocore): Net Present Value (USD Million)
- Table 20.83 Kimmtrak (IMCgp100 / Tebentafusp) (Immunocore): Value Creation Analysis (USD Million)
- Table 20.84 GSK3377794 (GlaxoSmithKline): Net Present Value (USD Million)
- Table 20.85 GSK3377794 (GlaxoSmithKline): Value Creation Analysis (USD Million)
- Table 20.86 YT-E001 (China Immunotech): Net Present Value (USD Million)
- Table 20.87 YT-E001 (China Immunotech): Value Creation Analysis (USD Million)
- Table 20.88 ADP-A2M4 / Afamitresgene Autoleucel / Afami-cel (Adaptimmune Therapeutics): Net Present Value (USD Million)
- Table 20.89 ADP-A2M4 / Afamitresgene Autoleucel / Afami-cel (Adaptimmune Therapeutics): Value Creation Analysis (USD Million)
- Table 20.90 EBV-specific TCR-T cell with anti-PD1 auto-secreted element (TCRCure Biopharma): Net Present Value (USD Million)
- Table 20.91 EBV-specific TCR-T cell with anti-PD1 auto-secreted element (TCRCure Biopharma): Value Creation Analysis (USD Million)
- Table 20.92 NTLA-5001 (Intellia Therapeutics): Net Present Value (USD Million)
- Table 20.93 NTLA-5001 (Intellia Therapeutics): Value Creation Analysis (USD Million)
- Table 20.94 TBI-1301 (Takara Bio): Net Present Value (USD Million)
- Table 20.95 TBI-1301 (Takara Bio): Value Creation Analysis (USD Million)
- Table 20.96 LMBP2-specific TCR-T (Xinqiao Hospital of Chongqing / TCR CURE Biopharma Technology): Net Present Value (USD Million)
- Table 20.97 LMBP2-specific TCR-T (Xinqiao Hospital of Chongqing / TCR CURE Biopharma Technology): Value Creation Analysis (USD Million)
- Table 20.98 FH-MCVA2TCR (TCRCure Biopharma): Net Present Value (USD Million)
- Table 20.99 FH-MCVA2TCR (TCRCure Biopharma): Value Creation Analysis (USD Million)
- Table 20.100 Lifileucel / LN-144 (Iovance Biotherapeutics): Net Present Value (USD Million)
- Table 20.101 Lifileucel / LN-144 (Iovance Biotherapeutics): Value Creation Analysis (USD Million)
- Table 20.102 LN-145 (Iovance Biotherapeutics): Net Present Value (USD Million)
- Table 20.103 LN-145 (Iovance Biotherapeutics): Value Creation Analysis (USD Million)
- Table 20.104 LTX-315 and TILs (Lytix Biopharma): Net Present Value (USD Million)
- Table 20.105 LTX-315 and TILs (Lytix Biopharma): Value Creation Analysis (USD Million)
- Table 20.106 TILs (Prometheus Laboratories): Net Present Value (USD Million)
- Table 20.107 TILs (Prometheus Laboratories): Value Creation Analysis (USD Million)
- Table 20.108 Donor Lymphocyte Infusion (Incyte): Net Present Value (USD Million)
- Table 20.109 Donor Lymphocyte Infusion (Incyte): Value Creation Analysis (USD Million)
- Table 20.110 ITIL-168 (Instil Bio): Net Present Value (USD Million)
- Table 20.111 ITIL-168 (Instil Bio): Value Creation Analysis (USD Million)
- Table 20.112 IOV-2001 (Iovance Biotherapeutics): Net Present Value (USD Million)
- Table 20.113 IOV-2001 (Iovance Biotherapeutics): Value Creation Analysis (USD Million)
- Table 20.114 TILs (CAR-T (Shanghai) Cell Biotechnology): Net Present Value (USD Million)
- Table 20.115 TILs (CAR-T (Shanghai) Cell Biotechnology): Value Creation Analysis (USD Million)
- Table 20.116 TILs (Bristol-Myers Squibb): Net Present Value (USD Million)
- Table 20.117 TILs (Bristol-Myers Squibb): Value Creation Analysis (USD Million)
- Table 21.1 Promotional / Marketing Strategy: Patient Support Services and Informative Downloads
- Table 21.2 Kymriah(R): Drug Overview
- Table 21.3 Yescarta(R): Drug Overview
- Table 21.4 Tecartus(TM): Drug Overview
- Table 21.5 Breyanzi(R): Drug Overview
- Table 21.6 Abecma(R): Drug Overview
- Table 21.7 Carvykti(TM): Drug Overview
- Table 21.8 Kimmtrak(R): Drug Overview
- Table 22.1 Leading T-Cell Immunotherapy Developers
- Table 22.2 Adaptimmune Therapeutics: Company Profile
- Table 22.3 Alaunos Therapeutics: Company Profile
- Table 22.4 Autolus: Company Profile
- Table 22.5 bluebird bio: Company Profile
- Table 22.6 Bristol Myers Squibb: Company Profile
- Table 22.7 CARsgen Therapeutics: Company Profile
- Table 22.8 Cellectis: Company Profile
- Table 22.9 Cellular Biomedicine Group: Company Profile
- Table 22.10 Gilead Sciences: Company Profile
- Table 22.11 GlaxoSmith Kline: Company Profile
- Table 22.12 Immatics: Company Profile
- Table 22.13 Immunocore: Company Profile
- Table 22.14 Innovative Cellular Therapeutics: Company Profile
- Table 22.15 Iovance Biotherapeutics: Company Profile
- Table 22.16 Kuur Therapeutics: Company Profile
- Table 22.17 Lion TCR: Company Profile
- Table 22.18 Noile-Immune Biotech: Company Profile
- Table 22.19 Novartis: Company Profile
- Table 22.20 Shanghai Genechem: Company Profile
- Table 22.21 Sinobioway Cell Therapy: Company Profile
- Table 22.22 Takara Bio: Company Profile
- Table 22.23 Wellington Zhaotai Therapies: Company Profile
- Table 22.24 Zelluna Immunotherapy: Company Profile
- Table 25.1 CAR-T Cell Therapies: Distribution by Type of Developer
- Table 25.2 CAR-T Cell Therapies: Distribution by Phase of Development
- Table 25.3 CAR-T Cell Therapies: Distribution by Therapeutic Area
- Table 25.4 CAR-T Cell Therapies: Distribution by Phase of Development and Therapeutic Area
- Table 25.5 CAR-T Cell Therapies: Distribution by Key Target Indication
- Table 25.6 CAR-T Cell Therapies: Distribution by Key Target Antigen
- Table 25.7 CAR-T Cell Therapies: Distribution by Source of T-Cells
- Table 25.8 CAR-T Cell Therapies: Distribution by Phase of Development and Source of T-Cells
- Table 25.9 CAR-T Cell Therapies: Distribution by Route of Administration
- Table 25.10 CAR-T Cell Therapies: Distribution by Dosing Frequency
- Table 25.11 CAR-T Cell Therapies: Distribution by Target Patient Segment
- Table 25.12 CAR-T Cell Therapies: Distribution by Type of Therapy
- Table 25.13 Most Active Industry Players: Distribution by Number of CAR-T Cell Therapies
- Table 25.14 Most Active Non-Industry Players: Distribution by Number of CAR-T Cell Therapies
- Table 25.15 CAR-T Cell Therapy Developers: Distribution by Year of Establishment
- Table 25.16 CAR-T Cell Therapy Developers: Distribution by Company Size
- Table 25.17 CAR-T Cell Therapy Developers: Distribution by Location of Headquarters (Region-wise)
- Table 25.18 CAR-T Cell Therapies: Distribution by Location of Headquarters (Country-wise)
- Table 25.19 TCR-based Therapies: Distribution by Type of Developer
- Table 25.20 TCR-based Therapies: Distribution by Phase of Development
- Table 25.21 TCR-based Therapies: Distribution by Therapeutic Area
- Table 25.22 TCR-based Therapies: Distribution by Phase of Development and Therapeutic Area
- Table 25.23 TCR-based Therapies: Distribution by Key Target Indication
- Table 25.24 TCR-based Therapies: Distribution by Key Target Antigen
- Table 25.25 TCR-based Therapies: Distribution by Source of T-Cells
- Table 25.26 TCR-based Therapies: Distribution by Route of Administration
- Table 25.27 TCR-based Therapies: Distribution by Phase of Development and Route of Administration
- Table 25.28 TCR-based Therapies: Distribution by Dosing Frequency
- Table 25.29 TCR-based Therapies: Distribution by Target Patient Segment
- Table 25.30 TCR-based Therapies: Distribution by Type of Therapy
- Table 25.31 TCR-based Therapies: Distribution by Phase of Development and Type of Therapy
- Table 25.32 Most Active Industry Players: Distribution by Number of TCR-based Therapies
- Table 25.33 Most Active Non-Industry Players: Distribution by Number of TCR-based Therapies
- Table 25.34 TCR-based Therapy Developers: Distribution by Year of Establishment
- Table 25.35 TCR-based Therapy Developers: Distribution by Company Size
- Table 25.36 TCR-based Therapy Developers: Distribution by Location of Headquarters (Region-wise)
- Table 25.37 TCR-based Therapy Developers: Distribution by Location of Headquarters (Country-wise)
- Table 25.38 TIL-based Therapies: Distribution by Type of Developer
- Table 25.39 TIL-based Therapies: Distribution by Phase of Development
- Table 25.40 TIL-based Therapies: Distribution by Therapeutic Area
- Table 25.41 TIL-based Therapies: Distribution by Key Target Indications
- Table 25.42 TIL-based Therapies: Distribution by Source of T-Cells
- Table 25.43 TIL-based Therapies: Distribution by Route of Administration
- Table 25.44 TIL-based Therapies: Distribution by Dosing Frequency
- Table 25.45 TIL-based Therapies: Distribution by Target Patient Segment
- Table 25.46 TIL-based Therapies: Distribution by Type of Therapy
- Table 25.47 Most Active Industry Players: Distribution by Number of TIL-based Therapies
- Table 25.48 Most Active Non-Industry Players: Distribution by Number of TIL-based Therapies
- Table 25.49 TIL-based Therapy Developers: Distribution by Year of Establishment
- Table 25.50 TIL-based Therapy Developers: Distribution by Company Size
- Table 25.51 TIL-based Therapy Developers: Distribution by Location of Headquarters (Region-wise)
- Table 25.52 TIL-based Therapy Developers: Distribution by Location of Headquarters (Country-wise)
- Table 25.53 CAR-T Cell Therapies Clinical Trial Analysis: Cumulative Distribution by Trial Registration Year
- Table 25.54 CAR-T Cell Therapies Clinical Trial Analysis: Distribution by Trial Registration Year and Enrolled Patient Population
- Table 25.55 CAR-T Cell Therapies Clinical Trial Analysis: Distribution by Trial Status
- Table 25.56 CAR-T Cell Therapies Clinical Trial Analysis: Distribution by Trial Registration Year and Trial Status
- Table 25.57 CAR-T Cell Therapies Clinical Trial Analysis: Distribution by Trial Phase
- Table 25.58 CAR-T Cell Therapies Clinical Trial Analysis: Distribution of Enrolled Patient Population by Trial Phase
- Table 25.59 CAR-T Cell Therapies Clinical Trial Analysis: Distribution by Target Patient Segment
- Table 25.60 CAR-T Cell Therapies Clinical Trial Analysis: Distribution by Type of Sponsor / Collaborator
- Table 25.61 CAR-T Cell Therapies Clinical Trial Analysis: Distribution by Study Design
- Table 25.62 Most Active Industry Players: Distribution by Number of Registered Trials
- Table 25.63 Most Active Non-Industry Players: Distribution by Number of Registered Trials
- Table 25.64 CAR-T Cell Therapies Clinical Trial Analysis: Distribution of Clinical Trials by Geography
- Table 25.65 CAR-T Cell Therapies Clinical Trial Analysis: Distribution of Completed Clinical Trials by Geography
- Table 25.66 CAR-T Cell Therapies Clinical Trial Analysis: Distribution of Active Clinical Trials by Geography
- Table 25.67 CAR-T Cell Therapy Clinical Trial Analysis: Distribution of Patients Enrolled by Geography
- Table 25.68 TCR-based Therapies Clinical Trial Analysis: Cumulative Distribution by Trial Registration Year
- Table 25.69 TCR-based Therapies Clinical Trial Analysis: Distribution by Trial Registration Year and Enrolled Patient Population
- Table 25.70 TCR-based Therapies Clinical Trial Analysis: Distribution by Trial Status
- Table 25.71 TCR-based Therapies Clinical Trial Analysis: Distribution by Trial Registration Year and Trial Status
- Table 25.72 TCR-based Therapies Clinical Trial Analysis: Distribution by Trial Phase
- Table 25.73 TCR-based Therapies Clinical Trial Analysis: Distribution of Enrolled Patient Population by Trial Phase
- Table 25.74 TCR-based Therapies Clinical Trial Analysis: Distribution by Target Patient Segment
- Table 25.75 TCR-based Therapies Clinical Trial Analysis: Distribution by Type of Sponsor / Collaborator
- Table 25.76 TCR-based Therapies Clinical Trial Analysis: Distribution by Study Design
- Table 25.77 Most Active Industry Players: Distribution by Number of Registered Trials
- Table 25.78 Most Active Non-Industry Players: Distribution by Number of Registered Trials
- Table 25.79 TCR-based Therapies Clinical Trial Analysis: Distribution of Clinical Trials by Geography
- Table 25.80 TCR-based Therapies Clinical Trial Analysis: Distribution of Completed Clinical Trials by Geography
- Table 25.81 TCR-based Therapies Clinical Trial Analysis: Distribution of Active Clinical Trials by Geography
- Table 25.82 TCR-based Therapies Clinical Trial Analysis: Distribution of Patients Enrolled by Geography
- Table 25.83 TIL-based Therapies Clinical Trial Analysis: Cumulative Distribution by Trial Registration Year
- Table 25.84 TIL-based Therapies Clinical Trial Analysis: Distribution by Trial Registration Year and Enrolled Patient Population
- Table 25.85 TIL-based Therapies Clinical Trial Analysis: Distribution by Trial Status
- Table 25.86 TIL-based Therapies Clinical Trial Analysis: Distribution by Trial Registration Year and Trial Status
- Table 25.87 TIL-based Therapies Clinical Trial Analysis: Distribution by Trial Phase
- Table 25.88 TIL-based Therapies Clinical Trial Analysis: Distribution of Enrolled Patient Population by Trial Phase
- Table 25.89 TIL-based Therapies Clinical Trial Analysis: Distribution by Target Patient Segment
- Table 25.90 TIL-based Therapies Clinical Trial Analysis: Distribution by Type of Sponsor / Collaborator
- Table 25.91 TIL-based Therapies Clinical Trial Analysis: Distribution by Study Design
- Table 25.92 Most Active Industry Players: Distribution by Number of Registered Trials
- Table 25.93 Most Active Non-Industry Players: Distribution by Number of Registered Trials
- Table 25.94 TIL-based Therapies Clinical Trial Analysis: Distribution of Clinical Trials by Geography
- Table 25.95 TIL-based Therapies Clinical Trial Analysis: Distribution of Completed Clinical Trials by Geography
- Table 25.96 TIL-based Therapies Clinical Trial Analysis: Distribution of Active Clinical Trials by Geography
- Table 25.97 TIL-based Therapies Clinical Trial Analysis: Distribution of Patients Enrolled by Geography
- Table 25.98 CAR-T Cell Therapies KOL Analysis: Distribution by Type of Organization
- Table 25.99 CAR-T Cell Therapies KOL Analysis: Distribution by Affiliated Organization
- Table 25.100 CAR-T Cell Therapies KOL Analysis: Distribution by Qualification
- Table 25.101 CAR-T Cell Therapies Scatter Plot: KOL Activeness versus KOL Strength
- Table 25.102 CAR-T Cell Therapies Most Prominent KOLs: KOL Activeness versus KOL Strength
- Table 25.103 CAR-T Cell Therapies Most Prominent KOLs: Distribution by RA Score
- Table 25.104 CAR-T Cell Therapies Most Prominent KOLs: Comparison of RA Score with Third-Party Score
- Table 25.105 CAR-T based Therapies Most Prominent KOLs: Comparison of RA Score with Third-Party Score (Scatter Plot)
- Table 25.106 TCR-based Therapies KOL Analysis: Distribution by Type of Organization
- Table 25.107 TCR-based Therapies KOL Analysis: Distribution by Affiliated Organization
- Table 25.108 TCR-based Therapies KOL Analysis: Distribution by Qualification
- Table 25.109 TCR-based Therapies Scatter Plot: KOL Activeness versus KOL Strength
- Table 25.110 TCR-based Therapies Most Prominent KOLs: KOL Activeness versus KOL Strength
- Table 25.111 TCR-based Therapies Most Prominent KOLs: Distribution by RA Score
- Table 25.112 TCR-based Therapies Most Prominent KOLs: Comparison of RA Score with Third-Party Score
- Table 25.113 TCR-based Therapies Most Prominent KOLs: Comparison of RA Score with Third-Party Score (Scatter Plot)
- Table 25.114 TIL-based Therapies KOL Analysis: Distribution by Type of Organization
- Table 25.115 TIL-based Therapies KOL Analysis: Distribution by Affiliated Organization
- Table 25.116 TIL-based Therapies KOL Analysis: Distribution by Qualification
- Table 25.117 TIL-based Therapies: Geographical Distribution of KOLs
- Table 25.118 TIL-based Therapies Scatter Plot: KOL Activeness versus KOL Strength
- Table 25.119 TIL-based Therapies Most Prominent KOLs: KOL Activeness versus KOL Strength
- Table 25.120 TIL-based Therapies Most Prominent KOLs: Distribution by RA Score
- Table 25.121 TIL-based Therapies Most Prominent KOLs: Comparison of RA Score with Third-Party Score
- Table 25.122 TIL-based Therapies Most Prominent KOLs: Comparison of RA Score with Third-Party Score (Scatter Plot)
- Table 25.123 Kymriah(R): Estimated Sales Revenues
- Table 25.124 Yescarta(R): Estimated Sales Revenues
- Table 25.125 Tecartus(TM): Estimated Sales Revenues
- Table 25.126 Breyanzi(R): Estimated Sales Revenues
- Table 25.127 Abecma(R): Estimated Sales Revenues
- Table 25.128 Carvykti(R): Estimated Sales Revenues
- Table 25.129 Carteyva: Estimated Sales Revenues
- Table 25.130 TBI-1501: Estimated Sales Revenues
- Table 25.131 AUTO1: Estimated Sales Revenues
- Table 25.132 AUTO3: Estimated Sales Revenues
- Table 25.133 Kimmtrak(R): Estimated Sales Revenues
- Table 25.134 GSK3377794: Estimated Sales Revenues
- Table 25.135 ADP-A2M4: Estimated Sales Revenues
- Table 25.136 JTCR016: Estimated Sales Revenues
- Table 25.137 TBI-1301: Estimated Sales Revenues
- Table 25.138 MDG1011: Estimated Sales Revenues
- Table 25.139 LN-144: Estimated Sales Revenues
- Table 25.140 LN-145: Estimated Sales Revenues
- Table 25.141 ITIL-168: Estimated Sales Revenues
- Table 25.142 LTX-315: Estimated Sales Revenues
- Table 25.143 Partnerships and Collaborations: Cumulative Year-Wise Trend
- Table 25.144 Partnerships and Collaborations: Distribution by Type of Partnership
- Table 25.145 Partnerships and Collaborations: Distribution by Type of Partnership
- Table 25.146 Partnerships and Collaborations: Distribution by Type of Product
- Table 25.147 Partnerships and Collaborations: Distribution by Year of Partnership and Type of Therapy
- Table 25.148 Partnerships and Collaborations: Distribution by Type of Partnership and Type of Product
- Table 25.149 Partnerships and Collaborations: Distribution by Type of Partner
- Table 25.150 Partnerships and Collaborations: Year-Wise Distribution by Type of Partner
- Table 25.151 Partnerships and Collaborations: Distribution by Type of Product and Type of Partner
- Table 25.152 Most Popular Products: Distribution by Number of Partnerships
- Table 25.153 Most Active Industry Players: Distribution by Number of Partnerships
- Table 25.154 Most Active Non-Industry Players: Distribution by Number of Partnerships
- Table 25.155 Partnerships and Collaborations: Distribution of Intercontinental and Intracontinental Deals
- Table 25.156 Partnerships and Collaborations: Distribution of International and Local Deals
- Table 25.157 Funding and Investment Analysis: Cumulative Distribution of Instances by Year
- Table 25.158 Funding and Investment Analysis: Cumulative Distribution of Amount Invested by Year (USD Million)
- Table 25.159 Funding and Investment Analysis: Distribution of Instances by Type of Funding
- Table 25.160 Funding and Investment Analysis: Distribution of Total Amount Invested by Type of Funding (USD Million)
- Table 25.161 Funding and Investments: Distribution of Amount Invested by Type of Therapy (USD Million)
- Table 25.162 Funding and Investments: Distribution by Types of Investors
- Table 25.163 Funding and Investments: Distribution of Amount Invested by Type of Investor (USD Million)
- Table 25.164 Most Active Players: Distribution by Number of Instances
- Table 25.165 Most Active Players: Distribution by Amount Invested
- Table 25.166 Funding and Investment Analysis: Distribution of Amount Invested by Geography
- Table 25.167 Most Active Investors: Distribution by Number of Funding Instances
- Table 25.168 Patent Analysis: Distribution by Type of Patent
- Table 25.169 CAR-T Cell Therapies Patent Analysis: Cumulative Distribution by Patent Publication Year
- Table 25.170 CAR-T Cell Therapies Patent Analysis: Cumulative Distribution by Patent Application Year
- Table 25.171 CAR-T Cell Therapies Patent Analysis: Cumulative Distribution by Annual Granted Patents
- Table 25.172 CAR-T Cell Therapies Patent Analysis: Cumulative Distribution of Year-wise Filed Patent Applications
- Table 25.173 CAR-T Cell Therapies Patent Analysis: Distribution of Year-wise Granted Patents and Patent Applications
- Table 25.174 CAR-T Cell Therapies Patent Analysis: Distribution by Geography
- Table 25.175 CAR-T Cell Therapies Patent Analysis: Distribution by Type of Player
- Table 25.176 CAR-T Cell Therapies Patent Analysis: Distribution by CPC Symbols
- Table 25.177 Leading Industry Players: Distribution by Number of Patents
- Table 25.178 Leading Non-Industry Players: Distribution by Number of Patents
- Table 25.179 Leading Patent Assignees: Distribution by Number of Patents
- Table 25.180 Patent Analysis: Distribution by Patent Age
- Table 25.181 CAR-T Therapies: Patent Valuation Analysis
- Table 25.182 TCR-based Therapies Patent Analysis: Cumulative Distribution by Patent Publication Year
- Table 25.183 TCR-based Therapies Patent Analysis: Cumulative Distribution by Patent Application Year
- Table 25.184 TCR-based Therapies Patent Analysis: Cumulative Distribution by Annual Granted Patents
- Table 25.185 TCR-based Therapies Patent Analysis: Cumulative Distribution of Year-wise Filed Patent Applications
- Table 25.186 TCR-based Therapies Patent Analysis: Distribution by Year-wise filed Patents Application and Granted Patents
- Table 25.187 TCR-based Therapies Patent Analysis: Distribution by Geography
- Table 25.188 TCR-based Therapies Patent Analysis: Distribution by Type of Player
- Table 25.189 TCR-based Therapies Patent Analysis: Distribution by CPC Symbols
- Table 25.190 Leading Industry Players: Distribution by Number of Patents
- Table 25.191 Leading Non-Industry Players: Distribution by Number of Patents
- Table 25.192 Leading Patent Assignees: Distribution by Number of Patents
- Table 25.193 Patent Analysis: Distribution by Patent Age
- Table 25.194 TCR-based Therapies: Patent Valuation Analysis
- Table 25.195 TIL-based Therapies Patent Analysis: Cumulative Distribution by Patent Publication Year
- Table 25.196 TIL-based Therapies Patent Analysis: Cumulative Distribution by Patent Application Year
- Table 25.197 TIL-based Therapies Patent Analysis: Cumulative Distribution by Annual Granted Patents
- Table 25.198 TIL-based Therapies Patent Analysis: Cumulative Distribution of Year-wise Filed Patent Applications
- Table 25.199 TIL-based Therapies Patent Analysis: Distribution by Year-wise filed Patents Application and Granted patents
- Table 25.200 TIL-based Therapies Patent Analysis: Distribution by Geography
- Table 25.201 TIL-based Therapies Patent Analysis: Distribution by Type of Player
- Table 25.202 TIL-based Therapies Patent Analysis: Distribution by CPC Symbols
- Table 25.203 Leading Industry Players: Distribution by Number of Patents
- Table 25.204 Leading Non-Industry Players: Distribution by Number of Patents
- Table 25.205 Leading Patent Assignees: Distribution by Number of Patents
- Table 25.206 Patent Analysis: Distribution by Patent Age
- Table 25.207 TIL-based Therapies: Patent Valuation Analysis
- Table 25.208 Other T-Cell Immunotherapies: Distribution by Type of T-Cell
- Table 25.209 Other T-Cell Immunotherapies: Distribution by Source of T-Cells
- Table 25.210 Other T-Cell Immunotherapies: Distribution by Phase of Development
- Table 25.211 Other T-Cell Immunotherapies: Distribution by Therapeutic Area
- Table 25.212 Global T-Cell Immunotherapy Market, 2022-2035 (USD Billion)
- Table 25.213 T-Cell Immunotherapy Market: Distribution by Type of Therapy, 2025 and 2035 (USD Billion)
- Table 25.214 T-Cell Immunotherapy Market: Distribution by Target Indication(s), 2025 and 2035 (USD Billion)
- Table 25.215 T-Cell Immunotherapy Market: Distribution by Target Antigen, 2025 and 2035
- Table 25.216 T-Cell Immunotherapy Market: Distribution by Key Players, 2025 and 2035 (USD Billion)
- Table 25.217 T-Cell Immunotherapy Market: Distribution by Geography, 2025 and 2035 (USD Billion)
- Table 25.218 Global CAR-T Cell Therapies Market, 2022-2035 (USD Billion)
- Table 25.219 CAR-T Cell Therapies Market: Distribution by Target Indication, 2025 and 2035 (USD Billion)
- Table 25.220 CAR-T Cell Therapies Market: Distribution by Target Antigen, 2025 and 2035 (USD Billion)
- Table 25.221 CAR-T Cell Therapies Market: Distribution by Key Players, 2025 and 2035 (USD Billion)
- Table 25.222 CAR-T Cell Therapies Market: Distribution by Target Geography, 2025 and 2035 (USD Billion)
- Table 25.223 Kymriah(R) / Tisagenlecleucel / CTL019 (Novartis) Sales Forecast, till 2035 (USD Million)
- Table 25.224 Yescarta(R) / Axiscabtagene Ciloleucel / KTE-C19 (Gilead Sciences) Sales Forecast, till 2035 (USD Million)
- Table 25.225 Tecartus(TM) / Brexucabtagene Autoleucel (Gilead Sciences) Sales Forecast, till 2035 (USD Million)
- Table 25.226 Abecma(R) / BB2121 / Idecabtagene Vicleucel (Bristol Myers Squibb) Sales Forecast, till 2035 (USD Million)
- Table 25.227 Carvykti(R) / Ciltacabtagene Autoleucel / LCAR-B38M CAR-T / JNJ-68284528 (Janssen) Sales Forecast, till 2035 (USD Million)
- Table 25.228 Breyanzi(R) / Lisocabtagene Maraleucel / JCAR017 (Bristol Myers Squibb) Sales Forecast, till 2035 (USD Million)
- Table 25.229 Carteyva(R) / Relmacabtagene Autoleucel / JWCAR029 (JW Therapeutics) Sales Forecast, till 2035 (USD Million)
- Table 25.230 BCMA CAR-T Cells (Shanghai Unicar-Therapy Bio-medicine Technology) Sales Forecast, till 2035 (USD Million)
- Table 25.231 CD19 CAR-T (Wuhan Si'an Medical Technology) Sales Forecast, till 2035 (USD Million)
- Table 25.232 Descartes-11 (Cartesian Therapeutics) Sales Forecast, till 2035 (USD Million)
- Table 25.233 Descartes-08 (Cartesian Therapeutics) Sales Forecast, till 2035 (USD Million)
- Table 25.234 Zamtocabtagene Autoleucel / MB-CART2019.1 (Miltenyi Biomedicine) Sales Forecast, till 2035 (USD Million)
- Table 25.235 CNCT19 / HY001 (Juventas Cell Therapy) Sales Forecast, till 2035 (USD Million)
- Table 25.236 CD30.CAR-T / TT11 (Tessa Therapeutics) Sales Forecast, till 2035 (USD Million)
- Table 25.237 TAK-007 (Takeda) Sales Forecast, till 2035 (USD Million)
- Table 25.238 AUTO1 (Autolus) Sales Forecast, till 2035 (USD Million)
- Table 25.239 AUTO3 (Autolus) Sales Forecast, till 2035 (USD Million)
- Table 25.240 CD19-CAR-T (Bioray Laboratories) Sales Forecast, till 2035 (USD Million)
- Table 25.241 Humanized CD19-CAR-T (Shanghai Unicar-Therapy Bio-medicine Technology) Sales Forecast, till 2035 (USD Million)
- Table 25.242 Humanized CD19-CAR-T (IM19 CAR-T (Beijing Immunochina Medical Science & Technology) Sales Forecast till 2035 (USD Million)
- Table 25.243 CCT301 CAR-T (Shanghai PerHum Therapeutics) Sales Forecast, till 2035 (USD Million)
- Table 25.244 BinD19 (Shenzhen BinDeBio) Sales Forecast, till 2035 (USD Million)
- Table 25.245 CARCIK-CD19 (CoImmune) Sales Forecast, till 2035 (USD Million)
- Table 25.246 PBCAR269A (Precision BioSciences / Servier) Sales Forecast, till 2035 (USD Million)
- Table 25.247 CD123 CAR-T cells (Chongqing Precision Biotechnology) Sales Forecast, till 2035 (USD Million)
- Table 25.248 BCMA CAR-T (Chongqing Precision Biotechnology) Sales Forecast, till 2035 (USD Million)
- Table 25.249 CD19/CD22-CAR-T (Shanghai Unicar-Therapy Bio-medicine Technology) Sales Forecast, till 2035 (USD Million)
- Table 25.250 GC012F / Dual CAR-BCMA-19 (Gracell Biotechnology) Sales Forecast, till 2035 (USD Million)
- Table 25.251 iC9-CAR19 T cells (Bellicum Pharmaceuticals) Sales Forecast, till 2035 (USD Million)
- Table 25.252 ALLO-501A / ALLO-501 (Allogene Therapeutics) Sales Forecast, till 2035 (USD Million)
- Table 25.253 CD19/CD20-CAR-T (Yake Biotechnology) Sales Forecast, till 2035 (USD Million)
- Table 25.254 CD7 CAR-T (PersonGen BioTherapeutics) Sales Forecast, till 2035 (USD Million)
- Table 25.255 Anti-FLT3 CAR-T / TAA05 (PersonGen BioTherapeutics) Sales Forecast, till 2035 (USD Million)
- Table 25.256 CT053 (CARsgen Therapeutics) Sales Forecast, till 2035 (USD Million)
- Table 25.257 Anti-ALPP CAR-T Cells (TCRCure Biopharma) Sales Forecast, till 2035 (USD Million)
- Table 25.258 BCMA targeted prime CAR-T cells (Chongqing Precision Biotechnology) Sales Forecast, till 2035 (USD Million)
- Table 25.259 ALLO-605 (Allogene Therapeutics) Sales Forecast, till 2035 (USD Million)
- Table 25.260 WU CART 007 (Wugen) Sales Forecast, till 2035 (USD Million)
- Table 25.261 CT103A (Nanjing IASO Biotherapeutics) Sales Forecast, till 2035 (USD Million)
- Table 25.262 Global TCR-based Therapies Market, 2022-2035 (USD Billion)
- Table 25.263 TCR-Based Therapies Market: Distribution by Target Indication, 2025 and 2035 (USD Billion)
- Table 25.264 TCR-Based Therapies Market: Distribution by Target Antigen, 2025 and 2035 (USD Billion)
- Table 25.265 TCR-Based Therapies Market: Distribution by Key Players, 2025 and 2035 (USD Billion)
- Table 25.266 TCR-Based Therapies Market: Distribution by Geography, 2025 and 2035 (USD Billion)
- Table 25.267 Kimmtrak(R) (IMCgp100 / Tebentafusp) (Immunocore) Sales
- Table 25.268 GSK3377794 (GlaxoSmithKline) Sales Forecast, till 2035 (USD Million)
- Table 25.269 YT-E001 (China Immunotech) Sales Forecast, till 2035 (USD Million)
- Table 25.270 ADP-A2M4 / Afamitresgene Autoleucel / Afami-cel (Adaptimmune Therapeutics) Sales Forecast, till 2035 (USD Million)
- Table 25.271 EBV-specific TCR-T cell with anti-PD1 auto-secreted element (TCRCure Biopharma) Sales Forecast, till 2035 (USD Million)
- Table 25.272 NTLA-5001 (Intellia Therapeutics) Sales Forecast, till 2035 (USD Million)
- Table 25.273 TBI-1301 (Takara Bio) Sales Forecast, till 2035 (USD Million)
- Table 25.274 LMBP2-specific TCR-T (Xinqiao Hospital of Chongqing / TCR CURE Biopharma Technology) Sales Forecast, 2035 (USD Million)
- Table 25.275 FH-MCVA2TCR (TCRCure Biopharma) Sales Forecast, till 2035 (USD Million)
- Table 25.276 Global TIL-based Therapies Market, 2022-2035 (USD Billion)
- Table 25.277 TIL-Based Therapies Market: Distribution by Target Indication, 2025 and 2035 (USD Billion)
- Table 25.278 TIL-Based Therapies Market: Key Players, 2025 and 2035 (USD Billion)
- Table 25.279 TIL-Based Therapies Market: Distribution by Geography, 2025 and 2035 (USD Billion)
- Table 25.280 Lifileucel / LN-144 (Iovance Biotherapeutics) Sales Forecast, till 2035 (USD Million)
- Table 25.281 LN-145 (Iovance Biotherapeutics) Sales Forecast, till 2035 (USD Million)
- Table 25.282 LTX-315 and TILs (Lytix Biopharma) Sales Forecast, till 2035 (USD Million)
- Table 25.283 TILs (Prometheus Laboratories) Sales Forecast, till 2035 (USD Million)
- Table 25.284 Donor Lymphocyte Infusion (Incyte) Sales Forecast, till 2035 (USD Million)
- Table 25.285 ITIL-168 (Instil Bio) Sales Forecast, till 2035 (USD Million)
- Table 25.286 IOV-2001 (Iovance Biotherapeutics) Sales Forecast, till 2035 (USD Million)
- Table 25.287 TILs (CAR-T (Shanghai) Cell Biotechnology) Sales Forecast, till 2035 (USD Million)
- Table 25.288 TILs (Bristol-Myers Squibb) Sales Forecast, till 2035 (USD Million)
List of Figures
- Figure 2.1 Executive Summary (CAR-T Cell Therapies): Overall Market Landscape
- Figure 2.2 Executive Summary (CAR-T Cell Therapies): Clinical Trial Analysis
- Figure 2.3 Executive Summary (CAR-T Cell Therapies): Key Opinion Leaders
- Figure 2.4 Executive Summary (CAR-T Cell Therapies): Partnerships and Collaborations
- Figure 2.5 Executive Summary (CAR-T Cell Therapies): Funding and Investments
- Figure 2.6 Executive Summary (CAR-T Cell Therapies): Patent Analysis
- Figure 2.7 Executive Summary (CAR-T Cell Therapies): Market Forecast and Opportunity Analysis
- Figure 2.8 Executive Summary (TCR-based Therapies): Overall Market Landscape
- Figure 2.9 Executive Summary (TCR-based Therapies): Clinical Trial Analysis
- Figure 2.10 Executive Summary (TCR-based Therapies): Key Opinion Leaders
- Figure 2.11 Executive Summary (TCR-based Therapies): Partnerships and Collaborations
- Figure 2.12 Executive Summary (TCR-based Therapies): Funding and Investments
- Figure 2.13 Executive Summary (TCR-based Therapies): Patent Analysis
- Figure 2.14 Executive Summary (TCR-based Therapies): Market Forecast and Opportunity Analysis
- Figure 2.15 Executive Summary (TIL-based Therapies): Overall Market Landscape
- Figure 2.16 Executive Summary (TIL-based Therapies): Clinical Trial Analysis
- Figure 2.17 Executive Summary (TIL-based Therapies): Key Opinion Leaders
- Figure 2.18 Executive Summary (TIL-based Therapies): Partnerships and Collaborations
- Figure 2.19 Executive Summary (TIL-based Therapies): Funding and Investments
- Figure 2.20 Executive Summary (TIL-based Therapies): Patent Analysis
- Figure 2.21 Executive Summary (TIL-based Therapies): Market Forecast and Opportunity Analysis
- Figure 3.1 Pillars of Cancer Therapy
- Figure 3.2 Differences between Active and Passive Immunotherapies
- Figure 3.3 Differences between Specific and Non-Specific Immunotherapies
- Figure 3.4 Strategies Employed for the Redirection of T-Cells
- Figure 3.5 T-Cell Manufacturing: General Procedure
- Figure 3.6 Development History of CAR-T cells
- Figure 3.7 Structure of Chimeric Antigen Receptor
- Figure 3.8 Chimeric Antigen Receptors: Structural Variations across Different Generations
- Figure 3.9 CAR-T Cell Therapies: Development Process
- Figure 3.10 Challenges Associated with CAR-T Cell Therapies
- Figure 3.11 TCR-based Therapies: Development Process
- Figure 3.12 TIL-based Therapies: Development Process
- Figure 3.13 T-Cell Immunotherapies: Benefits and Roadblocks
- Figure 4.1 CAR-T Cell Therapies: Distribution by Type of Developer
- Figure 4.2 CAR-T Cell Therapies: Distribution by Phase of Development
- Figure 4.3 CAR-T Cell Therapies: Distribution by Therapeutic Area
- Figure 4.4 CAR-T Cell Therapies: Distribution by Phase of Development and Therapeutic Area
- Figure 4.5 CAR-T Cell Therapies: Distribution by Key Target Indications
- Figure 4.6 CAR-T Cell Therapies: Distribution by Key Target Antigens
- Figure 4.7 CAR-T Cell Therapies: Distribution by Source of T-Cells
- Figure 4.8 CAR-T Cell Therapies: Distribution by Phase of Development and Source of T-Cells
- Figure 4.9 CAR-T Cell Therapies: Distribution by Route of Administration
- Figure 4.10 CAR-T Cell Therapies: Distribution by Dosing Frequency
- Figure 4.11 CAR-T Cell Therapies: Distribution by Target Patient Segment
- Figure 4.12 CAR-T Cell Therapies: Distribution by Type of Therapy
- Figure 4.13 Most Active Industry Players: Distribution by Number of CAR-T Cell Therapies
- Figure 4.14 Most Active Non-Industry Players: Distribution by Number of CAR-T Cell Therapies
- Figure 4.15 CAR-T Cell Therapy Developers: Distribution by Year of Establishment
- Figure 4.16 CAR-T Cell Therapy Developers: Distribution by Company Size
- Figure 4.17 CAR-T Cell Therapy Developers: Distribution by Location of Headquarters (Region-wise)
- Figure 4.18 CAR-T Cell Therapies: Distribution by Location of Headquarters (Country-wise)
- Figure 5.1 TCR-based Therapies: Distribution by Type of Developer
- Figure 5.2 TCR-based Therapies: Distribution by Phase of Development
- Figure 5.3 TCR-based Therapies: Distribution by Therapeutic Area
- Figure 5.4 TCR-based Therapies: Distribution by Phase of Development and Therapeutic Area
- Figure 5.5 TCR-based Therapies: Distribution by Key Target Indication
- Figure 5.6 TCR-based Therapies: Distribution by Key Target Antigen
- Figure 5.7 TCR-based Therapies: Distribution by Source of T-Cells
- Figure 5.8 TCR-based Therapies: Distribution by Route of Administration
- Figure 5.9 TCR-based Therapies: Distribution by Phase of Development and Route of Administration
- Figure 5.10 TCR-based Therapies: Distribution by Dosing Frequency
- Figure 5.11 TCR-based Therapies: Distribution by Target Patient Segment
- Figure 5.12 TCR-based Therapies: Distribution by Type of Therapy
- Figure 5.13 TCR-based Therapies: Distribution by Phase of Development and Type of Therapy
- Figure 5.14 Most Active Industry Players: Distribution by Number of TCR-based Therapies
- Figure 5.15 Most Active Non-Industry Players: Distribution by Number of TCR-based Therapies
- Figure 5.16 TCR-based Therapy Developers: Distribution by Year of Establishment
- Figure 5.17 TCR-based Therapy Developers: Distribution by Company Size
- Figure 5.18 TCR-based Therapy Developers: Distribution by Location of Headquarters (Region-wise)
- Figure 5.19 TCR-based Therapy Developers: Distribution by Location of Headquarters (Country-wise)
- Figure 6.1 TIL-based Therapies: Distribution by Type of Developer
- Figure 6.2 TIL-based Therapies: Distribution by Phase of Development
- Figure 6.3 TIL-based Therapies: Distribution by Therapeutic Area
- Figure 6.4 TIL-based Therapies: Distribution by Key Target Indications
- Figure 6.5 TIL-based Therapies: Distribution by Source of T-Cells
- Figure 6.6 TIL-based Therapies: Distribution by Route of Administration
- Figure 6.7 TIL-based Therapies: Distribution by Dosing Frequency
- Figure 6.8 TIL-based Therapies: Distribution by Target Patient Segment
- Figure 6.9 TIL-based Therapies: Distribution by Type of Therapy
- Figure 6.10 Most Active Industry Players: Distribution by Number of TIL-based Therapies
- Figure 6.11 Most Active Non-Industry Players: Distribution by Number of TIL-based Therapies
- Figure 6.12 TIL-based Therapy Developers: Distribution by Year of Establishment
- Figure 6.13 TIL-based Therapy Developers: Distribution by Company Size
- Figure 6.14 TIL-based Therapy Developers: Distribution by Location of Headquarters (Region-wise)
- Figure 6.15 TIL-based Therapy Developers: Distribution by Location of Headquarters (Country-wise)
- Figure 7.1 CAR-T Cell Therapies: Popular Targets in Hematological Malignancies
- Figure 7.2 TCR-based Therapies: Popular Targets in Hematological Malignancies
- Figure 7.3 CAR-T Cell Therapies: Popular Targets in Solid Tumors
- Figure 7.4 TCR-based Therapies: Popular Targets in Solid Tumors
- Figure 7.5 CAR-Construction: Distribution by Generation of CAR
- Figure 7.6 CAR-Construction: Distribution by Type of scFv Antibody
- Figure 7.7 CAR-Construction: Distribution by Type of Virus Used
- Figure 7.8 CAR-Construction: Distribution by Type of Gene Transfer Method Used
- Figure 7.9 CAR-Construction: Distribution by Type of Co-Stimulatory Domain(s)
- Figure 8.1 Clinical Trial Analysis: Scope and Methodology
- Figure 8.2 CAR-T Cell Therapies Clinical Trial Analysis: Cumulative Distribution by Trial Registration Year
- Figure 8.3 CAR-T Cell Therapies Clinical Trial Analysis: Distribution by Trial Registration Year and Enrolled Patient Population
- Figure 8.4 CAR-T Cell Therapies Clinical Trial Analysis: Distribution by Trial Status
- Figure 8.5 CAR-T Cell Therapies Clinical Trial Analysis: Distribution by Trial Registration Year and Trial Status
- Figure 8.6 CAR-T Cell Therapies Clinical Trial Analysis: Distribution by Trial Phase
- Figure 8.7 CAR-T Cell Therapies Clinical Trial Analysis: Distribution of Enrolled Patient Population by Trial Phase
- Figure 8.8 CAR-T Cell Therapies Clinical Trial Analysis: Distribution by Target Patient Segment
- Figure 8.9 CAR-T Cell Therapies Clinical Trial Analysis: Distribution by Type of Sponsor / Collaborator
- Figure 8.10 CAR-T Cell Therapies Clinical Trial Analysis: Distribution by Study Design
- Figure 8.11 Most Active Industry Players: Distribution by Number of Registered Trials
- Figure 8.12 Most Active Non-Industry Players: Distribution by Number of Registered Trials
- Figure 8.13 CAR-T Cell Therapies Clinical Trial Analysis: Key Focus Areas
- Figure 8.14 CAR-T Cell Therapies Clinical Trial Analysis: Distribution of Clinical Trials by Geography
- Figure 8.15 CAR-T Cell Therapies Clinical Trial Analysis: Distribution of Completed Clinical Trials by Geography
- Figure 8.16 CAR-T Cell Therapies Clinical Trial Analysis: Distribution of Active Clinical Trials by Geography
- Figure 8.17 CAR-T Cell Therapy Clinical Trial Analysis: Distribution of Patients Enrolled by Geography
- Figure 8.18 TCR-based Therapies Clinical Trial Analysis: Cumulative Distribution by Trial Registration Year
- Figure 8.19 TCR-based Therapies Clinical Trial Analysis: Distribution by Trial Registration Year and Enrolled Patient Population
- Figure 8.20 TCR-based Therapies Clinical Trial Analysis: Distribution by Trial Status
- Figure 8.21 TCR-based Therapies Clinical Trial Analysis: Distribution by Trial Registration Year and Trial Status
- Figure 8.22 TCR-based Therapies Clinical Trial Analysis: Distribution by Trial Phase
- Figure 8.23 TCR-based Therapies Clinical Trial Analysis: Distribution of Enrolled Patient Population by Trial Phase
- Figure 8.24 TCR-based Therapies Clinical Trial Analysis: Distribution by Target Patient Segment
- Figure 8.25 TCR-based Therapies Clinical Trial Analysis: Distribution by Type of Sponsor / Collaborator
- Figure 8.26 TCR-based Therapies Clinical Trial Analysis: Distribution by Study Design
- Figure 8.27 Most Active Industry Players: Distribution by Number of Registered Trials
- Figure 8.28 Most Active Non-Industry Players: Distribution by Number of Registered Trials
- Figure 8.29 TCR-based Therapies Clinical Trial Analysis: Key Focus Areas
- Figure 8.30 TCR-based Therapies Clinical Trial Analysis: Distribution of Clinical Trials by Geography
- Figure 8.31 TCR-based Therapies Clinical Trial Analysis: Distribution of Completed Clinical Trials by Geography
- Figure 8.32 TCR-based Therapies Clinical Trial Analysis: Distribution of Active Clinical Trials by Geography
- Figure 8.33 TCR-based Therapies Clinical Trial Analysis: Distribution of Patients Enrolled by Geography
- Figure 8.34 TIL-based Therapies Clinical Trial Analysis: Cumulative Distribution by Trial Registration Year
- Figure 8.35 TIL-based Therapies Clinical Trial Analysis: Distribution by Trial Registration Year and Enrolled Patient Population
- Figure 8.36 TIL-based Therapies Clinical Trial Analysis: Distribution by Trial Status
- Figure 8.37 TIL-based Therapies Clinical Trial Analysis: Distribution by Trial Registration Year and Trial Status
- Figure 8.38 TIL-based Therapies Clinical Trial Analysis: Distribution o by Trial Phase
- Figure 8.39 TIL-based Therapies Clinical Trial Analysis: Distribution of Enrolled Patient Population by Trial Phase
- Figure 8.40 TIL-based Therapies Clinical Trial Analysis: Distribution by Target Patient Segment
- Figure 8.41 TIL-based Therapies Clinical Trial Analysis: Distribution by Type of Sponsor / Collaborator
- Figure 8.42 TIL-based Therapies Clinical Trial Analysis: Distribution by Study Design
- Figure 8.43 Most Active Industry Players: Distribution by Number of Registered Trials
- Figure 8.44 Most Active Non-Industry Players: Distribution by Number of Registered Trials
- Figure 8.45 TIL-based Therapies Clinical Trial Analysis: Key Focus Areas
- Figure 8.46 TIL-based Therapies Clinical Trial Analysis: Distribution of Clinical Trials by Geography
- Figure 8.47 TIL-based Therapies Clinical Trial Analysis: Distribution of Completed Clinical Trials by Geography
- Figure 8.48 TIL-based Therapies Clinical Trial Analysis: Distribution of Active Clinical Trials by Geography
- Figure 8.49 TIL-based Therapies Clinical Trial Analysis: Distribution of Patients Enrolled by Geography
- Figure 9.1 CAR-T Cell Therapies KOL Analysis: Distribution by Type of Organization
- Figure 9.2 CAR-T Cell Therapies KOL Analysis: Distribution by Affiliated Organization
- Figure 9.3 CAR-T Cell Therapies KOL Analysis: Distribution by Qualification
- Figure 9.4 CAR-T Cell Therapies: Distribution by Geographical Location of KOLs
- Figure 9.5 CAR-T Cell Therapies Scatter Plot: KOL Activeness versus KOL Strength
- Figure 9.6 CAR-T Cell Therapies Most Prominent KOLs: KOL Activeness versus KOL Strength
- Figure 9.7 CAR-T Cell Therapies Most Prominent KOLs: Distribution by RA Score
- Figure 9.8 CAR-T Cell Therapies Most Prominent KOLs: Comparison of RA Score with Third-Party Score
- Figure 9.9 CAR-T based Therapies Most Prominent KOLs: Comparison of RA Score with Third-Party Score (Scatter Plot)
- Figure 9.10 TCR-based Therapies KOL Analysis: Distribution by Type of Organization
- Figure 9.11 TCR-based Therapies KOL Analysis: Distribution by Affiliated Organization
- Figure 9.12 TCR-based Therapies KOL Analysis: Distribution by Qualification
- Figure 9.13 TCR-based Therapies: Distribution by Geographical Location of KOLs
- Figure 9.14 TCR-based Therapies Scatter Plot: KOL Activeness versus KOL Strength
- Figure 9.15 TCR-based Therapies Most Prominent KOLs: KOL Activeness versus KOL Strength
- Figure 9.16 TCR-based Therapies Most Prominent KOLs: Distribution by RA Score
- Figure 9.17 TCR-based Therapies Most Prominent KOLs: Comparison of RA Score with Third-Party Score
- Figure 9.18 TCR-based Therapies Most Prominent KOLs: Comparison of RA Score with Third-Party Score (Scatter Plot)
- Figure 9.19 TIL-based Therapies KOL Analysis: Distribution by Type of Organization
- Figure 9.20 TIL-based Therapies KOL Analysis: Distribution by Affiliated Organization
- Figure 9.21 TIL-based Therapies KOL Analysis: Distribution by Qualification
- Figure 9.22 TIL-based Therapies: Distribution by Geographical Location of KOLs
- Figure 9.23 TIL-based Therapies Scatter Plot: KOL Activeness versus KOL Strength
- Figure 9.24 TIL-based Therapies Most Prominent KOLs: KOL Activeness versus KOL Strength
- Figure 9.25 TIL-based Therapies Most Prominent KOLs: Distribution by RA Score
- Figure 9.26 TIL-based Therapies Most Prominent KOLs: Comparison of RA Score with Third-Party Score
- Figure 9.27 TIL-based Therapies Most Prominent KOLs: Comparison of RA Score with Third-Party Score (Scatter Plot)
- Figure 10.1 Kymriah(R): Estimated Sales Revenues
- Figure 10.2 Yescarta(R): Estimated Sales Revenues
- Figure 10.3 Tecartus(TM): Estimated Sales Revenues
- Figure 10.4 Breyanzi(R): Estimated Sales Revenues
- Figure 10.5 Abecma(R): Estimated Sales Revenues
- Figure 10.6 Carvykti(R): Estimated Sales Revenues
- Figure 10.7 Carteyva: Estimated Sales Revenues
- Figure 10.8 TBI-1501: Estimated Sales Revenues
- Figure 10.9 AUTO1: Estimated Sales Revenues
- Figure 10.10 AUTO3: Estimated Sales Revenues
- Figure 11.1 Kimmtrak(R): Estimated Sales Revenues
- Figure 11.2 GSK3377794: Estimated Sales Revenues
- Figure 11.3 ADP-A2M4: Estimated Sales Revenues
- Figure 11.4 JTCR016: Estimated Sales Revenues
- Figure 11.5 TBI-1301: Estimated Sales Revenues
- Figure 11.6 MDG1011: Estimated Sales Revenues
- Figure 12.1 LN-144: Estimated Sales Revenues
- Figure 12.2 LN-145: Estimated Sales Revenues
- Figure 12.3 ITIL-168: Estimated Sales Revenues
- Figure 12.4 LTX-315: Estimated Sales Revenues
- Figure 13.1 Genome Editing Technologies: Applications
- Figure 13.2 Genome Editing: Emerging Technology Platforms Used in T-Cell Therapies
- Figure 13.3 TALENS: Mechanism of Action
- Figure 13.4 MegaTAL: Mechanism of Action
- Figure 13.5 Zinc Finger Nuclease: Mechanism of Action
- Figure 13.6 Competitiveness Analysis: Gene Editing Platforms
- Figure 13.7 T-Cell Therapy: Key Technologies to Enhance Features / Characteristics
- Figure 13.8 Cellectis: Properties of Enhanced T-Cell Platform
- Figure 13.9 Cellectis: Allogenic CAR-T Platform, Comparison with Autologous CAR-T Platform
- Figure 14.1 Partnerships and Collaborations: Cumulative Year-Wise Trend
- Figure 14.2 Partnerships and Collaborations: Distribution by Type of Partnership
- Figure 14.3 Partnerships and Collaborations: Distribution by Type of Partnership
- Figure 14.4 Partnerships and Collaborations: Distribution by Type of Product
- Figure 14.5 Partnerships and Collaborations: Distribution by Year of Partnership and Type of Product
- Figure 14.6 Partnerships and Collaborations: Distribution by Type of Partnership and Type of Product
- Figure 14.7 Partnerships and Collaborations: Distribution by Type of Partner
- Figure 14.8 Partnerships and Collaborations: Year-Wise Distribution by Type of Partner
- Figure 14.9 Partnerships and Collaborations: Distribution by Type of Product and Type of Partner
- Figure 14.10 Most Popular Products: Distribution by Number of Partnerships
- Figure 14.11 Most Active Industry Players: Distribution by Number of Partnerships
- Figure 14.12 Most Active Non-Industry Players: Distribution by Number of Partnerships
- Figure 14.13 Partnerships and Collaborations: Distribution of Intercontinental and Intracontinental Deals
- Figure 14.14 Partnerships and Collaborations: Distribution of International and Local Deals
- Figure 15.1 Funding and Investment Analysis: Cumulative Distribution of Instances by Year
- Figure 15.2 Funding and Investment Analysis: Cumulative Distribution of Amount Invested by Year (USD Million)
- Figure 15.3 Funding and Investment Analysis: Distribution of Instances by Type of Funding
- Figure 15.4 Funding and Investment Analysis: Distribution of Total Amount Invested by Type of Funding (USD Million)
- Figure 15.5 Funding and Investments: Distribution of Amount Invested by Type of Therapy (USD Million)
- Figure 15.6 Funding and Investments: Distribution by Types of Investors
- Figure 15.7 Funding and Investments: Distribution of Amount Invested by Type of Investor (USD Million)
- Figure 15.8 Most Active Players: Distribution by Number of Instances
- Figure 15.9 Most Active Players: Distribution by Amount Invested (USD Million)
- Figure 15.10 Funding and Investment Analysis: Distribution of Amount Invested by Geography
- Figure 15.11 Most Active Investors: Distribution by Number of Funding Instances
- Figure 16.1 Patent Analysis: Distribution by Type of Patent
- Figure 16.2 CAR-T Cell Therapies Patent Analysis: Cumulative Distribution by Patent Publication Year
- Figure 16.3 CAR-T Cell Therapies Patent Analysis: Cumulative Distribution by Patent Application Year
- Figure 16.4 CAR-T Cell Therapies Patent Analysis: Cumulative Distribution by Annual Granted Patents
- Figure 16.5 CAR-T Cell Therapies Patent Analysis: Cumulative Distribution of Year-wise Filed Patent Applications
- Figure 16.6 CAR-T Cell Therapies Patent Analysis: Distribution of Year-wise Granted Patents and Patent Applications
- Figure 16.7 CAR-T Cell Therapies Patent Analysis: Distribution by Geography
- Figure 16.8 CAR-T Cell Therapies Patent Analysis: Distribution by Type of Player
- Figure 16.9 CAR-T Cell Therapies Patent Analysis: Distribution by CPC Symbols
- Figure 16.10 CAR-T Cell Therapies Patent Analysis: Key Focus Area
- Figure 16.11 Leading Industry Players: Distribution by Number of Patents
- Figure 16.12 Leading Non-Industry Players: Distribution by Number of Patents
- Figure 16.13 Leading Patent Assignees: Distribution by Number of Patents
- Figure 16.14 Patent Analysis (Top 9 CPC Symbols): Benchmarking by Leading Players
- Figure 16.15 Patent Analysis: Distribution by Patent Age
- Figure 16.16 CAR-T Therapies: Patent Valuation Analysis
- Figure 16.17 TCR-based Therapies Patent Analysis: Cumulative Distribution by Patent Publication Year
- Figure 16.18 TCR-based Therapies Patent Analysis: Cumulative Distribution by Patent Application Year
- Figure 16.19 TCR-based Therapies Patent Analysis: Cumulative Distribution by Annual Granted Patents
- Figure 16.20 TCR-based Therapies Patent Analysis: Cumulative Distribution of Year-wise Filed Patent Applications
- Figure 16.21 TCR-based Therapies Patent Analysis: Distribution by Year-wise filed Patents Application and Granted Patents
- Figure 16.22 TCR-based Therapies Patent Analysis: Distribution by Geography
- Figure 16.23 TCR-based Therapies Patent Analysis: Distribution by Type of Player
- Figure 16.24 TCR-based Therapies Patent Analysis: Distribution by CPC Symbols
- Figure 16.25 TCR-based Therapies Patent Analysis: Key Focus Area
- Figure 16.26 Leading Industry Players: Distribution by Number of Patents
- Figure 16.27 Leading Non-Industry Players: Distribution by Number of Patents
- Figure 16.28 Leading Patent Assignees: Distribution by Number of Patents
- Figure 16.29 Patent Analysis (Top 10 CPC Symbols): Benchmarking by Leading Players
- Figure 16.30 Patent Analysis: Distribution by Patent Age
- Figure 16.31 TCR-based Therapies: Patent Valuation Analysis
- Figure 16.32 TIL-based Therapies Patent Analysis: Cumulative Distribution by Patent Publication Year
- Figure 16.33 TIL-based Therapies Patent Analysis: Cumulative Distribution by Patent Application Year
- Figure 16.34 TIL-based Therapies Patent Analysis: Cumulative Distribution by Annual Granted Patents
- Figure 16.35 TIL-based Therapies Patent Analysis: Cumulative Distribution of Year-wise Filed Patent Applications
- Figure 16.36 TIL-based Therapies Patent Analysis: Distribution by Year-wise filed Patents Application and Granted Patents
- Figure 16.37 TIL-based Therapies Patent Analysis: Distribution by Geography
- Figure 16.38 TIL-based Therapies Patent Analysis: Distribution by Type of Player
- Figure 16.39 TIL-based Therapies Patent Analysis: Distribution by CPC Symbols
- Figure 16.40 TIL-based Therapies Patent Analysis: Key Focus Area
- Figure 16.41 Leading Industry Players: Distribution by Number of Patents
- Figure 16.42 Leading Non-Industry Players: Distribution by Number of Patents
- Figure 16.43 Leading Patent Assignees: Distribution by Number of Patents
- Figure 16.44 Patent Analysis (Top 10 CPC Symbols): Benchmarking by Leading Players
- Figure 16.45 Patent Analysis: Distribution by Patent Age
- Figure 16.46 TIL-based Therapies: Patent Valuation Analysis
- Figure 17.1 Mechanism of Action of Gamma Delta T-Cells
- Figure 17.2 Mechanism of Action of PD-1 Knockout Engineered T-Cell Therapies
- Figure 17.3 Functions of Treg Cells
- Figure 17.4 Other T-Cell Immunotherapies: Distribution by Type of T-Cell
- Figure 17.7 Other T-Cell Immunotherapies: Distribution by Source of T-Cells
- Figure 17.5 Other T-Cell Immunotherapies: Distribution by Phase of Development
- Figure 17.6 Other T-Cell Immunotherapies: Distribution by Therapeutic Area
- Figure 18.1 Steps for Manufacturing Cell Therapies
- Figure 18.2 Centralized Manufacturing: Process Model
- Figure 18.3 Decentralized Manufacturing: Process Model
- Figure 18.4 Cell Therapy Manufacturing: Types of Manufacturers
- Figure 18.5 Cell Therapy: Challenges and Drivers
- Figure 18.6 Cell Therapies: Potency as Critical Quality Attribute
- Figure 18.7 Cell Therapy Manufacturing: Supply Chain Model
- Figure 18.8 Cell Therapy Manufacturing: Supply Chain Risk Assessment Considerations
- Figure 19.1 Approved T-Cell Therapies: Pricing Model based on Patient Segment
- Figure 20.1 Global T-Cell Immunotherapy Market, 2022-2035 (USD Billion)
- Figure 20.2 T-Cell Immunotherapy Market: Distribution by Type of Therapy, 2025 and 2035 (USD Billion)
- Figure 20.3 T-Cell Immunotherapy Market: Distribution by Target Indication, 2025 and 2035 (USD Billion)
- Figure 20.4 T-Cell Immunotherapy Market: Distribution by Target Antigen, 2025 and 2035 (USD Billion)
- Figure 20.5 T-Cell Immunotherapy Market: Distribution by Key Players, 2025 and 2035 (USD Billion)
- Figure 20.6 T-Cell Immunotherapy Market: Distribution by Geography, 2025 and 2035 (USD Billion)
- Figure 20.7 Global CAR-T Cell Therapies Market, till 2035 (USD Billion)
- Figure 20.8 CAR-T Cell Therapies Market: Distribution by Target Indication, 2025 and 2035 (USD Billion)
- Figure 20.9 CAR-T Cell Therapies Market: Distribution by Target Antigen, 2025 and 2035 (USD Billion)
- Figure 20.10 CAR-T Cell Therapies Market: Distribution by Key Players, 2025 and 2035 (USD Billion)
- Figure 20.11 CAR-T Cell Therapies Market: Distribution by Geography, 2025 and 2035 (USD Billion)
- Figure 20.12 Kymriah(R) / Tisagenlecleucel / CTL019 (Novartis) Sales Forecast, till 2035 (USD Million)
- Figure 20.13 Yescarta(R) / Axiscabtagene Ciloleucel / KTE-C19 (Gilead Sciences) Sales Forecast, till 2035 (USD Million)
- Figure 20.14 Tecartus(TM) / Brexucabtagene Autoleucel (Gilead Sciences) Sales Forecast, till 2035 (USD Million)
- Figure 20.15 Abecma(R) / BB2121 / Idecabtagene Vicleucel (Bristol Myers Squibb) Sales Forecast, till 2035 (USD Million)
- Figure 20.16 Carvykti(R) / Ciltacabtagene Autoleucel / LCAR-B38M CAR-T / JNJ-68284528 (Janssen) Sales Forecast, till 2035 (USD Million)
- Figure 20.17 Breyanzi(R) / Lisocabtagene Maraleucel / JCAR017 (Bristol Myers Squibb) Sales Forecast, till 2035 (USD Million)
- Figure 20.18 Carteyva(R) / Relmacabtagene Autoleucel / JWCAR029 (JW Therapeutics) Sales Forecast, till 2035 (USD Million)
- Figure 20.19 BCMA CAR-T Cells (Shanghai Unicar-Therapy Bio-medicine Technology) Sales Forecast, till 2035 (USD Million)
- Figure 20.20 CD19 CAR-T (Wuhan Si'an Medical Technology) Sales Forecast, till 2035 (USD Million)
- Figure 20.21 Descartes-11 (Cartesian Therapeutics) Sales Forecast, till 2035 (USD Million)
- Figure 20.22 Descartes-08 (Cartesian Therapeutics) Sales Forecast, till 2035 (USD Million)
- Figure 20.23 Zamtocabtagene Autoleucel / MB-CART2019.1 (Miltenyi Biomedicine) Sales Forecast, till 2035 (USD Million)
- Figure 20.24 CNCT19 / HY001 (Juventas Cell Therapy) Sales Forecast, till 2035 (USD Million)
- Figure 20.25 CD30.CAR-T / TT11 (Tessa Therapeutics) Sales Forecast, till 2035 (USD Million)
- Figure 20.26 TAK-007 (Takeda) Sales Forecast, till 2035 (USD Million)
- Figure 20.27 AUTO1 (Autolus) Sales Forecast, till 2035 (USD Million)
- Figure 20.28 AUTO3 (Autolus) Sales Forecast, till 2035 (USD Million)
- Figure 20.29 CD19-CAR-T (Bioray Laboratories) Sales Forecast, till 2035 (USD Million)
- Figure 20.30 Humanized CD19-CAR-T (Shanghai Unicar-Therapy Bio-medicine Technology) Sales Forecast, till 2035 (USD Million)
- Figure 20.31 IM19 CAR-T (Beijing Immunochina Medical Science & Technology) Sales Forecast, till 2035 (USD Million)
- Figure 20.32 CCT301 CAR-T (Shanghai PerHum Therapeutics) Sales Forecast, till 2035 (USD Million)
- Figure 20.33 BinD19 (Shenzhen BinDeBio) Sales Forecast, till 2035 (USD Million)
- Figure 20.34 CARCIK-CD19 (CoImmune) Sales Forecast, till 2035 (USD Million)
- Figure 20.35 PBCAR269A (Precision BioSciences / Servier) Sales Forecast, till 2035 (USD Million)
- Figure 20.36 CD123 CAR-T cells (Chongqing Precision Biotechnology) Sales Forecast, till 2035 (USD Million)
- Figure 20.37 BCMA CAR-T (Chongqing Precision Biotechnology) Sales Forecast, till 2035 (USD Million)
- Figure 20.38 CD19/CD22-CAR-T (Shanghai Unicar-Therapy Bio-medicine Technology) Sales Forecast, till 2035 (USD Million)
- Figure 20.39 GC012F / Dual CAR-BCMA-19 (Gracell Biotechnology) Sales Forecast, till 2035 (USD Million)
- Figure 20.40 iC9-CAR19 T cells (Bellicum Pharmaceuticals) Sales Forecast, till 2035 (USD Million)
- Figure 20.41 ALLO-501A / ALLO-501 (Allogene Therapeutics) Sales Forecast, till 2035 (USD Million)
- Figure 20.42 CD19/CD20-CAR-T (Yake Biotechnology) Sales Forecast, till 2035 (USD Million)
- Figure 20.43 CD7 CAR-T (PersonGen BioTherapeutics) Sales Forecast, till 2035 (USD Million)
- Figure 20.44 Anti-FLT3 CAR-T / TAA05 (PersonGen BioTherapeutics) Sales Forecast, till 2035 (USD Million)
- Figure 20.45 CT053 (CARsgen Therapeutics) Sales Forecast, till 2035 (USD Million)
- Figure 20.46 Anti-ALPP CAR-T Cells (TCRCure Biopharma) Sales Forecast, till 2035 (USD Million)
- Figure 20.47 BCMA targeted prime CAR-T cells (Chongqing Precision Biotechnology) Sales Forecast, till 2035 (USD Million)
- Figure 20.48 ALLO-605 (Allogene Therapeutics) Sales Forecast, till 2035 (USD Million)
- Figure 20.49 WU CART 007 (Wugen) Sales Forecast, till 2035 (USD Million)
- Figure 20.50 CT103A (Nanjing IASO Biotherapeutics) Sales Forecast, till 2035 (USD Million)
- Figure 20.51 Global TCR-based Therapies Market, till 2035 (USD Billion)
- Figure 20.52 TCR-Based Therapies Market: Distribution by Target Indication, 2025 and 2035 (USD Billion)
- Figure 20.53 TCR-Based Therapies Market: Distribution by Target Antigen, 2025 and 2035 (USD Billion)
- Figure 20.54 TCR-Based Therapies Market: Distribution by Key Players, 2025 and 2035 (USD Billion)
- Figure 20.55 TCR-Based Therapies Market: Distribution by Geography, 2025 and 2035 (USD Billion)
- Figure 20.56 Kimmtrak(R) (IMCgp100 / Tebentafusp) (Immunocore) Sales Forecast, till 2035 (USD Million)
- Figure 20.57 GSK3377794 (GlaxoSmithKline) Sales Forecast, till 2035 (USD Million)
- Figure 20.58 YT-E001 (China Immunotech) Sales Forecast, till 2035 (USD Million)
- Figure 20.59 ADP-A2M4 / Afamitresgene Autoleucel / Afami-cel (Adaptimmune Therapeutics) Sales Forecast, till 2035 (USD Million)
- Figure 20.60 EBV-specific TCR-T cell with anti-PD1 auto-secreted element (TCRCure Biopharma) Sales Forecast, till 2035 (USD Million)
- Figure 20.61 NTLA-5001 (Intellia Therapeutics) Sales Forecast, till 2035 (USD Million)
- Figure 20.62 TBI-1301 (Takara Bio) Sales Forecast, till 2035 (USD Million)
- Figure 20.63 LMBP2-specific TCR-T (Xinqiao Hospital of Chongqing / TCR CURE Biopharma Technology) Sales Forecast, till 2035 (USD Million)
- Figure 20.64 FH-MCVA2TCR (TCRCure Biopharma) Sales Forecast, till 2035 (USD Million)
- Figure 20.65 Global TIL-based Therapies Market, 2022-2035 (USD Billion)
- Figure 20.66 TIL-Based Therapies Market: Distribution by Target Indication, 2025 and 2035 (USD Billion)
- Figure 20.67 TIL-Based Therapies Market: Key Players, 2025 and 2035 (USD Billion)
- Figure 20.68 TIL-Based Therapies Market: Distribution by Geography, 2025 and 2035 (USD Billion)
- Figure 20.69 Lifileucel / LN-144 (Iovance Biotherapeutics) Sales Forecast, till 2035 (USD Million)
- Figure 20.70 LN-145 (Iovance Biotherapeutics) Sales Forecast, till 2035 (USD Million)
- Figure 20.71 LTX-315 and TILs (Lytix Biopharma) Sales Forecast, till 2035 (USD Million)
- Figure 20.72 TILs (Prometheus Laboratories) Sales Forecast, till 2035 (USD Million)
- Figure 20.73 Donor Lymphocyte Infusion (Incyte) Sales Forecast, till 2035 (USD Million)
- Figure 20.74 ITIL-168 (Instil Bio) Sales Forecast, till 2035 (USD Million)
- Figure 20.75 IOV-2001 (Iovance Biotherapeutics) Sales Forecast, till 2035 (USD Million)
- Figure 20.76 TILs (CAR-T (Shanghai) Cell Biotechnology) Sales Forecast, till 2035 (USD Million)
- Figure 20.77 TILs (Bristol-Myers Squibb) Sales Forecast, till 2035 (USD Million)
- Figure 21.1 Channels Used for Promotional Campaigns
- Figure 21.2 Promotional / Marketing Strategy: Product Website Analysis
- Figure 21.3 Product Website Analysis: Kymriah(R), Messages for Healthcare Professionals
- Figure 21.4 Product Website Analysis: Kymriah(R), Messages for Patients
- Figure 21.5 Product Website Analysis: Kymriah(R), Patient Support Program
- Figure 21.6 Product Website Analysis: Yescarta(R), Messages for Healthcare Professionals
- Figure 21.7 Product Website Analysis: Yescarta(R), Messages for Patients
- Figure 21.8 Product Website Analysis: Yescarta(R), Kite Konnect
- Figure 21.9 Product Website Analysis: Yescarta(R), Platform for Referral Patient Treatment and Connecting with Treatment Center
- Figure 21.10 Product Website Analysis: Tecartus(TM), Messages for Healthcare Professionals
- Figure 21.11 Product Website Analysis: Tecartus(TM), Messages for Patients
- Figure 21.12 Product Website Analysis: Tecartus(TM), Kite Konnect
- Figure 21.13 Product Website Analysis: Breyanzi(R), Messages for Healthcare Professional
- Figure 21.14 Product Website Analysis: Breyanzi(R), Messages for Patients
- Figure 21.15 Product Website Analysis: Breyanzi(R), Cell Therapy 360
- Figure 21.16 Product Website Analysis: Abecma(R), Messages for Healthcare Professional
- Figure 21.17 Product Website Analysis: Abecma(R), Messages for Patients
- Figure 21.18 Product Website Analysis: Abecma(R), Cell Therapy 360
- Figure 21.19 Product Website Analysis: Carvykti(R), Messages for Healthcare Professional
- Figure 21.20 Product Website Analysis: Carvykti(R), Messages for Patients
- Figure 21.21 Product Website Analysis: Carvykti(R), MyCARVYKTI
- Figure 21.22 Product Website Analysis: Kimmtrak(R), Messages for Healthcare Professional
- Figure 21.23 Product Website Analysis: Kimmtrak(R), Messages for Patients
- Figure 21.24 Product Website Analysis: Kimmtrak(R), Kimmtrak Connect
- Figure 23.1 Concluding Remarks: Market Landscape
- Figure 23.2 Concluding Remarks: Clinical Trial Analysis
- Figure 23.3 Concluding Remarks: Key Opinion Leaders
- Figure 23.4 Concluding Remarks: Partnerships and Collaborations
- Figure 23.5 Concluding Remarks: Funding and Investments Analysis
- Figure 23.6 Concluding Remarks: Patent Analysis
- Figure 23.7 Concluding Remarks: Market Forecast and Opportunity Analysis
 T 細胞治療市場規模、佔有率、成長分析、按方式、按類型、按適應症、按最終用戶、按地區 - 行業預測,2024-2031 年
 T 細胞治療市場:依方式、治療類型、適應症分類 - 全球預測 2025-2030
 T 細胞治療市場 - 全球產業規模、佔有率、趨勢、機會和預測,按治療類型(CAR T 細胞治療、基於 T 細胞受體、基於腫瘤浸潤淋巴細胞)、按適應症、按地區和競爭細分, 2019-2029F
 全球 T 細胞療法市場研究報告 - 2024 年至 2032 年產業分析、規模、佔有率、成長、趨勢和預測
 T 細胞治療市場,按治療類型、適應症、國家和地區 - 2023-2030 年行業分析、市場規模、市場佔有率和預測
 T細胞療法市場:各療法類型,各適應症,各終端用戶:全球機會分析與產業預測,2023-2032年
 T 細胞療法市場規模、份額和趨勢分析報告,按方式、按療法(CAR T 細胞、腫瘤浸潤淋巴細胞)、按適應症(血液惡性腫瘤(淋巴瘤))、按分部預測,2023-2030 年