


 |
市場調查報告書
商品編碼
1682708
數位生物標記市場:各產品類型,各解決方案目的,生物標記類別,各治療領域,不同商業模式,各主要地區:2035年前的產業趨勢與全球預測Digital Biomarkers Market by Type of Product, Purpose of Solution, Type of Biomarker, Therapeutic Area, Business Model and Key Geographical Regions : Industry Trends and Global Forecasts, Till 2035 |
||||||
預計到 2035 年,全球數位生物標記市場規模將從目前的 56 億美元增長至 358 億美元,在預測期內以 18.48% 的複合年增長率增長。
數位生物標記解決方案將感測器和穿戴式裝置等硬體與軟體功能相結合,以監測人體內的特定生物標記物,並透過分析為目標適應症提供關鍵見解。在現代醫療保健中,數位生物標記透過持續監測和評估臨床相關的健康參數,有助於提高診斷和治療的準確性。根據聯合國發布的報告,預計2050年,65歲以上人口將增加一倍,達到近15億人。由於慢性病發病率上升和人口老化,未來幾年整體醫療成本可能會大幅增加。研究表明,早期介入並持續追蹤症狀可以帶來多種益處,包括改善患者的生活品質和減輕醫療管理負擔。
此外,虛擬和分散臨床研究的興起正在刺激數位生物標記物的採用,這些標記物可以提供準確、可靠、實時的健康信息,而無需患者頻繁就診。這一趨勢將有助於將大量患者納入臨床研究,提供更以患者為中心的方法,並提供更多樣化和精細化的生物標記數據集。隨著遠端患者監測解決方案(尤其是針對慢性疾病)的採用越來越多地以及對個人化治療的偏好,數位生物標記市場可能會在短期內大幅增長。
目前,全球有超過 220 種數位生物標記解決方案可供使用或正在開發中,其中大多數解決方案是資料收集/分析工具(特別是軟體平台和腕帶)。
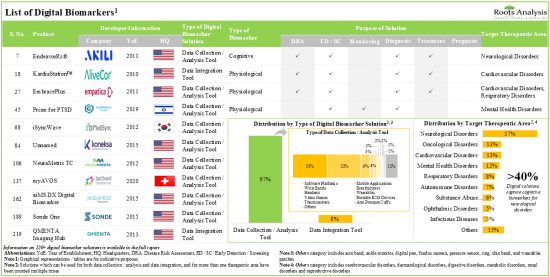
超過40%的數位解決方案收集和分析與各種生理生物標記(脈搏、心率、體溫等)相關的數據,其中大部分用於成年人和老年人的即時監測。一些擁有多種資源的公司(新創公司和成熟企業)正在積極開展這一領域的工作,其中大多數公司位於北美。不僅工業界,而且非工業界的參與者也已在該領域建立了戰略聯盟,其中大多數跨洲和洲內聯盟都是由北美參與者建立的。
在過去三年中,已經組織了 50 多場活動(線下和線上)來討論數位生物標記領域的持續創新和臨床結果,此外,大約有 55 位知名利益相關者參加了這些活動。自 2019 年以來,已向各利益相關者提交/授予了 750 多項與數位生物標記相關的專利,以保護該領域產生的智慧財產權。到 2035 年,數位生物標記市場預計將以 18.5% 的複合年增長率 (CAGR) 成長,並且預測的機會可能分佈在不同類型的產品、解決方案目標和生物標記類型中。
本報告提供全球數位生物標記市場相關調查,提供市場概要,以及各產品類型,解決方案的各目的,生物標記類別,各治療領域,不同商業模式,各主要地區的趨勢,及加入此市場的主要企業簡介等資訊。
目錄
第1章 序文
第2章 調查手法
第3章 經濟以及其他的計劃特有的考慮事項
第4章 摘要整理
第5章 簡介
第6章 市場形勢
第7章 產品競爭力分析
第8章 企業簡介:數位生物標記解決方案開發企業
第9章 夥伴關係和合作
第10章 資金籌措投資
第11章 世界的事件的分析
第12章 專利分析
第13章 大型製藥公司的配合措施
第14章 對市場的影響分析:促進因素,阻礙因素,機會,課題
第15章 全球數位生物標記解決方案市場
第16章 數位生物標記解決方案市場,各產品類型
第17章 數位生物標記解決方案市場,解決方案的各目的
第18章 數位生物標記解決方案市場,各生物標記類型
第19章 數位生物標記解決方案市場,各治療領域
第20章 數位生物標記解決方案市場,不同商業模式
第21章 數位生物標記解決方案市場,各主要地區
第22章 結論
第23章 執行洞察
第24章 附錄1:表格形式的資料
第25章 附錄2:企業·團體一覽
DIGITAL BIOMARKERS MARKET: OVERVIEW
As per Roots Analysis, the global digital biomarkers market is estimated to grow from USD 5.6 billion in the current year to USD 35.8 billion by 2035, at a CAGR of 18.48% during the forecast period, till 2035.
The market opportunity for cell and gene therapy supply chain software has been distributed across the following segments:
Type of Product
- Software / Applications
- Wearables
- Sensors
- Gaming Solutions
Purpose of Solution
- Diagnosis
- Early Detection
- Monitoring
- Predictive Insights
Type of Biomarker
- Cognitive Biomarkers
- Idiosyncratic Biomarkers
- Physiological Biomarkers
- Vocal Biomarkers
- Other Biomarkers
Therapeutic Area
- Autoimmune Disorders
- Cardiovascular Disorders
- Infectious Diseases
- Mental Health Disorders
- Neurological Disorders
- Respiratory Disorders
- Substance Abuse Disorders
- Others
Business Model
- B2B
- B2C
Key Geographical Regions
- North America
- Europe
- Asia-Pacific
- Middle East and North Africa
- Rest of the World
DIGITAL BIOMARKERS MARKET: GROWTH AND TRENDS
Digital biomarker solutions are a combination of hardware and software features, such as sensors, and wearables, that monitor specific biomarkers in the human body that can be analyzed to generate significant insights about target indication(s). In modern healthcare, digital biomarkers help enhance diagnostic and therapeutic precision by enabling continuous monitoring and evaluation of clinically relevant health parameters. As per the report published by the United Nations, the population aged 65 years and above is projected to double reaching close to 1.5 billion in 2050. Owing to the rise in the prevalence of chronic disorders and the aging population, the overall healthcare costs are likely to be increased substantially over the coming years. Studies have shown that continuous symptom tracking with early intervention offers various benefits, such as improvement in the quality of life of patients and reduced medical management burden.
Further, the growing number of virtual and decentralized clinical studies has spurred the adoption of digital biomarkers that provide accurate, reliable and real-time health information without the need for frequent in-person visits by the patients. This trend promotes the participation of a large number of patients in clinical studies, offers a more patient-centric approach, and provides a more diverse and elaborate dataset of biomarkers. Driven by the rising adoption of remote patient monitoring solutions (specifically during chronic indications) and preference for personalized treatments, the digital biomarkers market is likely to grow at a significant pace in the foreseeable future.
DIGITAL BIOMARKERS MARKET: KEY INSIGHTS
The report delves into the current state of the digital biomarkers market and identifies potential growth opportunities within the industry. Some key findings from the report include:
- Presently, over 220 digital biomarker solutions are available / being developed by different players across the globe; of these, the majority of the solutions are data collection / analysis tools (specifically software platforms and wrist bands).
- Over 40% of digital solutions collect / analyze data related to various physiological biomarkers (such as pulse rate, heart rate and body temperature); most of these are used for real-time monitoring of adults and older adults.
- Several firms (encompassing startups as well as well-established companies), with varying resources, have been actively involved in this domain; the majority of these firms are based in North America.
- Several industry as well as non-industry players have forged strategic deals in this domain; most of the intercontinental and intracontinental partnerships have been signed by players based in North America.
- Foreseeing a lucrative potential within this domain, several firms have invested over USD 3 billion (across over 160 funding instances), since 2015; notably, majority of the funds were raised for developing imaging biomarkers.
- In the past three years, over 50 events (offline and online) have been held to discuss the ongoing innovation and clinical outcomes in the digital biomarkers' domain; further, around 55 eminent stakeholders have participated in these events.
- Since 2019, over 750 patents related to digital biomarkers have been filed / granted to various stakeholders to protect the intellectual property generated within this domain.
- The digital biomarkers market is anticipated to grow at an annualized rate (CAGR) of 18.5%, till 2035; the projected opportunity is likely to be distributed across different types of products, purposes of solutions and types of biomarkers.
DIGITAL BIOMARKERS MARKET: KEY SEGMENTS
Wearables Segment Occupies the Largest Share of the Digital Biomarkers Market
Based on the type of product, the market is segmented into software / applications, wearables, sensors and gaming solutions. At present, the wearables segment holds the maximum share of the digital biomarkers market. This can be attributed to the shifting preference of patients towards virtual consultations and telemedicine, and the growing prevalence of neurodegenerative disorders which in turn, has led to higher adoption of wearable digital biomarker solutions. It is worth highlighting that the digital biomarkers market for sensors is likely to grow at a relatively higher CAGR in the coming decade.
Monitoring Segment is Likely to Dominate the Digital Biomarkers Market During the Forecast Period
Based on the purpose of solution, the market is segmented into diagnosis, early detection, monitoring, and predictive insights. Currently, monitoring segment holds the maximum share of the digital biomarkers market. This can be attributed to the increasing prevalence of chronic disorders, which necessitates continuous tracking of health parameters of patients. It is worth noting that the digital biomarkers market for predictive insights is likely to grow at a relatively higher CAGR in the coming decade.
Physiological Biomarkers Occupy the Largest Share of the Digital Biomarkers Market
Based on the type of biomarker, the market is segmented into cognitive, idiosyncratic, physiological, vocal and other biomarkers. At present, the digital biomarker solutions that capture physiological biomarkers hold the maximum share of the digital biomarkers market. This can be attributed to high clinical validation of such biomarkers, compared to the other types of biomarkers, such as cognitive, idiosyncratic and vocal biomarkers. It is worth highlighting that the digital biomarkers market for vocal digital biomarkers is likely to grow at a relatively higher CAGR in the coming decade.
Neurological Disorders Account for the Largest Share of the Digital Biomarkers Market
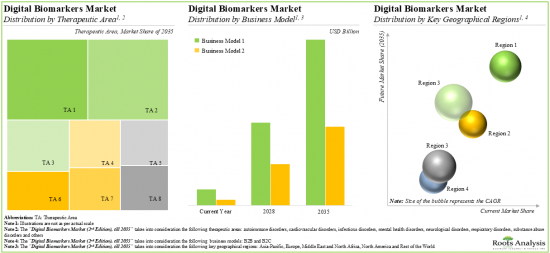
Based on the therapeutic areas, the market is segmented into autoimmune disorders, cardiovascular disorders, infectious diseases, mental health disorders, neurological disorders, respiratory disorders, substance abuse disorders and other disorders. While neurological disorders account for a relatively higher market share, it is worth highlighting that the autoimmune disorders and substance abuse disorders segment is expected to witness substantial market growth in the coming years.
B2C Business Model Occupies the Largest Share of the Digital Biomarkers Market
Based on the business model, the market is segmented into B2B and B2C. At present, majority of the revenue is generated through the B2C business model. However, this trend is likely to evolve during the forecasted period, as developers are increasingly adopting B2B business models in order to maintain sustained growth.
North America Accounts for the Largest Share of the Market
Based on key geographical regions, the market is segmented into North America, Europe, Asia-Pacific, Middle East and North Africa, and Rest of the world. The majority share is expected to be captured by players based in North America. It is worth highlighting that, over the years, the market in Asia-Pacific is expected to grow at a higher CAGR.
Example Players in the Digital Biomarkers Market
- Acculi Labs
- ActiGraph
- AliveCor
- ATCOR
- BACtrack
- Biogen
- BioSerenity
- BioSensics
- Eyenuk
- Empatica
- Feel Therapeutics
- icometrix
- iMediSync
- IXICO
- Kinsa
- Koneksa Health
- Kontigo Care
- Progentec Diagnostics
- Quibim
- Vocalis Health
Primary Research Overview
The opinions and insights presented in this study were influenced by discussions conducted with multiple stakeholders. The research report features detailed transcripts of interviews held with the following industry stakeholders:
- Founder and Chief Executive Officer, Small Company, India
- Co-founder and Chief Executive Officer, Small Company, France
- Business Development Manager, Mid-sized Company, UK
- Former Chief Commercial Officer, Small Company, Israel
DIGITAL BIOMARKERS MARKET: RESEARCH COVERAGE
- Market Sizing and Opportunity Analysis: The report features an in-depth analysis of the digital biomarkers market, focusing on key market segments, including [A] type of product, [B] purpose of solution, [C] type of biomarker, [D] therapeutic area, [E] business model and [F] key geographical regions.
- Market Landscape: A comprehensive evaluation of digital biomarker solutions, considering various parameters, such as [A] type of product, [B] type of digital biomarker solution, [C] type of biomarker, [D] status of development, [E] purpose of biomarker, [F] target therapeutic area, [G] target population, [H] type of end-user, [I] clinical validation of biomarker solution and [J] AI integration within biomarker solution. In addition, the chapter includes a detailed analysis of digital biomarkers developers, along with information on their [K] year of establishment, [L] company size (in terms of employee count), [M] location of headquarters, [N] type of business model and [O] most active players (in terms of number of digital biomarker solutions offered).
- Product Competitiveness Analysis: A comprehensive competitive analysis of digital biomarker solutions, examining factors, such as developer strength, product competitiveness and status of development.
- Company Profiles: In-depth profiles of key digital biomarkers developers, focusing on [A] company overviews, [B] financial information (if available), [C] digital biomarker portfolio, [D] recent developments and [D] an informed future outlook.
- Partnerships and Collaborations: An analysis of partnerships established in this sector based on several parameters, such as [A] year of partnership, [B] type of partnership, [C] type of biomarker, [D] target therapeutic area, [E] type of partner and [F] most active players (in terms of the number of partnerships signed). This section also highlights the regional distribution of partnership activity in this market.
- Funding and Investment Analysis: A detailed evaluation of the investments made in this domain based on several parameters, such as [A] year of funding, [B] type of funding, [C] amount invested (USD million), [D] type of biomarker, [E] therapeutic area, [F] most active players (in terms of number of funding instances and amount raised), [G] most active investors (in terms of number of funding instances) and [H] regional distribution of funding.
- Global Events Analysis: A detailed analysis of global events attended by the companies in the digital biomarkers industry, based on relevant parameters such as year of event, type of event, event platform, event organizer, location of event, and most active players, speakers and designations (in terms of number of events).
- Patent Analysis: Detailed analysis of various patents filed / granted related to digital biomarkers based on [A] type of patent (granted patents, patent applications and others), [B] publication year, [C] application year, [D] patent jurisdiction, [E] cooperative patent classification (CPC) symbols, [F] type of applicant and [G] most active players (in terms of the number of patents filed / granted). It also includes a patent benchmarking analysis and a detailed valuation analysis.
- Big Pharma Analysis: A comprehensive examination of various initiatives focused on digital biomarkers undertaken by major pharmaceutical companies. This analysis various initiatives, such as number of clinical trials, number of collaborations, number of conferences attended, number of funding instances, and number of publications.
- Market Impact Analysis: The report analyzes various factors such as drivers, restraints, opportunities, and challenges affecting market growth.
KEY QUESTIONS ANSWERED IN THIS REPORT
- How many companies are currently engaged in this market?
- Which are the leading companies in this market?
- What kind of partnership models are commonly adopted by industry stakeholders?
- How much investment has been made by industry stakeholders in recent years?
- What factors are likely to influence the evolution of this market?
- What is the current and future market size?
- What is the CAGR of this market?
- How is the current and future market opportunity likely to be distributed across key market segments?
REASONS TO BUY THIS REPORT
- The report provides a comprehensive market analysis, offering detailed revenue projections of the overall market and its specific sub-segments. This information is valuable to both established market leaders and emerging entrants.
- Stakeholders can leverage the report to gain a deeper understanding of the competitive dynamics within the market. By analyzing the competitive landscape, businesses can make informed decisions to optimize their market positioning and develop effective go-to-market strategies.
- The report offers stakeholders a comprehensive overview of the market, including key drivers, barriers, opportunities, and challenges. This information empowers stakeholders to stay abreast of market trends and make data-driven decisions to capitalize on growth prospects.
ADDITIONAL BENEFITS
- Complimentary PPT Insights Packs
- Complimentary Excel Data Packs for all Analytical Modules in the Report
- 10% Free Content Customization
- Detailed Report Walkthrough Session with Research Team
- Free Updated report if the report is 6-12 months old or older
TABLE OF CONTENTS
1. PREFACE
- 1.1. Digital Biomarker Solutions Market
- 1.2. Market Share Insights
- 1.3. Key Market Insights
- 1.4. Report Coverage
- 1.5. Key Questions Answered
- 1.6. Chapter Outlines
2. RESEARCH METHODOLOGY
- 2.1 Chapter Overview
- 2.2. Research Assumptions
- 2.3. Project Methodology
- 2.4. Forecast Methodology
- 2.5. Robust Quality Control
- 2.6. Key Market Segmentation
- 2.7. Key Considerations
- 2.7.1. Demographics
- 2.7.2. Economic Factors
- 2.7.3. Government Regulations
- 2.7.4. Supply Chain
- 2.7.5. COVID Impact
- 2.7.6. Market Access
- 2.7.7. Healthcare Policies
- 2.7.8. Industry Consolidation
3.ECONOMIC AND OTHER PROJECT SPECIFIC CONSIDERATIONS
- 3.1. Chapter Overview
- 3.2. Market Dynamics
- 3.2.1. Time Period
- 3.2.1.1. Historical Trends
- 3.2.1.2. Current and Future Estimates
- 3.2.2. Currency Coverage and Foreign Exchange Rate
- 3.2.2.1. Major Currencies Affecting the Market
- 3.2.2.2. Factors Affecting Currency Fluctuations and Foreign Exchange Rates
- 3.2.2.3. Impact of Foreign Exchange Rate Volatility on the Market
- 3.2.2.4. Strategies for Mitigating Foreign Exchange Risk
- 3.2.3. Trade Policies
- 3.2.3.1. Impact of Trade Barriers on the Market
- 3.2.3.2. Strategies for Mitigating the Risks Associated with Trade Barriers
- 3.2.4. Recession
- 3.2.4.1. Historical Analysis of Past Recessions and Lessons Learnt
- 3.2.4.2. Assessment of Current Economic Conditions and Potential Impact on the Market
- 3.2.5. Inflation
- 3.2.5.1. Measurement and Analysis of Inflationary Pressures in the Economy
- 3.2.5.2. Potential Impact of Inflation on the Market Evolution
- 3.2.1. Time Period
4. EXECUTIVE SUMMARY
5. INTRODUCTION
- 5.1 Chapter Overview
- 5.2. Overview of Digital Biomarkers
- 5.2.1. Classification of Digital Biomarkers
- 5.2.2. Types of Biological Signals Captured by Digital Biomarker Solutions
- 5.2.3. Key Advantages and Limitations
- 5.3. Product Development and Commercialization Path for Digital Biomarker Solutions
- 5.3.1. Discovery
- 5.3.2. Validations and Submissions
- 5.3.3. Distribution and Marketing
- 5.4. Recent Advancements related to Digital Biomarker Solutions
- 5.5. Impact of COVID-19 Pandemic on the Digital Biomarkers Domain
- 5.6. Prevalent Trends Related to Digital Biomarker Solutions
- 5.6.1. Emerging Focus Areas
6. MARKET LANDSCAPE
- 6.1. Chapter Overview
- 6.2. Digital Biomarker Solutions: Overall Market Landscape
- 6.2.1. Analysis by Type of Product
- 6.2.2. Analysis by Type of Digital Biomarker Solution
- 6.2.3. Analysis by Type of Biomarker
- 6.2.4. Analysis by Status of Development
- 6.2.5. Analysis by Type of Biomarker and Status of Development
- 6.2.6. Analysis by Purpose of Digital Biomarker Solution
- 6.2.7. Analysis by Target Therapeutic Area
- 6.2.8. Analysis by Type of Biomarker and Target Therapeutic Area
- 6.2.9. Analysis by Target Population
- 6.2.10. Analysis by End-user
- 6.2.11. Analysis by Availability of Clinical Validation
- 6.2.12. Analysis by Availability of Clinical Validates Solutions by Target Therapeutic Area
- 6.2.13. Analysis by Availability of AI Integration
- 6.3. Digital Biomarker Solutions: Developer Landscape
- 6.3.1. Analysis by Year of Establishment
- 6.3.2. Analysis by Company Size
- 6.3.3. Analysis by Location of Headquarters
- 6.3.4. Analysis by Company Size and Location of Headquarters
- 6.3.5. Most Active Players: Analysis by Number of Digital Biomarker Solutions Developed
7. PRODUCT COMPETITIVENESS ANALYSIS
- 7.1. Chapter Overview
- 7.2. Assumptions and Key Parameters
- 7.3. Methodology
- 7.4. Digital Biomarker Solutions: Product Competitiveness Analysis
- 7.4.1. Digital Biomarker Solutions Developed by Players based in North America
- 7.4.2. Digital Biomarker Solutions Developed by Players based in Europe
- 7.4.3. Digital Biomarker Solutions Developed by Players based in Asia-Pacific and Rest of the World
8. COMPANY PROFILES: DIGITAL BIOMARKER SOLUTIONS DEVELOPERS
- 8.1. Chapter Overview
- 8.2. Detailed Company Profiles of Leading Digital Biomarker Solutions Developers
- 8.2.1. BioSensics
- 8.2.1.1. Company Overview
- 8.2.1.2. Digital Biomarker Solutions Portfolio
- 8.2.1.3. Recent Developments and Future Outlook
- 8.2.2. AliveCor
- 8.2.2.1. Company Overview
- 8.2.2.2. Digital Biomarker Solutions Portfolio
- 8.2.2.3. Recent Developments and Future Outlook
- 8.2.3. BACtrack
- 8.2.3.1. Company Overview
- 8.2.3.2. Digital Biomarker Solutions Portfolio
- 8.2.3.3. Recent Developments and Future Outlook
- 8.2.4. Eyenuk
- 8.2.4.1. Company Overview
- 8.2.4.2. Digital Biomarker Solutions Portfolio
- 8.2.4.3. Recent Developments and Future Outlook
- 8.2.5. Quibim
- 8.2.5.1. Company Overview
- 8.2.5.2. Digital Biomarker Solutions Portfolio
- 8.2.5.3. Recent Developments and Future Outlook
- 8.2.6. Feel Therapeutics
- 8.2.6.1. Company Overview
- 8.2.6.2. Digital Biomarker Solutions Portfolio
- 8.2.6.3. Recent Developments and Future Outlook
- 8.2.7. Empatica
- 8.2.7.1. Company Overview
- 8.2.7.2. Digital Biomarker Solutions Portfolio
- 8.2.7.3. Recent Developments and Future Outlook
- 8.2.8. icometrix
- 8.2.8.1. Company Overview
- 8.2.8.2. Digital Biomarker Solutions Portfolio
- 8.2.8.3. Recent Developments and Future Outlook
- 8.2.9. Biogen
- 8.2.9.1. Company Overview
- 8.2.9.2. Digital Biomarker Solutions Portfolio
- 8.2.9.3. Recent Developments and Future Outlook
- 8.2.1. BioSensics
- 8.3. Short Company Profiles of Other Prominent Developers
- 8.3.1. Acculi Labs
- 8.3.1.1. Company Overview
- 8.3.1.2. Product Portfolio: Digital Biomarker Solutions
- 8.3.2. IXICO
- 8.3.2.1. Company Overview
- 8.3.2.2. Product Portfolio: Digital Biomarker Solutions
- 8.3.3. Kinsa
- 8.3.3.1. Company Overview
- 8.3.3.2. Product Portfolio: Digital Biomarker Solutions
- 8.3.4. Progentec Diagnostics
- 8.3.4.1. Company Overview
- 8.3.4.2. Product Portfolio: Digital Biomarker Solutions
- 8.3.5. Vocalis Health
- 8.3.5.1. Company Overview
- 8.3.5.2. Product Portfolio: Digital Biomarker Solutions
- 8.3.6. Kontigo Care
- 8.3.6.1. Company Overview
- 8.3.6.2. Product Portfolio: Digital Biomarker Solutions
- 8.3.7. Koneksa Health
- 8.3.7.1. Company Overview
- 8.3.7.2. Product Portfolio: Digital Biomarker Solutions
- 8.3.8. ActiGraph
- 8.3.8.1. Company Overview
- 8.3.8.2. Product Portfolio: Digital Biomarker Solutions
- 8.3.9. BioSerenity
- 8.3.9.1. Company Overview
- 8.3.9.2. Product Portfolio: Digital Biomarker Solutions
- 8.3.10. ATCOR
- 8.3.10.1. Company Overview
- 8.3.10.2. Product Portfolio: Digital Biomarker Solutions
- 8.3.11. iMediSync
- 8.3.11.1. Company Overview
- 8.3.11.2. Product Portfolio: Digital Biomarker Solutions
- 8.3.1. Acculi Labs
9. PARTNERSHIPS AND COLLABORATIONS
- 9.1. Chapter Overview
- 9.2. Partnership Models
- 9.3. Digital Biomarker Solutions: Partnerships and Collaborations
- 9.3.1. Analysis by Year of Partnership
- 9.3.2. Analysis by Type of Partnership
- 9.3.3. Analysis by Year and Type of Partnership
- 9.3.4. Analysis by Type of Biomarker
- 9.3.5. Analysis by Type of Partnership and Type of Biomarker
- 9.3.6. Analysis by Therapeutic Area
- 9.3.7. Analysis of Type of Partnership and Therapeutic Area
- 9.3.8. Analysis by Type of Partner
- 9.3.9. Most Active Players: Analysis by Number of Partnerships
- 9.3.10. Analysis by Geography
- 9.3.10.1. Intracontinental and Intercontinental Deals
- 9.3.10.2. International and Local Deals
10. FUNDING AND INVESTMENTS
- 10.1. Chapter Overview
- 10.2. Funding Models
- 10.3. Digital Biomarker Solutions: Funding and Investments
- 10.3.1. Analysis by Year of Investment
- 10.3.2. Analysis by Amount Invested
- 10.3.3. Analysis of Funding Instances by Type of Funding
- 10.3.4. Analysis of Amount Invested by Type of Funding
- 10.3.5. Analysis of Funding Instances by Type of Biomarker
- 10.3.6. Analysis of Funding Instances and Amount Invested by Therapeutic Area
- 10.3.7. Leading Investors: Distribution by Number of Funding Instances
- 10.3.8. Most Active Players: Distribution by Number of Funding Instances
- 10.3.9. Most Active Players: Analysis by Amount Raised
- 10.3.10. Most Active Players: Analysis by Geography
11. GLOBAL EVENTS ANALYSIS
- 11.1. Chapter Overview
- 11.2. Scope and Methodology
- 11.3. Digital Biomarker Solutions: Global Events Analysis
- 11.3.1. Analysis by Year of Event
- 11.3.2. Analysis by Type of Event
- 11.3.3. Analysis by Year and Type of Event
- 11.3.4. Analysis by Event Platform
- 11.3.5. Analysis by Location of Event
- 11.3.6. Word Cloud Analysis: Key Focus Areas
- 11.3.7. Most Active Event Organizers: Analysis by Number of Events
- 11.3.8. Most Active Players: Analysis by Number of Events
- 11.4. Global Events: Speaker Analysis
- 11.4.1. Most Active Speakers: Analysis by Number of Events
- 11.4.2. Analysis by Designation / Qualification of Speakers
- 11.5. List of Upcoming Global Events
- 11.6. Concluding Remarks
12. PATENT ANALYSIS
- 12.1. Chapter Overview
- 12.2. Scope and Methodology
- 12.3. Digital Biomarker Solutions: Patent Analysis
- 12.3.1. Analysis by Patent Application Year
- 12.3.2. Analysis by Patent Publication Year
- 12.3.3. Analysis by Type of Patent and Patent Publication Year
- 12.3.4. Analysis by Patent Jurisdiction
- 12.3.5. Analysis by CPC Symbols
- 12.3.6. Analysis by Patent Publication Year and Type of Applicant
- 12.3.7. Leading Players: Analysis by Number of Patents
- 12.3.8. Leading Patent Assignees: Analysis by Number of Patents
- 12.4. Patent Benchmarking Analysis
- 12.4.1. Analysis By Patent Characteristics
- 12.5. Patent Valuation
- 12.6. Leading Patents by Number of Citations
13. BIG PHARMA INITIATIVES
- 13.1. Chapter Overview
- 13.2. Methodology and Key Parameters
- 13.3. Big Pharma Initiatives Related to Digital Biomarker Solutions
- 13.3.1. Analysis by Type of Initiatives
- 13.3.2. Heat Map Analysis
- 13.4. Big Pharma Players: Benchmark Analysis
- 13.4.1. Spider Web Analysis: AbbVie
- 13.4.2. Spider Web Analysis: Amgen
- 13.4.3. Spider Web Analysis: AstraZeneca
- 13.4.4. Spider Web Analysis: Bayer
- 13.4.5. Spider Web Analysis: Bristol Myers Squibb
- 13.4.6. Spider Web Analysis: Eli Lilly
- 13.4.7. Spider Web Analysis: GlaxoSmithKline
- 13.4.8. Spider Web Analysis: Johnson & Johnson
- 13.4.9. Spider Web Analysis: Merck
- 13.4.10. Spider Web Analysis: Novartis
- 13.4.11. Spider Web Analysis: Pfizer
- 13.4.12. Spider Web Analysis: Roche
- 13.4.13. Spider Web Analysis: Sanofi
- 13.4.14. Spider Web Analysis: Takeda Pharmaceuticals
- 13.5. Most Active Players: Distribution by Number of Initiatives
14. MARKET IMPACT ANALYSIS: DRIVERS, RESTRAINTS, OPPORTUNITIES AND CHALLENGES
- 14.1. Chapter Overview
- 14.2. Market Drivers
- 14.3. Market Restraints
- 14.4. Market Opportunities
- 14.5. Market Challenges
- 14.6. Conclusion
15. GLOBAL DIGITAL BIOMARKER SOLUTIONS MARKET
- 15.1. Chapter Overview
- 15.2. Assumptions and Methodology
- 15.3. Global Digital Biomarker Solutions Market, Historical Trends (since 2018) and Future
Estimates (till 2035)
- 15.3.1. Scenario Analysis
- 15.3.1.1. Conversative Scenario
- 15.3.1.2. Optimistic Scenario
- 15.4. Key Market Segmentation
16. DIGITAL BIOMARKER SOLUTIONS MARKET, BY TYPE OF PRODUCT
- 16.1. Chapter Overview
- 16.2. Assumptions and Methodology
- 16.3. Digital Biomarker Solutions Market: Distribution by Type of Product, 2018, 2024 and 2035
- 16.3.1. Digital Biomarker Solutions Market for Software / Applications: Historical Trends (since 2018) and Future Estimates (till 2035)
- 16.3.2. Digital Biomarker Solutions Market for Wearables: Historical Trends Historical Trends (since 2018) and Future
Estimates (till 2035)
- 16.3.3. Digital Biomarker Solutions Market for Sensors: Historical Trends (since 2018) and Future
Estimates (till 2035)
- 16.3.4. Digital Biomarker Solutions Market for Gaming Solutions: Historical Trends (since 2018) and Future
Estimates (till 2035)
- 16.4. Data Triangulation and Validation
17. DIGITAL BIOMARKER SOLUTIONS MARKET, BY PURPOSE OF SOLUTION
- 17.1. Chapter Overview
- 17.2. Assumptions and Methodology
- 17.3. Digital Biomarker Solutions Market: Distribution by Purpose of Solution, 2018, 2024 and 2035
- 17.3.1. Digital Biomarker Solutions Market for Monitoring: Historical Trends (since 2018) and Future Estimates (till 2035)
- 17.3.2. Digital Biomarker Solutions Market for Diagnosis: Historical Trends (since 2018) and Future Estimates (till 2035)
- 17.3.3. Digital Biomarker Solutions Market for Early Detection: Historical Trends (since 2018) and Future Estimates (till 2035)
- 17.3.4. Digital Biomarker Solutions Market for Predictive Insights: Historical Trends (since 2018) and Future Estimates (till 2035)
- 17.4. Data Triangulation and Validation
18. DIGITAL BIOMARKER SOLUTIONS MARKET, BY TYPE OF BIOMARKER
- 18.1. Chapter Overview
- 18.2. Assumptions and Methodology
- 18.3. Digital Biomarker Solutions Market: Distribution by Type of Biomarker, 2018, 2024 and 2035
- 18.3.1. Digital Biomarker Solutions Market for Physiological Biomarkers: Historical Trends (since 2018) and Future Estimates (till 2035)
- 18.3.2. Digital Biomarker Solutions Market for Vocal Biomarkers: Historical Trends (since 2018) and Future Estimates (till 2035)
- 18.3.3. Digital Biomarker Solutions Market for Cognitive Biomarkers: Historical Trends (since 2018) and Future Estimates (till 2035)
- 18.3.4. Digital Biomarker Solutions Market for Idiosyncratic Biomarkers: Historical Trends (since 2018) and Future Estimates (till 2035)
- 18.3.5. Digital Biomarker Solutions Market for Other Biomarkers: Historical Trends (since 2018) and Future Estimates (till 2035)
- 18.4. Data Triangulation and Validation
19. DIGITAL BIOMARKER SOLUTIONS MARKET, BY THERAPEUTIC AREA
- 19.1. Chapter Overview
- 19.2. Assumptions and Methodology
- 19.3. Digital Biomarker Solutions Market: Distribution by Therapeutic Area, 2018, 2024 and 2035
- 19.3.1. Digital Biomarker Solutions Market for Neurological Disorders: Historical Trends (since 2018) and Future Estimates (till 2035)
- 19.3.2. Digital Biomarker Solutions Market for Mental Health Disorders: Historical Trends (since 2018) and Future Estimates (till 2035)
- 19.3.3. Digital Biomarker Solutions Market for Cardiovascular Disorders: Historical Trends (since 2018) and Future Estimates (till 2035)
- 19.3.4. Digital Biomarker Solutions Market for Infectious Diseases: Historical Trends (since 2018) and Future Estimates (till 2035)
- 19.3.5. Digital Biomarker Solutions Market for Respiratory Disorders: Historical Trends (since 2018) and Future Estimates (till 2035)
- 19.3.6. Digital Biomarker Solutions Market for Autoimmune Disorders: Historical Trends (since 2018) and Future Estimates (till 2035)
- 19.3.7. Digital Biomarker Solutions Market for Substance Abuse Disorders: Historical Trends (since 2018) and Future Estimates (till 2035)
- 19.3.8. Digital Biomarker Solutions Market for Other Disorders: Historical Trends (since 2018) and Future Estimates (till 2035)
- 19.4. Data Triangulation and Validation
20. DIGITAL BIOMARKER SOLUTIONS MARKET, BY BUSINESS MODEL
- 20.1. Chapter Overview
- 20.2. Assumptions and Methodology
- 20.3. Digital Biomarker Solutions Market: Distribution by Business Model, 2018, 2024 and 2035
- 20.3.1. Digital Biomarker Solutions Market for B2B Model: Historical Trends (since 2018) and Future Estimates (till 2035)
- 20.3.2. Digital Biomarker Solutions Market for B2C Model: Historical Trends (since 2018) and Future Estimates (till 2035)
- 20.4. Data Triangulation and Validation
21. DIGITAL BIOMARKER SOLUTIONS MARKET, BY KEY GEOGRAPHICAL REGIONS
- 21.1. Chapter Overview
- 21.2. Assumptions and Methodology
- 21.3. Digital Biomarker Solutions Market: Distribution by Key Geographical Regions, 2018, 2024 and 2035
- 21.3.1. Digital Biomarker Solutions Market in North America: Historical Trends (since 2018) and Future Estimates (till 2035)
- 21.3.2. Digital Biomarker Solutions Market in Europe: Historical Trends (since 2018) and Future Estimates (till 2035)
- 21.3.3. Digital Biomarker Solutions Market in Asia-Pacific: Historical Trends (since 2018) and Future Estimates (till 2035)
- 21.3.4. Digital Biomarker Solutions Market in Middle East and North Africa (MENA): Historical Trends (since 2018) and Future Estimates (till 2035)
- 21.3.5. Digital Biomarker Solutions Market in Rest of the World: Historical Trends (since 2018) and Future Estimates (till 2035)
- 21.4. Data Triangulation and Validation
22. CONCLUDING REMARKS
23. EXECUTIVE INSIGHTS
- 23.1. Chapter Overview
- 23.2. Acculi Labs
- 23.2.1. Company Snapshot
- 23.2.2. Interview Transcript: Company A, Chief Executive Officer
- 23.3. IXICO
- 23.3.1. Company Snapshot
- 23.3.2. Interview Transcript: Company B, Business Development Manager
- 23.4. Tilak Healthcare
- 23.4.1. Company Snapshot
- 23.4.2. Interview Transcript: Company C, Co-Founder and Chief Executive Officer
- 23.5. Vocalis Health
- 23.5.1. Company Snapshot
- 23.5.2. Interview Transcript: , Company D, Former Chief Commercial Officer
24. APPENDIX 1: TABULATED DATA
25. APPENDIX 2: LIST OF COMPANIES AND ORGANIZATIONS
List of Tables
- Table 5.1 Key Advantages and Limitations for Digital Biomarkers
- Table 6.1 Digital Biomarker Solutions: Overall Market Landscape
- Table 6.2 Digital Biomarker Solutions: Information on Status of Development, Approving Authority, Launch Data and Purpose of Biomarker Solutions
- Table 6.3 Digital Biomarker Solutions: Information on Target Indication, Target Therapeutic Area, Target Population and Target Segment
- Table 6.4 Digital Biomarker Solutions: Information on Solution Specifications, End-user, Clinical Validation and AI Integration
- Table 6.5 Digital Biomarker Solutions: Developers Landscape
- Table 8.1 Players Developing Digital Biomarker Solutions: List of Companies Profiled
- Table 8.2 BioSensics: Company Snapshot
- Table 8.3 BioSensics: Digital Biomarker Solutions Portfolio
- Table 8.4 BioSensics: Recent Developments and Future Outlook
- Table 8.5 Eyenuk: Company Snapshot
- Table 8.6 Eyenuk: Digital Biomarker Solutions Portfolio
- Table 8.7 Eyenuk: Recent Developments and Future Outlook
- Table 8.8 Quibim: Company Snapshot
- Table 8.9 Quibim: Digital Biomarker Solutions Portfolio
- Table 8.10 Quibim: Recent Developments and Future Outlook
- Table 8.11 Feel Therapeutics: Company Snapshot
- Table 8.12 Feel Therapeutics: Digital Biomarker Solutions Portfolio
- Table 8.13 Feel Therapeutics: Recent Developments and Future Outlook
- Table 8.14 AliveCor: Company Snapshot
- Table 8.15 AliveCor: Digital Biomarker Solutions Portfolio
- Table 8.16 AliveCor: Recent Developments and Future Outlook
- Table 8.17 BACtrack: Company Snapshot
- Table 8.18 BACtrack: Digital Biomarker Solutions Portfolio
- Table 8.19 Empatica: Company Snapshot
- Table 8.20 Empatica: Digital Biomarker Solutions Portfolio
- Table 8.21 Empatica: Recent Developments and Future Outlook
- Table 8.22 icometrix: Company Snapshot
- Table 8.23 icometrix: Digital Biomarker Solutions Portfolio
- Table 8.24 icometrix: Recent Developments and Future Outlook
- Table 8.25 Biogen: Company Snapshot
- Table 8.26 Biogen: Digital Biomarker Solutions Portfolio
- Table 8.27 Biogen: Recent Developments and Future Outlook
- Table 8.28 Acculi Labs: Company Snapshot
- Table 8.29 Acculi Labs: Digital Biomarker Solutions Portfolio
- Table 8.30 IXICO: Company Snapshot
- Table 8.31 IXICO: Digital Biomarker Solutions Portfolio
- Table 8.32 Kinsa: Company Snapshot
- Table 8.33 Kinsa: Digital Biomarker Solutions Portfolio
- Table 8.34 Progentec Diagnostics: Company Snapshot
- Table 8.35 Progentec Diagnostics: Digital Biomarker Solutions Portfolio
- Table 8.36 Vocalis Health: Company Snapshot
- Table 8.37 Vocalis Health: Digital Biomarker Solutions Portfolio
- Table 8.38 Kontigo Care: Company Snapshot
- Table 8.39 Kontigo Care: Digital Biomarker Solutions Portfolio
- Table 8.40 Koneksa Health: Company Snapshot
- Table 8.41 Koneksa Health: Digital Biomarker Solutions Portfolio
- Table 8.42 ActiGraph: Company Snapshot
- Table 8.43 ActiGraph: Digital Biomarker Solutions Portfolio
- Table 8.44 BioSerenity: Company Snapshot
- Table 8.45 BioSerenity: Digital Biomarker Solutions Portfolio
- Table 8.46 ATCOR: Company Snapshot
- Table 8.47 ATCOR: Digital Biomarker Solutions Portfolio
- Table 8.48 iMediSync: Company Snapshot
- Table 8.49 iMediSync: Digital Biomarker Solutions Portfolio
- Table 9.1 Digital Biomarker Solutions: List of Partnerships and Collaborations
- Table 10.1 Digital Biomarker Solutions: List of Funding and Investments
- Table 11.1 Digital Biomarker Solutions: List of Global Events
- Table 11.2 Global Events Analysis: Information on Name of Speakers and their Designations
- Table 12.1 Patent Analysis: Top CPC Sections
- Table 12.2 Patent Analysis: Top CPC Symbols
- Table 12.3 Patent Analysis: List of Top CPC Codes
- Table 12.4 Patent Analysis: Summary of Benchmarking Analysis
- Table 12.5 Patent Analysis: Categorization based on Weighted Valuation Scores
- Table 12.6 Patent Portfolio: List of Leading Patents (by Highest Relative Valuation)
- Table 23.1 Acculi Labs: Company Snapshot
- Table 23.3 IXICO: Company Snapshot
- Table 23.3 Tilak Healthcare: Company Snapshot
- Table 23.4 Vocalis Health: Company Snapshot
- Table 24.1 Digital Biomarker Solutions: Distribution by Type of Product
- Table 24.2 Digital Biomarker Solutions: Distribution by Type of Digital Biomarker Solution
- Table 24.3 Digital Biomarker Solutions: Distribution by Type of Biomarker
- Table 24.4 Digital Biomarker Solutions: Distribution by Status of Development
- Table 24.5 Digital Biomarker Solutions: Distribution by Type of Biomarker and Status of Development
- Table 24.6 Digital Biomarker Solutions: Distribution by Purpose of Digital Biomarker Solution
- Table 24.7 Digital Biomarker Solutions: Distribution by Target Therapeutic Area
- Table 24.8 Digital Biomarker Solutions: Distribution by Type of Biomarker and Target Therapeutic Area
- Table 24.9 Digital Biomarker Solutions: Distribution by Target Population
- Table 24.10 Digital Biomarker Solutions: Distribution by End-user
- Table 24.11 Digital Biomarker Solutions: Distribution by Availability of Clinical Validation
- Table 24.12 Digital Biomarker Solutions: Distribution of Clinically Validated Solutions by Target Therapeutic Area
- Table 24.13 Digital Biomarker Solutions: Distribution by Availability of AI Integration
- Table 24.14 Digital Biomarker Solution Developers: Distribution by Year of Establishment
- Table 24.15 Digital Biomarker Solution Developers: Distribution by Company Size
- Table 24.16 Digital Biomarker Solution Developers: Distribution by Location of Headquarters (Region)
- Table 24.17 Digital Biomarker Solution Developers: Distribution by Location of Headquarters (Country)
- Table 24.18 Digital Biomarker Solution Developers: Distribution by Company Size and Location of Headquarters
- Table 24.19 Most Active Players: Distribution by Number of Digital Biomarker Solutions Developed
- Table 24.20 Partnerships and Collaborations: Cumulative Year-Wise Trend
- Table 24.21 Partnerships and Collaborations: Distribution by Type of Partnership
- Table 24.22 Partnerships and Collaborations: Distribution by Year and Type of Partnership
- Table 24.23 Partnerships and Collaborations: Distribution by Type of Biomarker
- Table 24.24 Partnerships and Collaborations: Distribution by Type of Partnership and Type of Biomarker
- Table 24.25 Partnerships and Collaborations: Distribution by Therapeutic Area
- Table 24.26 Partnerships and Collaborations: Distribution by Type of Partnership and Therapeutic Area
- Table 24.37 Partnerships and Collaborations: Distribution by Type of Partner
- Table 24.28 Most Active Players: Distribution by Number of Partnerships
- Table 24.29 Partnerships and Collaborations: Intercontinental and Intracontinental Deals
- Table 24.20 Partnerships and Collaborations: International and Local Deals
- Table 24.31 Funding and Investments: Cumulative Year-wise Trend of Funding Instances
- Table 24.32 Funding and Investments: Cumulative Year-wise Trend of Amount Invested, Pre-2018-2024
- Table 24.33 Funding and Investment: Distribution by Type of Funding
- Table 24.34 Funding and Investments: Distribution of Amount Invested by Type of Funding (USD Million)
- Table 24.35 Funding and Investments: Distribution by Type of Biomarker
- Table 24.36 Funding and Investments: Distribution by Therapeutic Area
- Table 24.37 Leading Investors: Distribution by Number of Funding Instances
- Table 24.38 Most Active Players: Distribution by Number of Funding Instances
- Table 24.39 Most Active Players: Distribution by Amount Raised
- Table 24.40 Funding and Investments: Distribution by Geography (Region)
- Table 24.41 Funding and Investments: Distribution by Geography (Country)
- Table 24.42 Global Events Analysis: Cumulative Year-wise Trend
- Table 24.43 Global Events Analysis: Distribution by Type of Event
- Table 24.44 Global Events Analysis: Distribution by Year and Type of Event
- Table 24.45 Global Events Analysis: Distribution by Event Platform
- Table 24.46 Global Events Analysis: Distribution by Location of Event (Region)
- Table 24.47 Global Events Analysis: Distribution by Location of Event (Country)
- Table 24.48 Most Active Event Organizers: Distribution by Number of Events
- Table 24.49 Most Active Players: Distribution by Number of Events
- Table 24.50 Most Active Speakers: Distribution by Number of Events
- Table 24.51 Distribution by Designation / Qualification of Speakers
- Table 24.52 Patent Analysis: Distribution by Type of Patent
- Table 24.53 Patent Analysis: Cumulative Year-wise Trend by Patent Application Year
- Table 24.54 Patent Analysis: Cumulative Year-wise Trend by Patent Publication Year, since 2019
- Table 24.55 Patent Analysis: Distribution by Type of Patent and Patent Publication Year, since 2019
- Table 24.56 Patent Analysis: Distribution by Patent Jurisdiction (Region)
- Table 24.57 Patent Analysis: Distribution by Patent Jurisdiction (Country)
- Table 24.58 Patent Analysis: Distribution by Patent Publication Year and Type of Applicant
- Table 24.59 Leading Players: Distribution by Number of Patents
- Table 24.60 Leading Patent Assignees: Distribution by Number of Patents
- Table 24.61 Patent Analysis: Distribution by Patent Age
- Table 24.62 Digital Biomarker Solutions: Patent Valuation
- Table 24.63 Global Digital Biomarker Solutions Market, Historical Trends (since 2018) and Forecasted Estimates (till 2035) (USD Million)
- Table 24.64 Global Digital Biomarker Solutions Market, Forecasted Estimates (till 2035): Conservative Scenario (USD Million)
- Table 24.65 Global Digital Biomarker Solutions Market, Forecasted Estimates (till 2035): Optimistic Scenario (USD Million)
- Table 24.66 Digital Biomarker Solutions Market for Software / Applications, Historical Trends (since 2018) (USD Million)
- Table 24.67 Digital Biomarker Solutions Market: Distribution by Type of Product, 2018, 2024 and 2035
- Table 24.68 Digital Biomarker Solutions Market for Wearables, Historical Trends (since 2018) (USD Million)
- Table 24.69 Digital Biomarker Solutions Market for Software / Applications, Forecasted Estimates (till 2035) (USD Million)
- Table 24.70 Digital Biomarker Solutions Market for Sensors, Historical Trends (since 2018) (USD Million)
- Table 24.71 Digital Biomarker Solutions Market for Wearables, Forecasted Estimates (till 2035) (USD Million)
- Table 24.72 Digital Biomarker Solutions Market for Gaming Solutions, Historical Trends (since 2018) (USD Million)
- Table 24.73 Digital Biomarker Solutions Market for Gaming Solutions, Forecasted Estimates (till 2035), Conservative, Base and Optimistic Scenario (USD Million)
- Table 24.74 Biomarker Solutions Market: Distribution by Purpose of Solution, 2018, 2024 and 2035
- Table 24.75 Biomarker Solutions Market for Monitoring, Historical Trends (since 2018) (USD Million)
- Table 24.76 Digital Biomarker Solutions Market for Monitoring, Forecasted Estimates (till 2035), Conservative, Base and Optimistic Scenario (USD Million)
- Table 24.77 Biomarker Solutions Market for Diagnosis, Historical Trends (since 2018) (USD Million)
- Table 24.78 Biomarker Solutions Market for Diagnosis, Forecasted Estimates (till 2035), Conservative, Base and Optimistic Scenario (USD Million)
- Table 24.79 Digital Biomarker Solutions Market for Early Detection, Historical Trends (since 2018) (USD Million)
- Table 24.80 Digital Biomarker Solutions Market for Early Detection, Forecasted Estimates (till 2035), Conservative, Base and Optimistic Scenario (USD Million)
- Table 24.81 Biomarker Solutions Market for Predictive Insights, Historical Trends (since 2018) (USD Million)
- Table 24.82 Digital Biomarker Solutions Market for Predictive Insights, Forecasted Estimates (till 2035), Conservative, Base and Optimistic Scenario (USD Million)
- Table 24.83 Digital Biomarker Solutions Market: Distribution by Type of Biomarker, 2018, 2024 and 2035
- Table 24.84 Digital Biomarker Solutions Market for Physiological Biomarkers, Historical Trends (since 2018) (USD Million)
- Table 24.85 Digital Biomarker Solutions Market for Physiological Biomarkers, Forecasted Estimates (till 2035), Conservative, Base and Optimistic Scenario (USD Million)
- Table 24.86 Digital Biomarker Solutions Market for Vocal Biomarkers, Historical Trends (since 2018) (USD Million)
- Table 24.87 Digital Biomarker Solutions Market for Vocal Biomarkers, Forecasted Estimates (till 2035), Conservative, Base and Optimistic Scenario (USD Million)
- Table 24.88 Digital Biomarker Solutions Market for Cognitive Biomarkers, Historical Trends (since 2018) (USD Million)
- Table 24.89 Digital Biomarker Solutions Market for Cognitive Biomarkers, Forecasted Estimates (till 2035), Conservative, Base and Optimistic Scenario (USD Million)
- Table 24.90 Digital Biomarker Solutions Market for Idiosyncratic Biomarkers, Historical Trends (since 2018) (USD Million)
- Table 24.91 Digital Biomarker Solutions Market for Idiosyncratic Biomarkers, Forecasted Estimates (till 2035), Conservative, Base and Optimistic Scenario (USD Million)
- Table 24.92 Digital Biomarker Solutions Market for Other Biomarkers, Historical Trends (since 2018) (USD Million)
- Table 24.93 Digital Biomarker Solutions Market for Other Biomarkers, Forecasted Estimates (till 2035), Conservative, Base and Optimistic Scenario (USD Million)
- Table 24.94 Digital Biomarker Solutions Market: Distribution by Therapeutic Area, 2018, 2024 and 2035 (USD Million)
- Table 24.95 Digital Biomarker Solutions Market for Neurological Disorders, Historical Trends (since 2018) (USD Million)
- Table 24.96 Digital Biomarker Solutions Market for Neurological Disorders, Forecasted Estimates (till 2035) Conservative, Base and Optimistic Scenario (USD Million)
- Table 24.97 Digital Biomarker Solutions Market for Mental Health Disorders, Historical Trends (since 2018) (USD Million)
- Table 24.98 Digital Biomarker Solutions Market for Mental Health Disorders, Forecasted Estimates (till 2035), Conservative, Base and Optimistic Scenario (USD Million)
- Table 24.99 Digital Biomarker Solutions Market for Cardiovascular Disorders, Historical Trends (since 2018) (USD Million)
- Table 24.100 Digital Biomarker Solutions Market for Cardiovascular Disorders, Forecasted Estimates (till 2035), Conservative, Base and Optimistic Scenario (USD Million)
- Table 24.101 Digital Biomarker Solutions Market for Infectious Diseases, Historical Trends (since 2018) (USD Million)
- Table 24.102 Digital Biomarker Solutions Market for Infectious Diseases, Forecasted Estimates (till 2035), Conservative, Base and Optimistic Scenario (USD Million)
- Table 24.103 Digital Biomarker Solutions Market for Respiratory Disorders, Historical Trends (since 2018) (USD Million)
- Table 24.104 Digital Biomarker Solutions Market for Respiratory Disorders, Historical Trends (since 2018) (USD Million)
- Table 24.105 Digital Biomarker Solutions Market for Autoimmune Disorders, Historical Trends (since 2018) (USD Million)
- Table 24.106 Digital Biomarker Solutions Market for Autoimmune Disorders, Forecasted Estimates (till 2035), Conservative, Base and Optimistic Scenario (USD Million)
- Table 24.107 Digital Biomarker Solutions Market for Substance Abuse Disorders, Historical Trends (since 2018) (USD Million)
- Table 24.108 Digital Biomarker Solutions Market for Substance Abuse Disorders, Forecasted Estimates (till 2035), Conservative, Base and Optimistic Scenario (USD Million)
- Table 24.109 Digital Biomarker Solutions Market for Other Disorders, Historical Trends (since 2018) (USD Million)
- Table 24.110 Digital Biomarker Solutions Market for Other Disorders, Forecasted Estimates (till 2035), Conservative, Base and Optimistic Scenario (USD Million)
- Table 24.111 Digital Biomarker Solutions Market: Distribution by Business Model, 2018, 2024 and 2035
- Table 24.112 Digital Biomarker Solutions Market for B2B Model, Historical Trends (since 2018) (USD Million)
- Table 24.113 Digital Biomarker Solutions Market for B2B Model, Forecasted Estimates (till 2035), Conservative, Base and Optimistic Scenario (USD Million)
- Table 24.114 Digital Biomarker Solutions Market for B2C Model, Historical Trends (since 2018) (USD Million)
- Table 24.115 Digital Biomarker Solutions Market for B2C Model, Forecasted Estimates (till 2035), Conservative, Base and Optimistic Scenario (USD Million)
- Table 24.116 Digital Biomarker Solutions Market: Distribution by Key Geographical Regions, 2018, 2024 and 2035
- Table 24.117 Digital Biomarker Solutions Market in North America, Historical Trends (since 2018) (USD Million)
- Table 24.118 Digital Biomarker Solutions Market in North America, Forecasted Estimates (till 2035), Conservative, Base and Optimistic Scenario (USD Million)
- Table 24.119 Digital Biomarker Solutions Market in Europe, Historical Trends (since 2018) (USD Million)
- Table 24.120 Digital Biomarker Solutions Market in Europe, Forecasted Estimates (till 2035), Conservative, Base and Optimistic Scenario (USD Million)
- Table 24.121 Digital Biomarker Solutions Market in Asia-Pacific, Historical Trends (since 2018) (USD Million)
- Table 24.122 Digital Biomarker Solutions Market in Asia-Pacific, Forecasted Estimates (till 2035), Conservative, Base and Optimistic Scenario (USD Million)
- Table 24.123 Digital Biomarker Solutions Market in Middle East and North Africa, Historical Trends (since 2018) (USD Million)
- Table 24.124 Digital Biomarker Solutions Market in Middle East and North Africa, Forecasted Estimates (till 2035), Conservative, Base and Optimistic Scenario (USD Million)
- Table 24.125 Digital Biomarker Solutions Market in Rest of the World, Historical Trends (since 2018) (USD Million)
- Table 24.126 Digital Biomarker Solutions Market in Rest of the World, Forecasted Estimates (till 2035), Conservative, Base and Optimistic Scenario (USD Million)
List of Figures
- Figure 2.1 Research Methodology: Project Methodology
- Figure 2.2 Research Methodology: Forecast Methodology
- Figure 2.3 Research Methodology: Robust Quality Control
- Figure 2.4 Research Methodology: Key Market Segmentation
- Figure 3.1 Lessons Learnt from Past Recessions
- Figure 4.1 Executive Summary: Digital Biomarker Solutions Market Landscape
- Figure 4.2 Executive Summary: Digital Biomarker Solution Developer Landscape
- Figure 4.3 Executive Summary: Partnerships and Collaborations
- Figure 4.4 Executive Summary: Funding and Investments
- Figure 4.5 Executive Summary: Global Events Analysis
- Figure 4.6 Executive Summary: Patent Analysis
- Figure 4.7 Executive Summary: Digital Biomarker Solutions Market Forecast and Opportunity Analysis
- Figure 5.1 Types of Digital Biomarkers
- Figure 5.2 Types of Biomarkers / Signals Captured by Digital Biomarker Solutions
- Figure 5.3 Emerging Focus Areas: Google News
- Figure 6.1 Digital Biomarker Solutions: Distribution by Type of Product
- Figure 6.2 Digital Biomarker Solutions: Distribution by Type of Digital Biomarker Solution
- Figure 6.3 Digital Biomarker Solutions: Distribution by Type of Biomarker
- Figure 6.4 Digital Biomarker Solutions: Distribution by Status of Development
- Figure 6.5 Digital Biomarker Solutions: Distribution by Type of Biomarker and Status of Development
- Figure 6.6 Digital Biomarker Solutions: Distribution by Purpose of Digital Biomarker Solution
- Figure 6.7 Digital Biomarker Solutions: Distribution by Target Therapeutic Area
- Figure 6.8 Digital Biomarker Solutions: Distribution by Type of Biomarker and Target Therapeutic Area
- Figure 6.9 Digital Biomarker Solutions: Distribution by Target Population
- Figure 6.10 Digital Biomarker Solutions: Distribution by End-user
- Figure 6.11 Digital Biomarker Solutions: Distribution by Availability of Clinical Validation
- Figure 6.12 Digital Biomarker Solutions: Distribution of Clinically Validated Solutions by Target Therapeutic Area
- Figure 6.13 Digital Biomarker Solutions: Distribution by Availability of AI Integration
- Figure 6.14 Digital Biomarker Solution Developers: Distribution by Year of Establishment
- Figure 6.15 Digital Biomarker Solution Developers: Distribution by Company Size
- Figure 6.16 Digital Biomarker Solution Developers: Distribution by Location of Headquarters (Region)
- Figure 6.17 Digital Biomarker Solution Developers: Distribution by Location of Headquarters (Country)
- Figure 6.18 Digital Biomarker Solution Developers: Distribution by Company Size and Location of Headquarters
- Figure 6.19 Most Active Players: Distribution by Number of Digital Biomarker Solutions Developed
- Figure 7.1 Product Competitiveness Analysis: Digital Biomarker Solutions Developed by Players based in North America
- Figure 7.2 Product Competitiveness Analysis: Digital Biomarker Solutions Developed by Players based in Europe
- Figure 7.3 Product Competitiveness Analysis: Digital Biomarker Solutions Developed by Players based in Asia-Pacific and Rest of the World
- Figure 9.1 Partnerships and Collaborations: Cumulative Year-Wise Trend
- Figure 9.2 Partnerships and Collaborations: Distribution by Type of Partnership
- Figure 9.3 Partnerships and Collaborations: Distribution by Year and Type of Partnership
- Figure 9.4 Partnerships and Collaborations: Distribution by Type of Biomarker
- Figure 9.5 Partnerships and Collaborations: Distribution by Type of Partnership and Type of Biomarker
- Figure 9.6 Partnerships and Collaborations: Distribution by Therapeutic Area
- Figure 9.7 Partnerships and Collaborations: Distribution by Type of Partnership and Therapeutic Area
- Figure 9.8 Partnerships and Collaborations: Distribution by Type of Partner
- Figure 9.9 Most Active Players: Distribution by Number of Partnerships
- Figure 9.10 Partnerships and Collaborations: Intercontinental and Intracontinental Deals
- Figure 9.11 Partnerships and Collaborations: International and Local Deals
- Figure 10.1 Funding and Investments: Cumulative Year-wise Trend of Funding Instances
- Figure 10.2 Funding and Investments: Cumulative Year-wise Trend of Amount Invested
- Figure 10.3 Funding and Investment: Distribution by Type of Funding
- Figure 10.4 Funding and Investments: Distribution of Amount Invested by Type of Funding (USD Million)
- Figure 10.5 Funding and Investments: Distribution by Type of Biomarker
- Figure 10.6 Funding and Investments: Distribution by Therapeutic Area
- Figure 10.7 Leading Investors: Distribution by Number of Funding Instances
- Figure 10.8 Most Active Players: Distribution by Number of Funding Instances
- Figure 10.9 Most Active Players: Distribution by Amount Raised
- Figure 10.10 Funding and Investments: Distribution by Geography (Region)
- Figure 10.11 Funding and Investments: Distribution by Geography (Country)
- Figure 11.1 Global Events Analysis: Cumulative Year-wise Trend
- Figure 11.2 Global Events Analysis: Distribution by Type of Event
- Figure 11.3 Global Events Analysis: Distribution by Year and Type of Event
- Figure 11.4 Global Events Analysis: Distribution by Event Platform
- Figure 11.5 Global Events Analysis: Distribution by Location of Event (Region)
- Figure 11.6 Global Events Analysis: Distribution by Location of Event (Country)
- Figure 11.7 Word Cloud Analysis: Key Focus Areas
- Figure 11.8 Most Active Event Organizers: Distribution by Number of Events
- Figure 11.9 Most Active Players: Distribution by Number of Events
- Figure 11.10 Most Active Speakers: Distribution by Number of Events
- Figure 11.11 Distribution by Designation / Qualification of Speakers
- Figure 12.1 Patent Analysis: Distribution by Type of Patent
- Figure 12.2 Patent Analysis: Cumulative Year-wise Trend by Patent Application Year, Pre-since 2018
- Figure 12.3 Patent Analysis: Cumulative Year-wise Trend by Patent Publication Year, since 2019
- Figure 12.4 Patent Analysis: Distribution by Type of Patent and Patent Publication Year, since 2019
- Figure 12.5 Patent Analysis: Distribution by Patent Jurisdiction (Region)
- Figure 12.6 Patent Analysis: Distribution by Patent Jurisdiction (Country)
- Figure 12.7 Patent Analysis: Distribution by CPC Symbols
- Figure 12.8 Patent Analysis: Distribution by Patent Publication Year and Type of Applicant
- Figure 12.9 Leading Players: Distribution by Number of Patents
- Figure 12.10 Leading Patent Assignees: Distribution by Number of Patents
- Figure 12.11 Patent Benchmarking: Distribution of Patent Characteristics (CPC Codes) by Leading Players
- Figure 12.12 Patent Benchmarking: Distribution of Leading Players by Patent Characteristics (Top CPC Codes)
- Figure 12.13 Patent Analysis: Distribution by Patent Age
- Figure 12.14 Digital Biomarker Solutions: Patent Valuation
- Figure 13.1 Big Pharma Initiatives Related to Digital Biomarker Solutions: Distribution by Type of Initiative
- Figure 13.2 Big Pharma Initiatives Related to Digital Biomarker Solutions: Heat Map Analysis
- Figure 13.3 Spider Web Analysis: AbbVie
- Figure 13.4 Spider Web Analysis: Amgen
- Figure 13.5 Spider Web Analysis: AstraZeneca
- Figure 13.6 Spider Web Analysis: Bayer
- Figure 13.7 Spider Web Analysis: Bristol Myers Squibb
- Figure 13.8 Spider Web Analysis: Eli Lilly
- Figure 13.9 Spider Web Analysis: GlaxoSmithKline
- Figure 13.10 Spider Web Analysis: Johnson & Johnson
- Figure 13.11 Spider Web Analysis: Merck
- Figure 13.12 Spider Web Analysis: Novartis
- Figure 13.13 Spider Web Analysis: Pfizer
- Figure 13.14 Spider Web Analysis: Roche
- Figure 13.15 Spider Web Analysis: Sanofi
- Figure 13.16. Spider Web Analysis: Takeda Pharmaceuticals
- Figure 13.17 Most Active Players: Distribution by Number of Initiatives
- Figure 15.1 Global Digital Biomarker Solutions Market, Historical Trends (since 2018) and Forecasted Estimates (till 2035) (USD Million)
- Figure 15.2 Global Digital Biomarker Solutions Market, Forecasted Estimates (till 2035): Conservative Scenario (USD Million)
- Figure 15.3 Global Digital Biomarker Solutions Market, Forecasted Estimates (till 2035): Optimistic Scenario (USD Million)
- Figure 16.1 Digital Biomarker Solutions Market: Distribution by Type of Product, 2018, 2024 and 2035
- Figure 16.2 Digital Biomarker Solutions Market for Software / Applications: Historical Trends (since 2018) and Forecasted Estimates (till 2035) (USD Million)
- Figure 16.3 Digital Biomarker Solutions Market for Wearables: Historical Trends (since 2018) and Forecasted Estimates (till 2035) (USD Million)
- Figure 16.4 Digital Biomarker Solutions Market for Sensors: Historical Trends (since 2018) and Forecasted Estimates (till 2035) (USD Million)
- Figure 16.5 Digital Biomarker Solutions Market for Gaming Solutions: Historical Trends (since 2018) and Forecasted Estimates (till 2035) (USD Million)
- Figure 17.1 Digital Biomarker Solutions Market: Distribution by Purpose of Solution, 2018, 2024 and 2035
- Figure 17.2 Digital Biomarker Solutions Market for Monitoring: Historical Trends (since 2018) and Forecasted Estimates (till 2035) (USD Million)
- Figure 17.3 Digital Biomarker Solutions Market for Diagnosis: Historical Trends (since 2018) and Forecasted Estimates (till 2035) (USD Million)
- Figure 17.4 Digital Biomarker Solutions Market for Early Detection: Historical Trends (since 2018) and Forecasted Estimates (till 2035) (USD Million)
- Figure 17.5 Digital Biomarker Solutions Market for Predictive Insights: Historical Trends (since 2018) and Forecasted Estimates (till 2035) (USD Million)
- Figure 18.1 Digital Biomarker Solutions Market: Distribution by Type of Biomarker, 2018, 2024 and 2035
- Figure 18.2 Digital Biomarker Solutions Market for Physiological Biomarkers: Historical Trends (since 2018) and Forecasted Estimates (till 2035) (USD Million)
- Figure 18.3 Digital Biomarker Solutions Market for Vocal Biomarkers: Historical Trends (since 2018) and Forecasted Estimates (till 2035) (USD Million)
- Figure 18.4 Digital Biomarker Solutions Market for Cognitive Biomarkers: Historical Trends (since 2018) and Forecasted Estimates (till 2035) (USD Million)
- Figure 18.5 Digital Biomarker Solutions Market for Idiosyncratic Biomarkers: Historical Trends (since 2018) and Forecasted Estimates (till 2035) (USD Million)
- Figure 18.6 Digital Biomarker Solutions Market for Other Biomarkers: Historical Trends (since 2018) and Forecasted Estimates (till 2035) (USD Million)
- Figure 19.1 Digital Biomarker Solutions Market: Distribution by Therapeutic Area, 2018, 2024 and 2035
- Figure 19.2 Digital Biomarker Solutions Market for Neurological Disorders: Historical Trends (since 2018) and Forecasted Estimates (till 2035) (USD Million)
- Figure 19.3 Digital Biomarker Solutions Market for Mental Health Disorders: Historical Trends (since 2018) and Forecasted Estimates (till 2035) (USD Million)
- Figure 19.4 Digital Biomarker Solutions Market for Cardiovascular Disorders: Historical Trends (since 2018) and Forecasted Estimates (till 2035) (USD Million)
- Figure 19.5 Digital Biomarker Solutions Market for Infectious Diseases: Historical Trends (since 2018) and Forecasted Estimates (till 2035) (USD Million)
- Figure 19.6 Digital Biomarker Solutions Market for Respiratory Disorders: Historical Trends (since 2018) and Forecasted Estimates (till 2035) (USD Million)
- Figure 19.7 Digital Biomarker Solutions Market for Autoimmune Disorders: Historical Trends (since 2018) and Forecasted Estimates (till 2035) (USD Million)
- Figure 19.8 Digital Biomarker Solutions Market for Substance Abuse Disorders: Historical Trends (since 2018) and Forecasted Estimates (till 2035) (USD Million)
- Figure 19.9 Digital Biomarker Solutions Market for Other Disorders: Historical Trends (since 2018) and Forecasted Estimates (till 2035) (USD Million)
- Figure 20.1 Digital Biomarker Solutions Market: Distribution by Business Model, 2018, 2024 and 2035
- Figure 20.2 Digital Biomarker Solutions Market for B2B Model: Historical Trends (since 2018) and Forecasted Estimates (till 2035) (USD Million)
- Figure 20.3 Digital Biomarker Solutions Market for B2C Model: Historical Trends (since 2018) and Forecasted Estimates (till 2035) (USD Million)
- Figure 21.1 Digital Biomarker Solutions Market: Distribution by Key Geographical Regions, 2018, 2024 and 2035
- Figure 21.2 Digital Biomarker Solutions Market in North America: Historical Trends (since 2018) and Forecasted Estimates (till 2035) (USD Million)
- Figure 21.3 Digital Biomarker Solutions Market in Europe: Historical Trends (since 2018) and Forecasted Estimates (till 2035) (USD Million)
- Figure 21.4 Digital Biomarker Solutions Market in Asia-Pacific: Historical Trends (since 2018) and Forecasted Estimates (till 2035) (USD Million)
- Figure 21.5 Digital Biomarker Solutions Market in Middle East and North Africa: Historical Trends (since 2018) and Forecasted Estimates (till 2035) (USD Million)
- Figure 21.6 Digital Biomarker Solutions Market in Rest of the World: Historical Trends (since 2018) and Forecasted Estimates (till 2035) (USD Million)
- Figure 22.1 Concluding Remarks: Digital Biomarker Solutions Market Landscape
- Figure 22.2 Concluding Remarks: Digital Biomarker Solution Developers Landscape
- Figure 22.3 Concluding Remarks: Partnerships and Collaborations
- Figure 22.4 Concluding Remarks:
Funding and Investment
- Figure 22.5 Concluding Remarks: Global Events Analysis
- Figure 22.6 Concluding Remarks: Patent Analysis
- Figure 22.7 Concluding Remarks: Market Sizing and Opportunity Analysis (I/II)
- Figure 22.8 Concluding Remarks: Market Sizing and Opportunity Analysis (II/II)
 數位生物標記市場,按類型、按應用、按最終用途、按國家和地區 - 2025 年至 2032 年全球行業分析、市場規模、市場佔有率和預測
 數位生物標記市場機會、成長動力、產業趨勢分析及 2025 - 2034 年預測精神病數位生物標記市場規模、佔有率、趨勢分析報告(按類型、臨床實踐、最終用途、地區、細分預測),2025 年至 2030 年
 數位生物標記市場:按類型、治療領域、應用分類 - 2025-2030 年全球預測
 數位生物標記市場規模、佔有率和成長分析:按類型、臨床實踐、最終用途、地區 - 行業預測,2024-2031 年
 精神科數位生物標記市場 - 按類型、臨床實踐、最終用戶、地區和競爭細分的全球行業規模、佔有率、趨勢、機會和預測,2019-2029F數位生物標記市場規模、佔有率、趨勢分析報告:按類型、按臨床業務、按治療領域、按最終用途、按地區、按細分市場、預測,2024-2030 年數位生物標記市場 - 2024-2034 年全球產業分析、規模、佔有率、成長、趨勢和預測全球數位生物標記市場:展望與預測(2024-2029)
 數位生物標記市場 – 2023 年至 2028 年預測