


 |
市場調查報告書
商品編碼
1682710
細胞毒性藥及HPAPI製造市場:各產品類型,不同企業規模,各產業規模,各分子類型,高活性完成劑型類別,各主要地區:2035年前的產業趨勢與全球預測Cytotoxic Drugs & HPAPI Manufacturing Market by Type of Product, Company Size, Scale of Operation, Type of Molecule, Type of Highly Potent Finished Dosage Form, and Key Geographies: Industry Trends and Global Forecasts, Till 2035 |
||||||
全球細胞毒性藥物和 HPAPI 製造市場規模預計將從目前的 117 億美元增長到 2035 年的 399 億美元,在預測期內以 11.6% 的複合年增長率增長。
隨著臨床藥理學和腫瘤學研究的進步以及對標靶治療的需求不斷增加,高藥理活性成分 (HPAPI) 和細胞毒藥物已成為全球研究人員和製藥商關注的重點。值得注意的是,全球45%的藥物都具有高活性。然而,HPAPI 的製造是一個複雜的過程,而這個過程帶來了各種挑戰。最大的挑戰是防止製造過程中的交叉污染,其次是保護環境、工人和供應鏈上的每個人。選擇正確的遏制和保護策略,包括遏制設備、程序和 PPE,同樣重要。通常,使用 HPAPI 需要在安全處理領域進行持續投資,而對全球指導和先進技術專長的需求也增加了該領域的挑戰。因此,藥品開發商正在積極將其製造業務外包。
意識到合約製造市場的巨大潛力和積極的成長前景,大多數領先的製藥公司都在考慮投資擴建和升級其現有的生產設施。許多CMO正在日本、中國、印度和巴西等新興國家投資新工廠,以利用這些地區較低的製造成本、更廉價、更熟練的勞動力和監管條件。在抗癌藥物產業整體成長、近期技術進步以及外包趨勢日益增強的推動下,預計未來十年市場將實現穩定成長。
目前,有超過 140 家公司聲稱擁有提供不同規模的高效能化合物合約製造服務所需的專業知識。目前的市場格局高度分散,各主要地區都有新進業者和現有企業。利害關係人利用他們的專業知識為大量高效能化合物提供合約製造服務。約70%的服務供應商具備HPAPI分析測試能力。合作活動的增加顯示了人們對該領域的興趣日益濃厚。事實上,HPAPI 和細胞毒藥物的生產合作是近代史上最常見的合作之一。為了滿足對高效能化合物日益增長的需求,CMO 正在謹慎投資以擴大其設施和產能。這一趨勢在美國、瑞士和英國最為明顯。
HPAPI 的全球合約製造能力分佈在不同地區,目前 80% 的產能位於大型企業擁有的工廠。抗體藥物偶聯物是最受歡迎的一類高活性化合物之一,目前有 30 多家公司聲稱提供此類生物製藥的合約製造和偶聯服務。高效能藥物開發商可能會將製造業務外包,預計服務收入將以每年 11.6% 的速度成長。
本報告提供全球細胞毒性藥及HPAPI製造市場相關調查,提供市場概要,以及各產品類型,不同企業規模,各產業規模,各分子類型,高活性完成劑型類別,各主要地區的趨勢,及加入此市場的主要企業簡介等資訊。
目錄
第1章 序文
第2章 摘要整理
第3章 簡介
第4章 市場形勢
第5章 企業競爭力分析
第6章 企業簡介:北美的細胞毒性藥及HPAPI製造商
- 章概要
- AbbVie
- Cambrex
- Catalent
- Pfizer CentreOne
- Piramal Pharma Solutions
第7章 企業簡介:歐洲的細胞毒性藥及HPAPI製造商
- 章概要
- Abzena
- Aenova
- CARBOGEN AMCIS
- Hovione
- Lonza
第8章 企業簡介:亞太地區及其他地區的細胞毒性藥及HPAPI製造商
- 章概要
- Intas Pharmaceuticals
- Scinopharm
- STA Pharmaceutical(a WuXi AppTec company)
- Syngene
- Teva API
第9章 夥伴關係和合作
第10章 最近的擴張
第11章 容量分析
第12章 地區能力評估分析
第13章 是製造還是購買意思決策架構
第14章 市場規模的評估機會分析
第15章 SWOT分析
第16章 案例:抗體藥物複合體的受託製造
第17章 結論
第18章 執行洞察
第19章 附錄1:表格形式的資料
第20章 附錄2:企業·團體一覽
CYTOTOXIC DRUGS AND HPAPI MANUFACTURING MARKET: OVERVIEW
As per Roots Analysis, the global cytotoxic drugs and HPAPI manufacturing market is estimated to grow from USD 11.7 billion in the current year to USD 39.9 billion by 2035, at a CAGR of 11.6% during the forecast period, till 2035.
The market opportunity for cell and gene therapy supply chain software has been distributed across the following segments:
Type of Product
- HPAPIs
- Highly Potent Finished Dosage Forms
Scale of Operation
- Preclinical
- Clinical
- Commercial
Type of Molecule
- Small Molecules
- Biologics
Type of Highly Potent Finished Dosage Form
- Injectables
- Oral Solids
- Creams
- Others
Key Geographical Regions
- North America (US, Canada and Mexico)
- Europe (UK, Italy, Germany, France, Spain, and Rest of Europe)
- Asia-Pacific (China, India, and Rest of Asia-Pacific)
- Rest of the World
CYTOTOXIC DRUGS AND HPAPI MANUFACTURING MARKET: GROWTH AND TRENDS
With advances in clinical pharmacology and oncology research, and the increasing demand for targeted therapies, high potency active pharmaceutical ingredients (HPAPIs) and cytotoxic drugs have become the key focus of researchers and drug manufacturers across the world. It is worth highlighting that 45% of the drugs globally are highly potent leading to specialized HPAPI production. However, manufacturing HPAPIs is a complex process and therefore, there are various challenges associated with the process. The biggest challenge is to inhibit cross-contamination during manufacturing followed by the protection of the environment, workers and everyone across the supply chain. It is equally important to choose the correct containment and protective strategy, inclusive of containment equipment, procedures and PPE. HPAPIs handling generally requires continued investment in the area of safe handling, the need for global guidance and advance technical expertise adding to the challenges in the domain. Therefore, drug developers are actively outsourcing their manufacturing operations.
Understanding the vast potential and positive growth outlook of the contract manufacturing market, the majority of big pharma players are looking to make investments to expand and / or upgrade their current manufacturing facilities. A number of CMOs are investing in new facilities in developing countries such as Japan, China, India and Brazil to avail the benefits of lower manufacturing costs, cheap and skilled labor and supportive regulatory landscapes in these areas. Driven by the overall growth of the anti-cancer therapeutics industry, recent technological advancements and the growing trend of outsourcing, the market is anticipated to witness steady growth in the coming decade.
CYTOTOXIC DRUGS AND HPAPI MANUFACTURING MARKET: KEY INSIGHTS
The report delves into the current state of the cytotoxic drugs & HPAPI manufacturing market and identifies potential growth opportunities within the industry. Some key findings from the report include:
- Presently, more than 140 players claim to have the required expertise to offer contract manufacturing services for highly potent compounds, across different scales of operation.
- The current market landscape is highly fragmented, featuring the presence of both new entrants and established players across key geographical regions.
- Leveraging their expertise, stakeholders are offering contract manufacturing services for a myriad of highly potent compounds; around 70% of the service providers possess analytical testing capability for HPAPIs.
- The growing interest in this domain is evident from the rise in partnership activity; in fact, the maximum number of collaborations related to HPAPI and cytotoxic drug manufacturing were inked in the recent past.
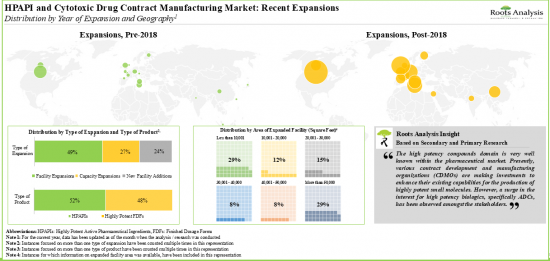
- In order to meet the rising demand for high potency compounds, CMOs have made elaborate investments to expand their facilities and capacities; this trend is most pronounced in the US, Switzerland and the UK.
- The installed global contract manufacturing capacity for HPAPIs is well distributed across different geographies; 80% of the present capacity is installed in facilities owned by very large players.
- Antibody Drug Conjugates are one of the most popular classes of highly potent compounds; more than 30 players currently claim to offer contract manufacturing / conjugation services for such biopharmaceuticals.
- It is anticipated that the highly potent drug developers are likely to outsource their manufacturing operations, enabling the service based revenues to grow at an annualized rate of 11.6%.
CYTOTOXIC DRUGS & HPAPI MANUFACTURING MARKET: KEY SEGMENTS
HPAPI Segment Occupies the Largest Share of the Cytotoxic Drugs and HPAPI Manufacturing Market
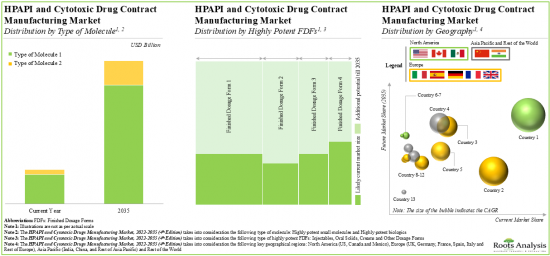
Based on the type of product, the market is segmented into HPAPI and highly potent finished dosage forms. At present, HPAPI segment holds the maximum share of the cytotoxic drugs & HPAPI manufacturing market. This trend is unlikely to change in the near future.
Very Large Players are Likely to Dominate the Cytotoxic Drugs & HPAPI Manufacturing Market During the Forecast Period
Based on the company size, the market is segmented into small, mid-sized, large and very large companies. At present, very large companies hold the maximum share of the cytotoxic drugs & HPAPI manufacturing market. This trend is likely to remain the same in the coming decade.
By Scale of Operation, Commercial Scale is Likely to Dominate the Cytotoxic Drugs and HPAPI Manufacturing Market
Based on scales of operation, the market is segmented into preclinical, clinical and commercial scale. It is worth highlighting that, at present, commercial scale holds a larger share of the cytotoxic drugs and HPAPI manufacturing market. This trend is likely to remain the same in the forthcoming years.
Biologics is the Fastest Growing Segment of the Cytotoxic Drugs and HPAPI Manufacturing Market During the Forecast Period
Based on the type of molecule, the market is segmented into small molecules and biologics. It is worth highlighting that, at present, small molecules dominate the cytotoxic drugs and HPAPI manufacturing market. This is primarily due to the fact the CMOs have invested and expanded their capabilities for highly potent small molecules. It is important to note the demand for highly potent drugs is on the rise therefore the market for biologics is expected to grow at a faster pace in the coming decade.
Oral FDFs are Likely to Dominate the Cytotoxic Drugs and HPAPI Manufacturing Market During the Forecast Period
Based on the type of highly potent finished dosage forms, the market is segmented into injectables, oral solids, creams and other FDFs. It is worth highlighting that, at present, oral FDFs capture the highest share of the cytotoxic drugs and HPAPI manufacturing market. This trend is likely to remain the same in the coming decade owing to the benefits offered by oral formulations, such as cost-efficiency for manufacturers, comfort and ease of use for patients.
Europe Accounts for the Largest Share of the Market
Based on key geographical regions, the market is segmented into North America, Europe, Asia-Pacific and Rest of the world. The majority of the share is expected to be captured by players based in Europe. This is due to the fact that there are well-established players in this region with considerable installed capacities and capabilities. It is worth highlighting that, over the years, the market in Asia-Pacific is expected to grow at a higher CAGR.
Example Players in the Cytotoxic Drugs & HPAPI Manufacturing Market
- AbbVie
- Cambrex
- Catalent
- Pfizer CentreOne
- Piramal Pharma Solutions
- Abzena
- Aenova
- CARBOGEN AMCIS
- Hovione
- Lonza
- Intas Pharmaceuticals
- Scinopharm
- STA Pharmaceutical (a WuXi AppTec company)
- Syngene
- Teva API
Primary Research Overview
The opinions and insights presented in this study were influenced by discussions conducted with multiple stakeholders. The research report features detailed transcripts of interviews held with the following industry stakeholders:
- Owner and Director, HPAPI Project Service
- Vice President and Chief Operating Officer and Business Director, BSP Pharmaceuticals
- ILC Dover, Vice President, Pharma/Bio Technical Support
- Ex-Group Product Manager and Ex-Director-Business Development, Catalent
- Business Development Director, CordenPharma
- Managing Director, ProJect Pharmaceutics
- Ex-Business Head, Formulations and Finished Products, Alphora Research
- Ex-Site Head, Piramal Healthcare
- Ex-Senior Manager, Business Development, Helsinn
- Marketing and Sales Manager, Pharma, Cerbios-Pharma
- Ex-Business Development Technician, Idifarma
CYTOTOXIC DRUGS AND HPAPI MANUFACTURING MARKET: RESEARCH COVERAGE
- Market Sizing and Opportunity Analysis: The report features an in-depth analysis of the cytotoxic drugs and HPAPI manufacturing market, focusing on key market segments, including [A] type of product, [B] company size, [C] scale of operation, [D] type of molecule, [E] type of highly potent finished dosage form and [F] key geographical regions.
- Market Landscape: A comprehensive evaluation of companies involved in the contract manufacturing of HPAPI and cytotoxic drugs, considering various parameters, such as [A] year of establishment, [B] company size (in terms of number of employees), [C] location of headquarters, [D] location of manufacturing facility, [E] area of manufacturing facility, [F] scale of operation, [G] type of product manufactured, [H] type of highly potent finished dosage form, [G] Occupational Exposure Limit, [H] type of molecule manufactured, [H] type of primary packaging system, [I] regulatory certifications / accreditations received and [J] type of service(s) offered.
- Company Competitiveness Analysis: A comprehensive competitive analysis of HPAPI and cytotoxic drug contract manufacturers, examining factors, such as [A] supplier strength and [B] service strength.
- Company Profiles: In-depth profiles of key industry players offering contract manufacturing services for HPAPI and cytotoxic drugs, focusing on [A] company overviews, [B] HPAPI and cytotoxic drug-related service portfolio, [C] dedicated facilities, [D] recent developments and [E] an informed future outlook.
- Partnerships and Collaborations: An analysis of partnerships established in this sector based on relevant parameters, such as [A] year of partnership, [B] type of partnership, [C] scale of operation, [D] type of product, [E] most active players (in terms of number of deals inked) and [F] regional distribution of partnership activity that have been undertaken in cytotoxic drugs and HPAPI manufacturing market.
- Recent Expansions: An examination of the different expansion efforts made by the HPAPI and cytotoxic drug contract manufacturers in this field to enhance their manufacturing capabilities. This analysis considers various factors, including the [A] year of expansion, [B] type of expansion, [C] company size, [D] location of headquarters, [E] scale of operation, [F] type of product, [G] location of expanded facility, [H] area of expanded facility, [I] amount invested in expansions, [J] most active players (in terms of number of recent expansions) and [K] geographical distribution.
- Capacity Analysis: Estimation of global HPAPI manufacturing capacity, derived from data provided by various stakeholders in the public domain. This analysis emphasizes the distribution of the available capacity on the basis of [A] company size (small, mid-sized and large), [B] scale of operation (preclinical, clinical and commercial) and [C] key geographical regions (North America, Europe and Asia-Pacific).
- Regional Capability Assessment Analysis: A regional capability assessment framework that compares the HPAPI and cytotoxic drug manufacturing capabilities across key geographies, based on several parameters, such as [A] the number of HPAPI and cytotoxic drug contract manufacturers, [B] number of HPAPI and cytotoxic drug manufacturing facilities, [C] number of facility expansions and [D] installed HPAPI capacity in that particular geographical region.
- SWOT Analysis: A SWOT analysis, focusing on key drivers and challenges that are likely to impact the industry's evolution.
- Case Study: A case study on companies offering manufacturing services for antibody drug conjugate (ADCs). The chapter also highlights the key components of ADCs and the key challenges associated with the manufacturing of these products. Further, the chapter presents a list of players that provide contract manufacturing services for ADCs.
KEY QUESTIONS ANSWERED IN THIS REPORT
- How many companies are currently engaged in this market?
- Which are the leading companies in this market?
- What kind of partnership models are commonly adopted by industry stakeholders?
- What are the factors that are likely to influence the evolution of this market?
- What is the current and future market size?
- What is the CAGR of this market?
- How is the current and future market opportunity likely to be distributed across key market segments?
REASONS TO BUY THIS REPORT
- The report provides a comprehensive market analysis, offering detailed revenue projections of the overall market and its specific sub-segments. This information is valuable to both established market leaders and emerging entrants.
- Stakeholders can leverage the report to gain a deeper understanding of the competitive dynamics within the market. By analyzing the competitive landscape, businesses can make informed decisions to optimize their market positioning and develop effective go-to-market strategies.
- The report offers stakeholders a comprehensive overview of the market, including key drivers, barriers, opportunities, and challenges. This information empowers stakeholders to stay abreast of market trends and make data-driven decisions to capitalize on growth prospects.
ADDITIONAL BENEFITS
- Complimentary PPT Insights Packs
- Complimentary Excel Data Packs for all Analytical Modules in the Report
- 10% Free Content Customization
- Detailed Report Walkthrough Session with Research Team
- Free Updated report if the report is 6-12 months old or older
TABLE OF CONTENTS
1. PREFACE
- 1.1. Scope of the Report
- 1.2. Market Segmentation
- 1.3. Research Methodology
- 1.4. Key Questions Answered
- 1.5. Chapter Outlines
2. EXECUTIVE SUMMARY
3. INTRODUCTION
- 3.1. Chapter Overview
- 3.2. High Potency Active Pharmaceutical Ingredients
- 3.2.1. Classification by Potency
- 3.2.1.1. Classification of HPAPIs
- 3.2.2. Different Types of HPAPIs
- 3.2.2.1. Antibody Drug Conjugates
- 3.2.2.2. Cytotoxic Drugs
- 3.2.2.3. Peptides
- 3.2.2.4. Hormones
- 3.2.2.5. Beta-Lactam Compounds
- 3.2.2.6. Prostaglandins
- 3.2.2.7. Cytostatics
- 3.2.2.8. Steroids
- 3.2.3. Considerations for Handling HPAPIs
- 3.2.4. Contract Manufacturing of HPAPIs and Cytotoxic Drugs
- 3.2.4.1. Key Considerations While Selecting a Contract Manufacturing Partner
- 3.2.5. Regulatory Considerations for Manufacturing HPAPIs
- 3.2.6. Concluding Remarks
- 3.2.1. Classification by Potency
4. MARKET LANDSCAPE
- 4.1. Chapter Overview
- 4.2. HPAPI and Cytotoxic Drug Contract Manufacturers: Overall Market Landscape
- 4.2.1. Analysis by Year of Establishment
- 4.2.2. Analysis by Company Size
- 4.2.3. Analysis by Location of Headquarters
- 4.2.4. Analysis by Company Size and Location of Headquarters
- 4.2.5. Analysis by Location of Manufacturing Facility
- 4.2.6. Analysis by Area of Manufacturing Facility
- 4.2.7. Analysis by Scale of Operation
- 4.2.8. Analysis by Type of Product Manufactured
- 4.2.9. Analysis by Location of Manufacturing Facility and Type of Product Manufactured
- 4.2.10. Analysis by Type of Finished Dosage Form
- 4.2.11. Analysis by Occupational Exposure Limit (OEL)
- 4.2.12. Analysis by Type of Molecule Manufactured
- 4.2.13. Analysis by Type of Primary Packaging System
- 4.2.14. Analysis by Regulatory Certification / Accreditation Received
- 4.2.15. Analysis by Type of Service(s) Offered
5. COMPANY COMPETITIVENESS ANALYSIS
- 5.1. Chapter Overview
- 5.2. Assumptions and Key Parameters
- 5.3. Methodology
- 5.4. HPAPI Contract Manufacturers: Company Competitiveness Analysis
- 5.4.1. HPAPI Contract Manufacturers based in North America
- 5.4.2. HPAPI Contract Manufacturers based in Europe
- 5.4.3. HPAPI Contract Manufacturers based in Asia-Pacific and Rest of the World
- 5.5. Highly Potent FDF Contract Manufacturers: Company Competitiveness Analysis
- 5.5.1. Highly Potent FDF Contract Manufacturers based in North America
- 5.5.2. Highly Potent FDF Contract Manufacturers based in Europe
- 5.5.3. Highly Potent FDF Contract Manufacturers based in Asia-Pacific and Rest of the World
- 5.6. HPAPI and Highly Potent FDF Contract Manufacturers: Company Competitiveness Analysis
- 5.6.1. HPAPI and Highly Potent FDF Contract Manufacturers based in North America
- 5.6.2. HPAPI and Highly Potent FDF Contract Manufacturers based in Europe
- 5.6.3. HPAPI and Highly Potent FDF Contract Manufacturers based in Asia-Pacific and Rest of the World
6. COMPANY PROFILES: HPAPI AND CYTOTOXIC DRUG MANUFACTURERS IN NORTH AMERICA
- 6.1. Chapter Overview
- 6.2. AbbVie
- 6.2.1. Company Overview
- 6.2.2. HPAPI and Cytotoxic Drug Manufacturing Focused Service Offerings
- 6.2.3. Dedicated HPAPI and Cytotoxic Drug Manufacturing Facilities
- 6.2.4. Recent Developments and Future Outlook
- 6.3. Cambrex
- 6.3.1. Company Overview
- 6.3.2. HPAPI and Cytotoxic Drug Manufacturing Focused Service Offerings
- 6.3.3. Dedicated HPAPI and Cytotoxic Drug Manufacturing Facilities
- 6.3.4. Recent Developments and Future Outlook
- 6.4. Catalent
- 6.4.1. Company Overview
- 6.4.2. HPAPI and Cytotoxic Drug Manufacturing Focused Service Offerings
- 6.4.3. Dedicated HPAPI and Cytotoxic Drug Manufacturing Facilities
- 6.4.4. Recent Developments and Future Outlook
- 6.5. Pfizer CentreOne
- 6.5.1. Company Overview
- 6.5.2. HPAPI and Cytotoxic Drug Manufacturing Focused Service Offerings
- 6.5.3. Dedicated HPAPI and Cytotoxic Drug Manufacturing Facilities
- 6.5.4. Recent Developments and Future Outlook
- 6.6. Piramal Pharma Solutions
- 6.6.1. Company Overview
- 6.6.2. HPAPI and Cytotoxic Drugs Manufacturing Focused Service Offerings
- 6.6.3. Dedicated HPAPI and Cytotoxic Drug Manufacturing Facilities
- 6.6.4. Recent Developments and Future Outlook
7. COMPANY PROFILES: HPAPI AND CYTOTOXIC DRUG MANUFACTURERS IN EUROPE
- 7.1. Chapter Overview
- 7.2. Abzena
- 7.2.1. Company Overview
- 7.2.2. HPAPI and Cytotoxic Drug Manufacturing Focused Service Offerings
- 7.2.3. Dedicated HPAPI and Cytotoxic Drug Manufacturing Facilities
- 7.2.4. Recent Developments and Future Outlook
- 7.3. Aenova
- 7.3.1. Company Overview
- 7.3.2. HPAPI and Cytotoxic Drug Manufacturing Focused Service Offerings
- 7.3.3. Dedicated HPAPI and Cytotoxic Drug Manufacturing Facilities
- 7.3.4. Recent Developments and Future Outlook
- 7.4. CARBOGEN AMCIS
- 7.4.1. Company Overview
- 7.4.2. HPAPI and Cytotoxic Drug Manufacturing Focused Service Offerings
- 7.4.3. Dedicated HPAPI and Cytotoxic Drug Manufacturing Facilities
- 7.4.4. Recent Developments and Future Outlook
- 7.5. Hovione
- 7.5.1. Company Overview
- 7.5.2. HPAPI and Cytotoxic Drug Manufacturing Focused Service Offerings
- 7.5.3. Dedicated HPAPI and Cytotoxic Drug Manufacturing Facilities
- 7.5.4. Recent Developments and Future Outlook
- 7.6. Lonza
- 7.6.1. Company Overview
- 7.6.2. HPAPI and Cytotoxic Drugs Manufacturing Focused Service Offerings
- 7.6.3. Dedicated HPAPI and Cytotoxic Drug Manufacturing Facilities
- 7.6.4. Recent Developments and Future Outlook
8. COMPANY PROFILES: HPAPI AND CYTOTOXIC DRUG MANUFACTURERS IN ASIA-PACIFIC AND REST OF THE WORLD
- 8.1. Chapter Overview
- 8.2. Intas Pharmaceuticals
- 8.2.1. Company Overview
- 8.2.2. HPAPI and Cytotoxic Drug Manufacturing Focused Service Offerings
- 8.2.3. Dedicated HPAPI and Cytotoxic Drug Manufacturing Facilities
- 8.2.4. Recent Developments and Future Outlook
- 8.3. Scinopharm
- 8.3.1. Company Overview
- 8.3.2. HPAPI and Cytotoxic Drugs Manufacturing Focused Service Offerings
- 8.3.3. Dedicated HPAPI and Cytotoxic Drug Manufacturing Facilities
- 8.3.4. Recent Developments and Future Outlook
- 8.4. STA Pharmaceutical (a WuXi AppTec company)
- 8.4.1. Company Overview
- 8.4.2. HPAPI and Cytotoxic Drug Manufacturing Focused Service Offerings
- 8.4.3. Dedicated HPAPI and Cytotoxic Drug Manufacturing Facilities
- 8.4.4. Recent Developments and Future Outlook
- 8.5. Syngene
- 8.5.1. Company Overview
- 8.5.2. HPAPI and Cytotoxic Drug Manufacturing Focused Service Offerings
- 8.5.3. Dedicated HPAPI and Cytotoxic Drug Manufacturing Facilities
- 8.5.4. Recent Developments and Future Outlook
- 8.6. Teva API
- 8.6.1. Company Overview
- 8.6.2. HPAPI and Cytotoxic Drug Manufacturing Focused Service Offerings
- 8.6.3. Dedicated HPAPI and Cytotoxic Drug Manufacturing Facilities
- 8.6.4. Recent Developments and Future Outlook
9. PARTNERSHIPS AND COLLABORATIONS
- 9.1. Chapter Overview
- 9.2. Partnership Models
- 9.3. HPAPI and Cytotoxic Drugs: List of Partnerships and Collaborations
- 9.3.1. Analysis by Year of Partnership
- 9.3.2. Analysis by Type of Partnership
- 9.3.3. Analysis by Year and Type of Partnership
- 9.3.4. Analysis by Scale of Operation
- 9.3.5. Analysis by Type of Product
- 9.3.6. Analysis by Type of Partnership and Type of Product
- 9.3.7. Analysis of Amount Invested Via Acquisitions
- 9.3.8. Analysis by Type of Partner
- 9.3.9. Most Active Players: Analysis by Number of Partnerships
- 9.3.10. Analysis by Geography
- 9.3.10.1. Intracontinental and Intercontinental Deals
- 9.3.10.2. International and Local Deals
10. RECENT EXPANSIONS
- 10.1. Chapter Overview
- 10.2. HPAPI and Cytotoxic Drugs: List of Recent Expansions
- 10.2.1. Analysis by Year of Expansion
- 10.2.2. Analysis by Type of Expansion
- 10.2.3. Analysis by Year and Type of Expansion
- 10.2.4. Analysis by Company Size and Location of Headquarters
- 10.2.5. Analysis by Scale of Operation
- 10.2.6. Analysis by Type of Expansion and Scale of Operation
- 10.2.7. Analysis by Type of Product
- 10.2.8. Analysis by Type of Expansion and Type of Product
- 10.2.9. Analysis by Location of Expanded Facility
- 10.2.10. Analysis by Type of Expansion and Location of Expanded Facility
- 10.2.11. Analysis by Expanded Facility Area
- 10.2.12. Analysis by Amount Invested on Expansions
- 10.2.13. Most Active Players: Analysis by Number of Recent Expansions
- 10.2.14. Geographical Analysis
- 10.2.14.1. Analysis by Continent
- 10.2.14.2. Analysis by Country
11. CAPACITY ANALYSIS
- 11.1. Chapter Overview
- 11.2. Key Assumptions and Methodology
- 11.3. HPAPI Contract Manufacturers: Global Installed Capacity
- 11.3.1. Analysis by Range of Installed Capacity
- 11.3.2. Analysis by Company Size
- 11.3.3. Analysis by Scale of Operation
- 11.3.4. Analysis by Location of Manufacturing Facility
- 11.3.4.1. Analysis of HPAPI Contract Manufacturing Capacity Installed in North America
- 11.3.4.2. Analysis of HPAPI Contract Manufacturing Capacity Installed in Europe
- 11.3.4.3. Analysis of HPAPI Contract Manufacturing Capacity Installed in Asia-Pacific and Rest of the World
- 11.3.5. Concluding Remarks
12. REGIONAL CAPABILITY ASSESSMENT ANALYSIS
- 12.1. Chapter Overview
- 12.2. Assumptions and Key Parameters
- 12.3. HPAPI and Cytotoxic Drug Manufacturing Capabilities in North America
- 12.4. HPAPI and Cytotoxic Drug Manufacturing Capabilities in Europe
- 12.5. HPAPI and Cytotoxic Drug Manufacturing Capabilities in Asia-Pacific
- 12.6. HPAPI and Cytotoxic Drug Manufacturing Capabilities in Rest of the World
- 12.7. Concluding Remarks
13. MAKE VERSUS BUY DECISION MAKING FRAMEWORK
- 13.1. Chapter Overview
- 13.2. Assumptions and Key Parameters
- 13.2.1. Scenario 1
- 13.2.2. Scenario 2
- 13.2.3. Scenario 3
- 13.2.4. Scenario 4
- 13.3. Concluding Remarks
14. MARKET SIZING AND OPPORTUNITY ANALYSIS
- 14.1. Chapter Overview
- 14.2. Forecast Methodology and Key Assumptions
- 14.3. Global HPAPI and Cytotoxic Drug Contract Manufacturing Market, till 2035
- 14.3.1. HPAPI and Cytotoxic Drug Contract Manufacturing Market: Analysis by Type of Product, till 2035
- 14.3.2. HPAPI and Cytotoxic Drugs Contract Manufacturing Market: Analysis by Company Size, till 2035
- 14.3.3. HPAPI and Cytotoxic Drugs Contract Manufacturing Market: Analysis by Scale of Operation, till 2035
- 14.3.4. HPAPI and Cytotoxic Drugs Contract Manufacturing Market: Analysis by Type of Molecule, till 2035
- 14.3.5. HPAPI and Cytotoxic Drugs Contract Manufacturing Market: Analysis by Type of Highly Potent Finished Dosage Forms, till 2035
- 14.3.6. HPAPI and Cytotoxic Drugs Contract Manufacturing Market: Analysis by Geography, till 2035
- 14.3.7. HPAPI and Cytotoxic Drugs Contract Manufacturing Market in North America, till 2035
- 14.3.7.1. HPAPI and Cytotoxic Drugs Contract Manufacturing Market in the US, till 2035
- 14.3.7.2. HPAPI and Cytotoxic Drug Contract Manufacturing Market in Canada, till 2035
- 14.3.7.3. HPAPI and Cytotoxic Drug Contract Manufacturing Market in Mexico, till 2035
- 14.3.8. HPAPI and Cytotoxic Drugs Contract Manufacturing Market in Europe, till 2035
- 14.3.8.1. HPAPI and Cytotoxic Drugs Contract Manufacturing Market in the UK, till 2035
- 14.3.8.2. HPAPI and Cytotoxic Drugs Contract Manufacturing Market in Italy, till 2035
- 14.3.8.3. HPAPI and Cytotoxic Drugs Contract Manufacturing Market in Germany, till 2035
- 14.3.8.4. HPAPI and Cytotoxic Drugs Contract Manufacturing Market in France, till 2035
- 14.3.8.5. HPAPI and Cytotoxic Drugs Contract Manufacturing Market in Spain, till 2035
- 14.3.8.6. HPAPI and Cytotoxic Drugs Contract Manufacturing Market in Rest of Europe, till 2035
- 14.3.9. HPAPI and Cytotoxic Drugs Contract Manufacturing Market in Asia-Pacific, till 2035
- 14.3.9.1. HPAPI and Cytotoxic Drug Contract Manufacturing Market in China, till 2035
- 14.3.9.2. HPAPI and Cytotoxic Drugs Contract Manufacturing Market in India, till 2035
- 14.3.9.3. HPAPI and Cytotoxic Drugs Contract Manufacturing Market in Rest of Asia-Pacific, till 2035
- 14.3.10. HPAPI and Cytotoxic Drugs Contract Manufacturing Market in the Rest of the World, till 2035
15. SWOT ANALYSIS
- 15.1. Chapter Overview
- 15.2. Strengths
- 15.3. Weaknesses
- 15.4. Opportunities
- 15.5. Threats
- 15.6. Concluding Remarks
16. CASE-IN-POINT: CONTRACT MANUFACTURING OF ANTIBODY DRUG CONJUGATES
- 16.1. Chapter Overview
- 16.2. Key Components of Antibody Drug Conjugates
- 16.2.1. Antibody
- 16.2.2. Cytotoxin
- 16.2.3. Linker
- 16.3. Overview of ADC Manufacturing
- 16.3.1. Key Process Steps
- 16.3.2. Challenges Associated with ADC Manufacturing
- 16.3.3. Growing Trend of Outsourcing in ADC Manufacturing
- 16.4. Challenges Associated with Supply Chain and Method Transfer
- 16.4.1. Growing Demand for One-Stop-Shops and Integrated Service Providers
- 16.5. Key Considerations for Selecting a CMO Partner
- 16.6. ADC Contract Manufacturing Service Providers: Overall Market Landscape
- 16.6.1. Analysis by Year of Establishment
- 16.6.2. Analysis by Company Size
- 16.6.3. Analysis by Location of Headquarters
- 16.6.4. Analysis by Service(s) Offered
- 16.7. Concluding Remarks
17. CONCLUDING REMARKS
18. EXECUTIVE INSIGHTS
- 18.1. Chapter Overview
- 18.2. BSP Pharmaceuticals
- 18.2.1. Company Snapshot
- 18.2.2. Interview Transcript: Vice President and Chief Operating Officer and Business Director
- 18.3. Catalent
- 18.3.1. Company Snapshot
- 18.3.2. Interview Transcript: Ex-Group Product Manager and Ex-Director-Business Development
- 18.3.3. Interview Transcript: Business Development Associate
- 18.4. CordenPharma
- 18.4.1. Company Snapshot
- 18.4.2. Interview Transcript: Business Development Director
- 18.5. ProJect Pharmaceutics
- 18.5.1. Company Snapshot
- 18.5.2. Interview Transcript: Managing Director
- 18.6. Alphora Research
- 18.6.1. Company Snapshot
- 18.6.2. Interview Transcript: Ex-Business Head, Formulations and Finished Products
- 18.7. Piramal Healthcare
- 18.7.1. Company Snapshot
- 18.7.2. Interview Transcript: Ex-Site Head, Grangemouth
- 18.8. Helsinn
- 18.8.1. Company Snapshot
- 18.8.2. Interview Transcript: Ex-Senior Manager, Business Development
- 18.9. Cerbios-Pharma
- 18.9.1. Company Snapshot
- 18.9.2. Interview Transcript: Marketing and Sales Manager, Pharma
- 18.10. Idifarma
- 18.10.1. Company Snapshot
- 18.10.2. Interview Transcript: Ex-Business Development Technician
19. APPENDIX 1: TABULATED DATA
20. APPENDIX 2: LIST OF COMPANIES AND ORGANIZATIONS
List of Tables
- Table 3.1 APIs and HPAPIs: Occupational Exposure Limit
- Table 3.2 Occupational Exposure Limit and Occupational Exposure Band System: International Safety Systems
- Table 3.3 SafeBridge: Categorization System
- Table 3.4 Merck: Categorization System
- Table 3.5 Lonza: Categorization System
- Table 3.6 Ampac Fine Chemicals: Categorization System
- Table 3.7 Helsinn: Categorization System
- Table 3.8 Alkermes: Categorization System
- Table 4.1 HPAPI and Cytotoxic Drugs Contract Manufacturers: List of Service Providers
- Table 4.2 HPAPI and Cytotoxic Drugs Contract Manufacturers: Information on Scale of Operation, Type of Product Manufactured and Type of Highly Potent Finished Dosage Forms (FDFs)
- Table 4.3 HPAPI and Cytotoxic Drugs Contract Manufacturers: Information on Occupational Exposure Limit, and Type of Molecule Manufactured
- Table 4.4 HPAPI and Cytotoxic Drugs Contract Manufacturers: Information on Type of Primary Packaging and Type of Regulatory Certification / Accreditation
- Table 4.5 HPAPI and Cytotoxic Drugs Contract Manufacturers: Information on Type of Services Offered
- Table 6.1 Leading HPAPI and Cytotoxic Drug Manufacturers in North America
- Table 6.2 AbbVie: Company Snapshot
- Table 6.3 AbbVie: HPAPI and Cytotoxic Drugs Manufacturing Focused Service Offerings
- Table 6.4 AbbVie: Dedicated HPAPI and Cytotoxic Drug Manufacturing Facilities
- Table 6.5 AbbVie: Recent Developments and Future Outlook
- Table 6.6 Cambrex: Company Snapshot
- Table 6.7 Cambrex: HPAPI and Cytotoxic Drugs Manufacturing Focused Service Offerings
- Table 6.8 Cambrex: Dedicated HPAPI and Cytotoxic Drug Manufacturing Facilities
- Table 6.9 Cambrex: Recent Developments and Future Outlook
- Table 6.10 Catalent: Company Snapshot
- Table 6.11 Catalent: HPAPI and Cytotoxic Drugs Manufacturing Focused Service Offerings
- Table 6.12 Catalent: Dedicated HPAPI and Cytotoxic Drug Manufacturing Facilities
- Table 6.13 Catalent: Recent Developments and Future Outlook
- Table 6.14 Pfizer CentreOne: Company Snapshot
- Table 6.15 Pfizer CentreOne: HPAPI and Cytotoxic Drugs Manufacturing Focused Service Offerings
- Table 6.16 Pfizer CentreOne: Dedicated HPAPI and Cytotoxic Drug Manufacturing Facilities
- Table 6.17 Pfizer CentreOne: Recent Developments and Future Outlook
- Table 6.18 Piramal Pharma Solutions: Company Snapshot
- Table 6.19 Piramal Pharma Solutions: HPAPI and Cytotoxic Drugs Manufacturing Focused Service Offerings
- Table 6.20 Piramal Pharma Solutions: Dedicated HPAPI and Cytotoxic Drug Manufacturing Facilities
- Table 6.21 Piramal Pharma Solutions: Recent Developments and Future Outlook
- Table 7.1 Leading HPAPIs and Cytotoxic Drug Manufacturers in Europe
- Table 7.2 Abzena: Company Snapshot
- Table 7.3 Abzena: HPAPI and Cytotoxic Drugs Manufacturing Focused Service Offerings
- Table 7.4 Abzena: Dedicated HPAPI and Cytotoxic Drug Manufacturing Facilities
- Table 7.5 Abzena: Recent Developments and Future Outlook
- Table 7.6 Aenova: Company Snapshot
- Table 7.7 Aenova: HPAPI and Cytotoxic Drugs Manufacturing Focused Service Offerings
- Table 7.8 Aenova: Dedicated HPAPI and Cytotoxic Drug Manufacturing Facilities
- Table 7.9 Aenova: Recent Developments and Future Outlook
- Table 7.10 CARBOGEN AMCIS: Company Snapshot
- Table 7.11 CARBOGEN AMCIS: HPAPI and Cytotoxic Drugs Manufacturing Focused Service Offerings
- Table 7.12 CARBOGEN AMCIS: Dedicated HPAPI and Cytotoxic Drug Manufacturing Facilities
- Table 7.13 CARBOGEN AMCIS: Recent Developments and Future Outlook
- Table 7.14 Hovione: Company Snapshot
- Table 7.15 Hovione: HPAPI and Cytotoxic Drugs Manufacturing Focused Service Offerings
- Table 7.16 Hovione: Dedicated HPAPI and Cytotoxic Drug Manufacturing Facilities
- Table 7.17 Hovione: Recent Developments and Future Outlook
- Table 7.18 Lonza: Company Snapshot
- Table 7.19 Lonza: HPAPI and Cytotoxic Drugs Manufacturing Focused Service Offerings
- Table 7.20 Lonza: Dedicated HPAPI and Cytotoxic Drug Manufacturing Facilities
- Table 7.21 Lonza: Recent Developments and Future Outlook
- Table 8.1 Leading HPAPI and Cytotoxic Drug Manufacturers in Asia-Pacific
- Table 8.2 Intas Pharmaceuticals: Company Snapshot
- Table 8.3 Intas Pharmaceuticals: HPAPI and Cytotoxic Drugs Manufacturing Focused Service Offerings
- Table 8.4 Intas Pharmaceuticals: Dedicated HPAPI and Cytotoxic Drug Manufacturing Facilities
- Table 8.5 Intas Pharmaceuticals: Recent Developments and Future Outlook
- Table 8.6 Scinopharm: Company Snapshot
- Table 8.7 Scinopharm: HPAPI and Cytotoxic Drugs Manufacturing Focused Service Offerings
- Table 8.8 Scinopharm: Dedicated HPAPI and Cytotoxic Drug Manufacturing Facilities
- Table 8.9 Scinopharm: Recent Developments and Future Outlook
- Table 8.10 STA Pharmaceutical (a WuXi AppTec company): Company Snapshot
- Table 8.11 STA Pharmaceutical (a WuXi AppTec company): HPAPI and Cytotoxic Drugs Manufacturing Focused Service Offerings
- Table 8.12 STA Pharmaceutical (a WuXi AppTec company): Dedicated HPAPI and Cytotoxic Drug Manufacturing Facilities
- Table 8.13 STA Pharmaceutical (a WuXi AppTec company): Recent Developments and Future Outlook
- Table 8.14 Syngene: Company Snapshot
- Table 8.15 Syngene: HPAPI and Cytotoxic Drugs Manufacturing Focused Service Offerings
- Table 8.16 Syngene: Dedicated HPAPI and Cytotoxic Drug Manufacturing Facilities
- Table 8.17 Syngene: Recent Developments and Future Outlook
- Table 8.18 Teva API: Company Snapshot
- Table 8.19 Teva API: HPAPI and Cytotoxic Drugs Manufacturing Focused Service Offerings
- Table 8.20 Teva API: Dedicated HPAPI and Cytotoxic Drug Manufacturing Facilities
- Table 8.21 Teva API: Recent Developments and Future Outlook
- Table 9.1 HPAPI and Cytotoxic Drugs Contract Manufacturing: List of Partnerships and Collaborations, since 2014
- Table 10.1 HPAPI and Cytotoxic Drugs Contract Manufacturing: List of Recent Expansions, since 2014
- Table 11.1 Capacity Analysis: Company Size of CMO
- Table 11.2 Capacity Analysis: Average Capacity by Company Size of CMO
- Table 11.3 HPAPI Manufacturing Global Installed Capacity: Total Capacity by Company Size (Liters)
- Table 16.1 Commonly Used Cytotoxins for ADCs
- Table 16.2 ADC Contract Manufacturing Service Providers: List of Companies
- Table 16.3 ADC Contract Manufacturing Service Providers: Information on Type of Service(s) Offered
- Table 18.1 BSP Pharmaceuticals: Company Snapshot
- Table 18.2 Catalent: Company Snapshot
- Table 18.3 CordenPharma: Company Snapshot
- Table 18.4 ProJect Pharmaceutics: Company Snapshot
- Table 18.5 Alphora Research: Company Snapshot
- Table 18.6 Piramal Healthcare: Company Snapshot
- Table 18.7 Helsinn: Company Snapshot
- Table 18.8 Cerbios-Pharma: Company Snapshot
- Table 18.9 Idifarma: Company Snapshot
- Table 19.1 HPAPIs and Cytotoxic Drugs Contract Manufacturers: Distribution by Year of Establishment
- Table 19.2 HPAPI and Cytotoxic Drugs Contract Manufacturers: Distribution by Company Size
- Table 19.3 HPAPI and Cytotoxic Drugs Contract Manufacturers: Distribution by Location of Headquarters (Region-wise)
- Table 19.4 HPAPI and Cytotoxic Drugs Contract Manufacturers: Distribution by Location of Headquarters (Country-wise)
- Table 19.5 HPAPI and Cytotoxic Drugs Contract Manufacturers: Distribution by Company Size and Location of Headquarters
- Table 19.6 HPAPI and Cytotoxic Drugs Contract Manufacturers: Distribution by Location of Manufacturing Facility (Region-wise)
- Table 19.7 HPAPI and Cytotoxic Drugs Contract Manufacturers: Distribution by Location of Manufacturing Facility (Country-wise)
- Table 19.8 HPAPI and Cytotoxic Drugs Contract Manufacturers: Distribution by Area of Manufacturing Facility (sq. ft.)
- Table 19.9 HPAPI and Cytotoxic Drugs Contract Manufacturers: Distribution by Scale of Operation
- Table 19.10 HPAPI and Cytotoxic Drugs Contract Manufacturers: Distribution by Type of Product Manufactured
- Table 19.11 HPAPI and Cytotoxic Drugs Contract Manufacturers: Distribution by Location of Manufacturing Facility and Type of Product Manufactured
- Table 19.12 HPAPI and Cytotoxic Drugs Contract Manufacturers: Distribution by Type of Finished Dosage Form
- Table 19.13 HPAPI and Cytotoxic Drugs Contract Manufacturers: Distribution by Occupational Exposure Limit (OEL)
- Table 19.14 HPAPI and Cytotoxic Drugs Contract Manufacturers: Distribution by Type of Molecule Manufactured
- Table 19.15 HPAPI and Cytotoxic Drugs Contract Manufacturers: Distribution by Type of Primary Packaging System
- Table 19.16 HPAPI and Cytotoxic Drugs Contract Manufacturers: Distribution by Regulatory Certification / Accreditation Received
- Table 19.17 HPAPI and Cytotoxic Drugs Contract Manufacturers: Distribution by Type of Service(s) Offered
- Table 19.18 Partnerships and Collaborations: Cumulative Year-wise Trend, since 2014
- Table 19.19 Partnerships and Collaborations: Distribution by Type of Partnership
- Table 19.20 Partnerships and Collaborations: Distribution by Year and Type of Partnership
- Table 19.21 Partnerships and Collaborations: Distribution by Scale of Operation
- Table 19.22 Partnerships and Collaborations: Distribution by Type of Product
- Table 19.23 Partnerships and Collaborations: Distribution by Type of Partnership and Type of Product
- Table 19.24 Partnerships and Collaborations: Distribution of Amount Invested Via Acquisitions (USD Million)
- Table 19.25 Partnerships and Collaborations: Distribution of Type of Partner
- Table 19.26 Most Active Players: Distribution by Number of Partnerships
- Table 19.27 Partnerships and Collaborations: Intracontinental and Intercontinental Deals
- Table 19.28 Partnerships and Collaborations: International and Local Deals
- Table 19.29 Recent Expansions: Distribution by Year of Expansion
- Table 19.30 Recent Expansions: Distribution by Type of Expansion
- Table 19.31 Recent Expansions: Distribution by Year and Type of Expansion
- Table 19.32 Recent Expansions: Distribution by Company Size and Location of Headquarters
- Table 19.33 Recent Expansions: Distribution by Scale of Operation
- Table 19.34 Recent Expansions: Distribution by Type of Expansion and Scale of Operation
- Table 19.35 Recent Expansions: Distribution by Type of Product
- Table 19.36 Recent Expansions: Distribution by Type of Expansion and Type of Product
- Table 19.37 Recent Expansions: Distribution by Location of Expanded Facility
- Table 19.38 Recent Expansions: Distribution by Type of Expansion and Location of Expanded Facility
- Table 19.39 Recent Expansions: Distribution by Expanded Facility Area (sq. ft.)
- Table 19.40 Recent Expansions: Distribution by Amount Invested (USD Million)
- Table 19.41 Most Active Players: Distribution by Number of Recent Expansions
- Table 19.42 Recent Expansions: Continent-wise Distribution
- Table 19.43 Recent Expansions: Country-wise Distribution
- Table 19.44 HPAPI Manufacturing Global Installed Capacity: Distribution by Range of Installed Capacity (Liters)
- Table 19.45 HPAPI Contract Manufacturing Installed Capacity: Distribution by Company Size
- Table 19.46 HPAPI Contract Manufacturing Installed Capacity: Distribution by Scale of Operation
- Table 19.47 HPAPI Contract Manufacturing Installed Capacity: Distribution by Location of Manufacturing Facility
- Table 19.48 HPAPI Contract Manufacturing Capacity Installed in North America
- Table 19.49 HPAPI Contract Manufacturing Capacity Installed in Europe
- Table 19.50 HPAPI Contract Manufacturing Capacity Installed in Asia-Pacific and Rest of the World
- Table 19.51 Global HPAPI and Cytotoxic Drugs Contract Manufacturing Market, till 2035: Conservative, Base and Optimistic Scenario (USD Billion)
- Table 19.52 HPAPI and Cytotoxic Drugs Contract Manufacturing Market: Distribution by Type of Product, till 2035: Conservative, Base and Optimistic Scenario (USD Billion)
- Table 19.53 HPAPI and Cytotoxic Drugs Contract Manufacturing Market: Distribution by Company Size, till 2035: Conservative, Base and Optimistic Scenario (USD Billion)
- Table 19.54 HPAPI and Cytotoxic Drugs Contract Manufacturing Market: Distribution by Scale of Operation, till 2035: Conservative, Base and Optimistic Scenario (USD Billion)
- Table 19.55 HPAPI and Cytotoxic Drugs Contract Manufacturing Market: Distribution by Type of Molecule, till 2035: Conservative, Base and Optimistic Scenario (USD Billion)
- Table 19.56 HPAPI and Cytotoxic Drugs Contract Manufacturing Market: Distribution by Type of Highly Potent Finished Dosage Forms, till 2035: Conservative, Base and Optimistic Scenario (USD Billion)
- Table 19.57 HPAPI and Cytotoxic Drugs Contract Manufacturing Market: Distribution by Regions, till 2035: Conservative, Base and Optimistic Scenario (USD Billion)
- Table 19.58 HPAPI and Cytotoxic Drugs Contract Manufacturing Market in North America, till 2035: Conservative, Base and Optimistic Scenario (USD Billion)
- Table 19.59 HPAPI and Cytotoxic Drugs Contract Manufacturing Market in the US, till 2035: Conservative, Base and Optimistic Scenario (USD Billion)
- Table 19.60 HPAPI and Cytotoxic Drugs Contract Manufacturing Market in Canada, till 2035: Conservative, Base and Optimistic Scenario (USD Billion)
- Table 19.61 HPAPI and Cytotoxic Drugs Contract Manufacturing Market in Mexico, till 2035: Conservative, Base and Optimistic Scenario (USD Billion)
- Table 19.62 HPAPI and Cytotoxic Drugs Contract Manufacturing Market in Europe, till 2035: Conservative, Base and Optimistic Scenario (USD Billion)
- Table 19.63 HPAPI and Cytotoxic Drugs Contract Manufacturing Market in the UK, till 2035: Conservative, Base and Optimistic Scenario (USD Billion)
- Table 19.64 HPAPI and Cytotoxic Drugs Contract Manufacturing Market in Italy, till 2035: Conservative, Base and Optimistic Scenario (USD Billion)
- Table 19.65 HPAPI and Cytotoxic Drugs Contract Manufacturing Market in Germany, till 2035: Conservative, Base and Optimistic Scenario (USD Billion)
- Table 19.66 HPAPI and Cytotoxic Drugs Contract Manufacturing Market in France, till 2035: Conservative, Base and Optimistic Scenario (USD Billion)
- Table 19.67 HPAPI and Cytotoxic Drugs Contract Manufacturing Market in Spain, till 2035: Conservative, Base and Optimistic Scenario (USD Billion)
- Table 19.68 HPAPI and Cytotoxic Drugs Contract Manufacturing Market in Rest of Europe, till 2035: Conservative, Base and Optimistic Scenario (USD Billion)
- Table 19.69 HPAPI and Cytotoxic Drugs Contract Manufacturing Market in Asia-Pacific, till 2035: Conservative, Base and Optimistic Scenario (USD Billion)
- Table 19.70 HPAPI and Cytotoxic Drugs Contract Manufacturing Market in China, till 2035: Conservative, Base and Optimistic Scenario (USD Billion)
- Table 19.71 HPAPI and Cytotoxic Drugs Contract Manufacturing Market in India, till 2035: Conservative, Base and Optimistic Scenario (USD Billion)
- Table 19.72 HPAPI and Cytotoxic Drugs Contract Manufacturing Market in Rest of Asia-Pacific, till 2035: Conservative, Base and Optimistic Scenario (USD Billion)
- Table 19.73 HPAPI and Cytotoxic Drugs Contract Manufacturing Market in Rest of the World, till 2035: Conservative, Base and Optimistic Scenario (USD Billion)
List of Figures
- Figure 2.1. Executive Summary: Overall Market Landscape
- Figure 2.2. Executive Summary: Partnerships and Collaborations
- Figure 2.3. Executive Summary: Recent Expansions
- Figure 2.4. Executive Summary: Capacity Analysis
- Figure 2.5. Executive Summary: Market Sizing and Opportunity Analysis
- Figure 3.1 Characteristics of HPAPIs
- Figure 3.2 Categorization of HPAPIs
- Figure 3.3 Different Types of HPAPIs
- Figure 4.1 HPAPIs and Cytotoxic Drugs Contract Manufacturers: Distribution by Year of Establishment
- Figure 4.2 HPAPI and Cytotoxic Drugs Contract Manufacturers: Distribution by Company Size
- Figure 4.3 HPAPI and Cytotoxic Drugs Contract Manufacturers: Distribution by Location of Headquarters (Region-wise)
- Figure 4.4 HPAPI and Cytotoxic Drugs Contract Manufacturers: Distribution by Location of Headquarters (Country-wise)
- Figure 4.5 HPAPI and Cytotoxic Drugs Contract Manufacturers: Distribution by Company Size and Location of Headquarters
- Figure 4.6 HPAPI and Cytotoxic Drugs Contract Manufacturers: Distribution by Location of Manufacturing Facility (Region-wise)
- Figure 4.7 HPAPI and Cytotoxic Drugs Contract Manufacturers: Distribution by Location of Manufacturing Facility (Country-wise)
- Figure 4.8 HPAPI and Cytotoxic Drugs Contract Manufacturers: Distribution by Area of Manufacturing Facility
- Figure 4.9 HPAPI and Cytotoxic Drugs Contract Manufacturers: Distribution by Scale of Operation
- Figure 4.10 HPAPI and Cytotoxic Drugs Contract Manufacturers: Distribution by Type of Product Manufactured
- Figure 4.11 HPAPI and Cytotoxic Drugs Contract Manufacturers: Distribution by Location of Manufacturing Facility and Type of Product Manufactured
- Figure 4.12 HPAPI and Cytotoxic Drugs Contract Manufacturers: Distribution by Type of Finished Dosage Form
- Figure 4.13 HPAPI and Cytotoxic Drugs Contract Manufacturers: Distribution by Occupational Exposure Limit (OEL)
- Figure 4.14 HPAPI and Cytotoxic Drugs Contract Manufacturers: Distribution by Type of Molecule Manufactured
- Figure 4.15 HPAPI and Cytotoxic Drugs Contract Manufacturers: Distribution by Type of Primary Packaging System
- Figure 4.16 HPAPI and Cytotoxic Drugs Contract Manufacturers: Distribution by Regulatory Certification / Accreditation Received
- Figure 4.17 HPAPI and Cytotoxic Drugs Contract Manufacturers: Distribution by Type of Service(s) Offered
- Figure 5.1 HPAPI Contract Manufacturers based in North America
- Figure 5.2 HPAPI Contract Manufacturers based in Europe
- Figure 5.3 HPAPI Contract Manufacturers based in Asia-Pacific and Rest of the World
- Figure 5.4 Highly Potent FDF Contract Manufacturers based in North America
- Figure 5.5 Highly Potent FDF Contract Manufacturers based in Europe
- Figure 5.6 Potent FDF Contract Manufacturers based in Asia-Pacific and Rest of the World
- Figure 5.7 HPAPI and Highly Potent FDF Contract Manufacturers based in North America
- Figure 5.8 HPAPI and Highly Potent FDF Contract Manufacturers based in Europe
- Figure 5.9 HPAPI and Highly Potent FDF Contract Manufacturers based in Asia-Pacific and Rest of the World
- Figure 9.1 Partnerships and Collaborations: Cumulative Year-wise Trend, since 2014
- Figure 9.2 Partnerships and Collaborations: Distribution by Type of Partnership
- Figure 9.3 Partnerships and Collaborations: Distribution by Year and Type of Partnership
- Figure 9.4 Partnerships and Collaborations: Distribution by Scale of Operation
- Figure 9.5 Partnerships and Collaborations: Distribution by Type of Product
- Figure 9.6 Partnerships and Collaborations: Distribution by Type of Partnership and Type of Product
- Figure 9.7 Partnerships and Collaborations: Distribution of Amount Invested Via Acquisitions (USD Million)
- Figure 9.8 Partnerships and Collaborations: Distribution of Type of Partner
- Figure 9.9 Most Active Players: Distribution by Number of Partnerships
- Figure 9.10 Partnerships and Collaborations: Intracontinental and Intercontinental Deals
- Figure 9.11 Partnerships and Collaborations: International and Local Deals
- Figure 10.1 Recent Expansions: Distribution by Year of Expansion
- Figure 10.2 Recent Expansions: Distribution by Type of Expansion
- Figure 10.3 Recent Expansions: Distribution by Year and Type of Expansion
- Figure 10.4 Recent Expansions: Distribution by Company Size and Location of Headquarters
- Figure 10.5 Recent Expansions: Distribution by Scale of Operation
- Figure 10.6 Recent Expansions: Distribution by Type of Expansion and Scale of Operation
- Figure 10.7 Recent Expansions: Distribution by Type of Product
- Figure 10.8 Recent Expansions: Distribution by Type of Expansion and Type of Product
- Figure 10.9 Recent Expansions: Distribution by Location of Expanded Facility (Region-Wise)
- Figure 10.10 Recent Expansions: Distribution by Type of Expansion and Location of Expanded Facility
- Figure 10.11 Recent Expansions: Distribution by Expanded Facility Area (sq. ft.)
- Figure 10.12 Recent Expansions: Distribution by Amount Invested on Expansions (USD Million)
- Figure 10.13 Most Active Players: Distribution by Number of Expansions
- Figure 10.14 Recent Expansions: Continent-wise Distribution
- Figure 10.15 Recent Expansions: Country-wise Distribution
- Figure 11.1 HPAPI Manufacturing Global Installed Capacity: Distribution by Range of Installed Capacity (Liters)
- Figure 11.2 HPAPI Contract Manufacturing Installed Capacity: Distribution by Company Size
- Figure 11.3 HPAPI Contract Manufacturing Installed Capacity: Distribution by Scale of Operation
- Figure 11.4 HPAPI Contract Manufacturing Installed Capacity: Distribution by Location of Manufacturing Facility
- Figure 11.5 HPAPI Contract Manufacturing Capacity Installed in North America
- Figure 11.6 HPAPI Contract Manufacturing Capacity Installed in Europe
- Figure 11.7 HPAPI Contract Manufacturing Capacity Installed in Asia-Pacific and Rest of the World
- Figure 12.1. Regional Capability Analysis: HPAPI and Cytotoxic Drug Manufacturing in North America
- Figure 12.2. Regional Capability Analysis: HPAPI and Cytotoxic Drug Manufacturing in Europe
- Figure 12.3. Regional Capability Analysis: HPAPI and Cytotoxic Drug Manufacturing in Asia-Pacific
- Figure 12.4. Regional Capability Analysis: HPAPI and Cytotoxic Drug Manufacturing in Rest of the World
- Figure 12.5. Regional Capability Analysis: Comparison of HPAPI and Cytotoxic Drug Manufacturing Capabilities across Different Regions
- Figure 13.1 Make versus Buy Decision Making: Framework
- Figure 13.2 Make versus Buy Decision Making: Possible Scenario Descriptions
- Figure 14.1 Global HPAPI and Cytotoxic Drugs Contract Manufacturing Market, till 2035 (USD Billion)
- Figure 14.2 HPAPI and Cytotoxic Drugs Contract Manufacturing Market, till 2035: Distribution by Type of Product (USD Billion)
- Figure 14.3 HPAPI and Cytotoxic Drugs Contract Manufacturing Market: Distribution by Company Size (USD Billion)
- Figure 14.4 HPAPI and Cytotoxic Drugs Contract Manufacturing Market, till 2035: Distribution by Scale of Operation (USD Billion)
- Figure 14.5 HPAPI and Cytotoxic Drugs Contract Manufacturing Market, till 2035: Distribution by Type of Molecule (USD Billion)
- Figure 14.6 HPAPI and Cytotoxic Drugs Contract Manufacturing Market, till 2035: Distribution by Type of Highly Potent Finished Dosage Forms (USD Billion)
- Figure 14.7 HPAPI and Cytotoxic Drugs Contract Manufacturing Market, till 2035: Distribution by Geography (USD Billion)
- Figure 14.8 HPAPI and Cytotoxic Drugs Contract Manufacturing Market in North America, till 2035 (USD Billion)
- Figure 14.9 HPAPI and Cytotoxic Drugs Contract Manufacturing Market in the US, till 2035 (USD Billion)
- Figure 14.10 HPAPI and Cytotoxic Drugs Contract Manufacturing Market in Canada, till 2035 (USD Billion)
- Figure 14.11 HPAPI and Cytotoxic Drugs Contract Manufacturing Market in Mexico, till 2035 (USD Billion)
- Figure 14.12 HPAPI and Cytotoxic Drugs Contract Manufacturing Market in Europe, till 2035 (USD Billion)
- Figure 14.13 HPAPI and Cytotoxic Drugs Contract Manufacturing Market in the UK, till 2035 (USD Billion)
- Figure 14.14 HPAPI and Cytotoxic Drugs Contract Manufacturing Market in Italy, till 2035 (USD Billion)
- Figure 14.15 HPAPI and Cytotoxic Drugs Contract Manufacturing Market in Germany, till 2035 (USD Billion)
- Figure 14.16 HPAPI and Cytotoxic Drugs Contract Manufacturing Market in France, till 2035 (USD Billion)
- Figure 14.17 HPAPI and Cytotoxic Drugs Contract Manufacturing Market in Spain, till 2035 (USD Billion)
- Figure 14.18 HPAPI and Cytotoxic Drugs Contract Manufacturing Market in Rest of Europe, till 2035 (USD Billion)
- Figure 14.19 HPAPI and Cytotoxic Drugs Contract Manufacturing Market in Asia-Pacific, till 2035 (USD Billion)
- Figure 14.20 HPAPI and Cytotoxic Drugs Contract Manufacturing Market in China, till 2035 (USD Billion)
- Figure 14.21 HPAPI and Cytotoxic Drugs Contract Manufacturing Market in India, till 2035 (USD Billion)
- Figure 14.22 HPAPI and Cytotoxic Drugs Contract Manufacturing Market in the Rest of Asia-Pacific, till 2035 (USD Billion)
- Figure 14.23 HPAPI and Cytotoxic Drugs Contract Manufacturing Market in Rest of the World, till 2035 (USD Billion)
- Figure 15.1 HPAPIs and Cytotoxic Drugs Contract Manufacturing: SWOT Analysis
- Figure 15.2 Comparison of SWOT Factors: Harvey Ball Analysis
- Figure 16.1 Key Components of an ADCs
- Figure 16.2 ADC Manufacturing: Key Process Steps
- Figure 16.3 Key Parameters while Selecting a CMO Partner
- Figure 16.4 ADC Contract Manufacturing Service Providers: Distribution by Year of Establishment
- Figure 16.5 ADC Contract Manufacturing Service Providers: Distribution by Company Size
- Figure 16.6 ADC Contract Manufacturing Service Providers: Distribution by Location of Headquarters
- Figure 16.7 ADC Contract Manufacturing Service Providers: Distribution by Type of Service(s) Offered
- Figure 16.8 ADC Contract Manufacturing Service Providers: Distribution by Location of Headquarters and Type of Service(s) Offered
 細胞毒性藥物市場:按藥物類型、應用、給藥途徑、分銷管道分類:2024-2033年全球機會分析和產業預測
 注射細胞毒性藥物市場 - 2024-2034 年全球產業分析、規模、佔有率、成長、趨勢和預測
 注射細胞毒性藥物市場 - 按藥物類別(抗代謝物、長春花生物鹼、紫杉烷類、蒽環類、鉑化合物、烷化劑)、按應用(腫瘤、類風濕關節炎)、按配銷通路- 預測(2024 - 2032)細胞毒性藥物市場 - 按類型、藥物類別、給藥途徑、應用、配銷通路- 全球預測 2024 - 2032
 注射細胞毒性藥物市場至2030年的預測:按藥物類型、分銷管道、應用和地區的全球分析
 細胞毒性藥物市場、佔有率、規模、趨勢、產業分析報告:按藥物類型、給藥途徑、應用、分銷管道、地區、細分市場預測,2024-2032