


 |
市場調查報告書
商品編碼
1513375
全球潮汐能市場:依方法、按應用:機會分析與產業預測(2024-2033)Tidal Energy Market By Method (Tidal Stream, Tidal Barrage, Tidal Turbine, Others), By Application (Power Generation, Desalination): Global Opportunity Analysis and Industry Forecast, 2024-2033 |
||||||
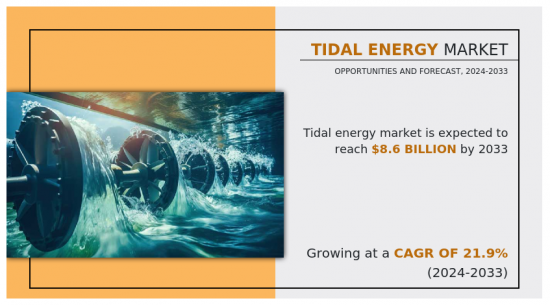
預計2023年全球潮汐能市場規模將達12億美元,2033年將達86億美元,2024年至2033年複合年成長率為21.9%。
介紹
潮汐能市場利用海洋潮汐能發電,為永續能源生產提供了一個有前途的途徑。潮汐能系統利用地球、月球和太陽之間的引力,利用潮汐流的動能和潮汐高度差的位能。潮汐能的可再生性和可預測性使其成為石化燃料的可靠替代能源,並為全球應對氣候變遷的努力做出貢獻。
利用潮汐力量的方法有三種:潮汐流系統、防波堤系統和海堤系統。
潮汐流系統,也稱為潮汐流系統或潮汐流渦輪機,利用水的動能,類似水下風力發電機。這些系統將渦輪機放置在有強烈潮汐流的海洋中。當電流流動時,渦輪機旋轉,與渦輪機連接的發電機發電。潮汐流系統通常安裝在潮汐流速度較高的區域,例如狹窄的水道或海峽。
防波堤是建在海灣或河口的類似水壩的結構。它有水閘和渦輪機,允許水在潮汐週期期間進出海灣。當潮水上漲時,水被困在船閘後面。當退潮時,水閘和渦輪機讓水流出,帶動渦輪機發電。儘管防波堤可以產生大量電力,但它們會對當地生態系統產生環境和航行影響。
防洪圍籬系統是利用潮汐能的一個相對較新的概念。它由水下渦輪機和其他能量捕獲裝置組成,這些裝置佈置在潮汐通道的柵欄內。當潮汐流過水道時,它們與渦輪機相互作用,從而發電。防洪圍籬系統比防波堤的部署更靈活,因為它們不需要跨水道建造大量基礎設施。它們也可以設計成對環境的影響最小。
市場動態
潮汐能領域的技術進步推動了顯著成長,是其擴張的主要驅動力。渦輪機設計、材料和水下基礎設施的創新使潮汐能發電更加高效和可靠,使其與傳統能源相比越來越具有競爭力。這些進步吸引了對該領域的投資,因為它們不僅增加了能源產量,還降低了營運成本。
然而,監管障礙是潮汐能廣泛使用的主要障礙。複雜的審核流程、環境問題和監管不確定性往往會減緩或阻礙潮汐計劃的開發。平衡環境保護和能源發展仍然是一個嚴峻的挑戰,需要行業相關人員和監管機構之間密切合作,以簡化許可流程並降低風險。
儘管面臨監管挑戰,潮汐能市場對於海洋資源豐富的國家來說仍具有巨大的出口潛力。隨著各國尋求能源結構多元化和減少碳排放,全球對清潔、可再生能源解決方案的需求不斷增加。一旦潮汐能技術成熟並得到驗證,就可以將其出口到沿海條件合適的地區,提供永續的能源來源,並透過出口和技術轉移促進經濟成長。
分部概覽
潮汐能市場分為方法、應用和區域。依方法分為潮流、防波堤、潮汐渦輪機、海堤。按應用分類,市場分為發電和海水淡化。按地區分類,對北美、歐洲、亞太地區和拉丁美洲/中東/非洲的潮汐能市場進行了分析。
相關人員的主要利益
- 本報告定量分析了 2023-2033 年潮汐能市場分析的細分市場、當前趨勢、估計和動態,並確定了潮汐能市場的突出機會。
- 我們提供市場研究以及與市場促進因素、市場限制和市場機會相關的資訊。
- 波特的五力分析強調了買家和供應商幫助相關人員做出利潤驅動的商業決策並加強供應商和買家網路的潛力。
- 潮汐能市場細分的詳細分析有助於確定市場機會。
- 每個地區的主要國家都根據其對全球市場的收益貢獻繪製了地圖。
- 市場公司定位有助於對標,並清楚了解市場公司的當前地位。
- 該報告包括對區域和全球潮汐能市場趨勢、主要企業、細分市場、應用領域和市場成長策略的分析。
使用此報告可以進行報告客製化(請聯絡銷售人員以了解額外費用和時間表)
- 資本投資明細
- 安裝基礎分析
- 投資機會
- 按地區分類的新參與企業
- 科技趨勢分析
- 公司市場佔有率分析:依產品/區隔市場
- 新產品開發/各大公司產品矩陣
- 監管指引
- 策略建議
- 根據客戶興趣新增其他公司簡介
- 按國家或地區進行的附加分析 – 市場規模和預測
- 公司簡介的擴充列表
- 歷史市場資料
- 主要企業詳細資料(Excel 格式,包括位置、聯絡資訊、供應商/供應商網路等)
- 全球/區域/國家層級公司的市場佔有率分析
- 市場規模及預測
目錄
第1章簡介
第 2 章執行摘要
第3章市場概況
- 市場定義和範圍
- 主要發現
- 影響因素
- 主要投資機會
- 波特五力分析
- 市場動態
- 促進因素
- 抑制因素
- 機會
- 價值鏈分析
- 價格分析
- 關鍵監管分析
- 專利情況
- 監管指引
第4章潮汐能市場:依方法分類
- 概述
- 浪潮
- 防波堤
- 潮汐渦輪機
- 其他
第5章潮汐能市場:依應用分類
- 概述
- 發電
- 海水淡化
第6章潮汐能市場:按地區
- 概述
- 北美洲
- 美國
- 加拿大
- 墨西哥
- 歐洲
- 法國
- 德國
- 英國
- 西班牙
- 義大利
- 其他
- 亞太地區
- 韓國
- 中國
- 日本
- 印度
- 澳洲
- 其他
- 拉丁美洲/中東/非洲
- 巴西
- 沙烏地阿拉伯
- 南非
- 其他
第7章 競爭格局
- 介紹
- 關鍵成功策略
- 10家主要企業產品圖譜
- 競爭對手儀表板
- 競爭熱圖
- 主要企業定位(2023年)
第8章 公司簡介
- European Marine Energy Centre(EMEC)
- Andritz AG
- Orbital Marine Power Ltd
- sustainable marine energy ltd
- nova innovation ltd
- SIMEC Atlantis Energy
- HydroQuest SAS
- Verdant Power
- Hammerfest Strom AS
- Minesto AB
The tidal energy market was valued at $1.2 billion in 2023, and is estimated to reach $8.6 billion by 2033, growing at a CAGR of 21.9% from 2024 to 2033.
Introduction
The tidal energy market harnesses the power of ocean tides to generate electricity, offering a promising avenue for sustainable energy production. Utilizing the gravitational forces between the Earth, moon, and sun, tidal energy systems capture the kinetic energy of tidal currents and the potential energy of tidal height differentials. With its renewable nature and predictability, tidal energy presents a reliable alternative to fossil fuels, contributing to global efforts to combat climate change.
There are three methods to harness the power from tides such as tidal stream system, tidal barrage system, and tidal fence system.
Tidal stream systems, also known as tidal current systems or tidal turbines, harness the kinetic energy of moving water similar to underwater wind turbines. These systems consist of turbines placed underwater in areas with strong tidal currents. As the tidal currents flow, they cause the turbines to rotate, generating electricity through a generator connected to the turbine. Tidal stream systems are typically deployed in areas with high tidal flow velocities, such as narrow channels or straits.
A tidal barrage is a dam-like structure built across the mouth of a bay or estuary. It includes sluice gates or turbines that allow water to flow into and out of the bay during tidal cycles. As the tide rises, water is trapped behind the barrage. When the tide falls, the sluice gates or turbines allow water to flow out, driving turbines to generate electricity. Tidal barrages can generate significant amounts of electricity but may have environmental impacts on local ecosystems and navigation routes.
Tidal fence systems are a relatively new concept for harnessing tidal energy. They consist of rows of submerged turbines or other energy-capturing devices arranged in a fence-like structure across a tidal channel. As the tidal currents flow through the channel, they interact with the turbines, causing them to generate electricity. Tidal fence systems can be more flexible in deployment than tidal barrages since they don't require large-scale infrastructure construction across an entire waterway. They can also be designed to minimize environmental impacts.
Market Dynamics
Technological advancements in the tidal energy sector have propelled significant growth, serving as a primary driver for its expansion. Innovations in turbine design, materials, and underwater infrastructure have enhanced the efficiency and reliability of tidal energy generation, making it increasingly competitive with conventional sources. These advancements not only improve energy output but also reduce operational costs, thus attracting more investment into the sector.
However, regulatory hurdles pose significant restraints to the widespread adoption of tidal energy. Complex permitting processes, environmental concerns, and regulatory uncertainties often delay or deter the development of tidal projects. Striking a balance between environmental protection and energy development remains a key challenge, requiring close collaboration between industry stakeholders and regulatory bodies to streamline approval processes and mitigate risks.
Despite regulatory challenges, the tidal energy market presents substantial export potential for countries with abundant marine resources. As nations strive to diversify their energy mix and reduce carbon emissions, there is a growing global demand for clean and renewable energy solutions. Tidal energy technologies once matured and proven, can be exported to regions with suitable coastal conditions, providing a sustainable energy source and stimulating economic growth through exports and technology transfer initiatives.
Segments Overview
The tidal energy market is segmented into method, application, and region. On the basis of method, the market is divided into tidal stream, tidal barrage, tidal turbine, and tidal fences. On the basis of application, the market is bifurcated into power generation and desalination. On the basis of region, the tidal energy market is analyzed across North America, Europe, Asia-Pacific, and LAMEA.
Major players operating in the global tidal energy market include European Marine Energy Centre, Andritz AG, Orbital Marine Power Ltd., Sustainable Marine Energy Ltd., Nova Innovation Ltd., SIMEC Atlantis Energy Ltd, HydroQuest SAS, Verdant Power Inc., Hammerfest Strom AS, and Minesto AB.
Key Benefits For Stakeholders
- This report provides a quantitative analysis of the market segments, current trends, estimations, and dynamics of the tidal energy market analysis from 2023 to 2033 to identify the prevailing tidal energy market opportunities.
- The market research is offered along with information related to key drivers, restraints, and opportunities.
- Porter's five forces analysis highlights the potency of buyers and suppliers to enable stakeholders make profit-oriented business decisions and strengthen their supplier-buyer network.
- In-depth analysis of the tidal energy market segmentation assists to determine the prevailing market opportunities.
- Major countries in each region are mapped according to their revenue contribution to the global market.
- Market player positioning facilitates benchmarking and provides a clear understanding of the present position of the market players.
- The report includes the analysis of the regional as well as global tidal energy market trends, key players, market segments, application areas, and market growth strategies.
Additional benefits you will get with this purchase are:
- Quarterly Update and* (only available with a corporate license, on listed price)
- 5 additional Company Profile of client Choice pre- or Post-purchase, as a free update.
- Free Upcoming Version on the Purchase of Five and Enterprise User License.
- 16 analyst hours of support* (post-purchase, if you find additional data requirements upon review of the report, you may receive support amounting to 16 analyst hours to solve questions, and post-sale queries)
- 15% Free Customization* (in case the scope or segment of the report does not match your requirements, 15% is equivalent to 3 working days of free work, applicable once)
- Free data Pack on the Five and Enterprise User License. (Excel version of the report)
- Free Updated report if the report is 6-12 months old or older.
- 24-hour priority response*
- Free Industry updates and white papers.
Possible Customization with this report (with additional cost and timeline, please talk to the sales executive to know more)
- Capital Investment breakdown
- Installed Base analysis
- Investment Opportunities
- Upcoming/New Entrant by Regions
- Technology Trend Analysis
- Market share analysis of players by products/segments
- New Product Development/ Product Matrix of Key Players
- Regulatory Guidelines
- Strategic Recommendations
- Additional company profiles with specific to client's interest
- Additional country or region analysis- market size and forecast
- Expanded list for Company Profiles
- Historic market data
- Key player details (including location, contact details, supplier/vendor network etc. in excel format)
- Market share analysis of players at global/region/country level
- Volume Market Size and Forecast
Key Market Segments
By Method
- Tidal Stream
- Tidal Barrage
- Tidal Turbine
- Others
By Application
- Power Generation
- Desalination
By Region
- North America
- U.S.
- Canada
- Mexico
- Europe
- France
- Germany
- UK
- Spain
- Italy
- Rest of Europe
- Asia-Pacific
- South Korea
- China
- Japan
- India
- Australia
- Rest of Asia-Pacific
- LAMEA
- Brazil
- Saudi Arabia
- South Africa
- Rest of LAMEA
Key Market Players:
- European Marine Energy Centre (EMEC)
- Andritz AG
- Orbital Marine Power Ltd
- sustainable marine energy ltd
- nova innovation ltd
- SIMEC Atlantis Energy
- HydroQuest SAS
- Verdant Power
- Hammerfest Strom AS
- Minesto AB
TABLE OF CONTENTS
CHAPTER 1: INTRODUCTION
- 1.1. Report description
- 1.2. Key market segments
- 1.3. Key benefits to the stakeholders
- 1.4. Research methodology
- 1.4.1. Primary research
- 1.4.2. Secondary research
- 1.4.3. Analyst tools and models
CHAPTER 2: EXECUTIVE SUMMARY
- 2.1. CXO perspective
CHAPTER 3: MARKET OVERVIEW
- 3.1. Market definition and scope
- 3.2. Key findings
- 3.2.1. Top impacting factors
- 3.2.2. Top investment pockets
- 3.3. Porter's five forces analysis
- 3.4. Market dynamics
- 3.4.1. Drivers
- 3.4.2. Restraints
- 3.4.3. Opportunities
- 3.5. Value Chain Analysis
- 3.6. Pricing Analysis
- 3.7. Key Regulation Analysis
- 3.8. Patent Landscape
- 3.9. Regulatory Guidelines
CHAPTER 4: TIDAL ENERGY MARKET, BY METHOD
- 4.1. Overview
- 4.1.1. Market size and forecast
- 4.2. Tidal Stream
- 4.2.1. Key market trends, growth factors and opportunities
- 4.2.2. Market size and forecast, by region
- 4.2.3. Market share analysis by country
- 4.3. Tidal Barrage
- 4.3.1. Key market trends, growth factors and opportunities
- 4.3.2. Market size and forecast, by region
- 4.3.3. Market share analysis by country
- 4.4. Tidal Turbine
- 4.4.1. Key market trends, growth factors and opportunities
- 4.4.2. Market size and forecast, by region
- 4.4.3. Market share analysis by country
- 4.5. Others
- 4.5.1. Key market trends, growth factors and opportunities
- 4.5.2. Market size and forecast, by region
- 4.5.3. Market share analysis by country
CHAPTER 5: TIDAL ENERGY MARKET, BY APPLICATION
- 5.1. Overview
- 5.1.1. Market size and forecast
- 5.2. Power Generation
- 5.2.1. Key market trends, growth factors and opportunities
- 5.2.2. Market size and forecast, by region
- 5.2.3. Market share analysis by country
- 5.3. Desalination
- 5.3.1. Key market trends, growth factors and opportunities
- 5.3.2. Market size and forecast, by region
- 5.3.3. Market share analysis by country
CHAPTER 6: TIDAL ENERGY MARKET, BY REGION
- 6.1. Overview
- 6.1.1. Market size and forecast By Region
- 6.2. North America
- 6.2.1. Key market trends, growth factors and opportunities
- 6.2.2. Market size and forecast, by Method
- 6.2.3. Market size and forecast, by Application
- 6.2.4. Market size and forecast, by country
- 6.2.4.1. U.S.
- 6.2.4.1.1. Market size and forecast, by Method
- 6.2.4.1.2. Market size and forecast, by Application
- 6.2.4.2. Canada
- 6.2.4.2.1. Market size and forecast, by Method
- 6.2.4.2.2. Market size and forecast, by Application
- 6.2.4.3. Mexico
- 6.2.4.3.1. Market size and forecast, by Method
- 6.2.4.3.2. Market size and forecast, by Application
- 6.3. Europe
- 6.3.1. Key market trends, growth factors and opportunities
- 6.3.2. Market size and forecast, by Method
- 6.3.3. Market size and forecast, by Application
- 6.3.4. Market size and forecast, by country
- 6.3.4.1. France
- 6.3.4.1.1. Market size and forecast, by Method
- 6.3.4.1.2. Market size and forecast, by Application
- 6.3.4.2. Germany
- 6.3.4.2.1. Market size and forecast, by Method
- 6.3.4.2.2. Market size and forecast, by Application
- 6.3.4.3. UK
- 6.3.4.3.1. Market size and forecast, by Method
- 6.3.4.3.2. Market size and forecast, by Application
- 6.3.4.4. Spain
- 6.3.4.4.1. Market size and forecast, by Method
- 6.3.4.4.2. Market size and forecast, by Application
- 6.3.4.5. Italy
- 6.3.4.5.1. Market size and forecast, by Method
- 6.3.4.5.2. Market size and forecast, by Application
- 6.3.4.6. Rest of Europe
- 6.3.4.6.1. Market size and forecast, by Method
- 6.3.4.6.2. Market size and forecast, by Application
- 6.4. Asia-Pacific
- 6.4.1. Key market trends, growth factors and opportunities
- 6.4.2. Market size and forecast, by Method
- 6.4.3. Market size and forecast, by Application
- 6.4.4. Market size and forecast, by country
- 6.4.4.1. South Korea
- 6.4.4.1.1. Market size and forecast, by Method
- 6.4.4.1.2. Market size and forecast, by Application
- 6.4.4.2. China
- 6.4.4.2.1. Market size and forecast, by Method
- 6.4.4.2.2. Market size and forecast, by Application
- 6.4.4.3. Japan
- 6.4.4.3.1. Market size and forecast, by Method
- 6.4.4.3.2. Market size and forecast, by Application
- 6.4.4.4. India
- 6.4.4.4.1. Market size and forecast, by Method
- 6.4.4.4.2. Market size and forecast, by Application
- 6.4.4.5. Australia
- 6.4.4.5.1. Market size and forecast, by Method
- 6.4.4.5.2. Market size and forecast, by Application
- 6.4.4.6. Rest of Asia-Pacific
- 6.4.4.6.1. Market size and forecast, by Method
- 6.4.4.6.2. Market size and forecast, by Application
- 6.5. LAMEA
- 6.5.1. Key market trends, growth factors and opportunities
- 6.5.2. Market size and forecast, by Method
- 6.5.3. Market size and forecast, by Application
- 6.5.4. Market size and forecast, by country
- 6.5.4.1. Brazil
- 6.5.4.1.1. Market size and forecast, by Method
- 6.5.4.1.2. Market size and forecast, by Application
- 6.5.4.2. Saudi Arabia
- 6.5.4.2.1. Market size and forecast, by Method
- 6.5.4.2.2. Market size and forecast, by Application
- 6.5.4.3. South Africa
- 6.5.4.3.1. Market size and forecast, by Method
- 6.5.4.3.2. Market size and forecast, by Application
- 6.5.4.4. Rest of LAMEA
- 6.5.4.4.1. Market size and forecast, by Method
- 6.5.4.4.2. Market size and forecast, by Application
CHAPTER 7: COMPETITIVE LANDSCAPE
- 7.1. Introduction
- 7.2. Top winning strategies
- 7.3. Product mapping of top 10 player
- 7.4. Competitive dashboard
- 7.5. Competitive heatmap
- 7.6. Top player positioning, 2023
CHAPTER 8: COMPANY PROFILES
- 8.1. European Marine Energy Centre (EMEC)
- 8.1.1. Company overview
- 8.1.2. Key executives
- 8.1.3. Company snapshot
- 8.1.4. Operating business segments
- 8.1.5. Product portfolio
- 8.1.6. Business performance
- 8.1.7. Key strategic moves and developments
- 8.2. Andritz AG
- 8.2.1. Company overview
- 8.2.2. Key executives
- 8.2.3. Company snapshot
- 8.2.4. Operating business segments
- 8.2.5. Product portfolio
- 8.2.6. Business performance
- 8.2.7. Key strategic moves and developments
- 8.3. Orbital Marine Power Ltd
- 8.3.1. Company overview
- 8.3.2. Key executives
- 8.3.3. Company snapshot
- 8.3.4. Operating business segments
- 8.3.5. Product portfolio
- 8.3.6. Business performance
- 8.3.7. Key strategic moves and developments
- 8.4. sustainable marine energy ltd
- 8.4.1. Company overview
- 8.4.2. Key executives
- 8.4.3. Company snapshot
- 8.4.4. Operating business segments
- 8.4.5. Product portfolio
- 8.4.6. Business performance
- 8.4.7. Key strategic moves and developments
- 8.5. nova innovation ltd
- 8.5.1. Company overview
- 8.5.2. Key executives
- 8.5.3. Company snapshot
- 8.5.4. Operating business segments
- 8.5.5. Product portfolio
- 8.5.6. Business performance
- 8.5.7. Key strategic moves and developments
- 8.6. SIMEC Atlantis Energy
- 8.6.1. Company overview
- 8.6.2. Key executives
- 8.6.3. Company snapshot
- 8.6.4. Operating business segments
- 8.6.5. Product portfolio
- 8.6.6. Business performance
- 8.6.7. Key strategic moves and developments
- 8.7. HydroQuest SAS
- 8.7.1. Company overview
- 8.7.2. Key executives
- 8.7.3. Company snapshot
- 8.7.4. Operating business segments
- 8.7.5. Product portfolio
- 8.7.6. Business performance
- 8.7.7. Key strategic moves and developments
- 8.8. Verdant Power
- 8.8.1. Company overview
- 8.8.2. Key executives
- 8.8.3. Company snapshot
- 8.8.4. Operating business segments
- 8.8.5. Product portfolio
- 8.8.6. Business performance
- 8.8.7. Key strategic moves and developments
- 8.9. Hammerfest Strom AS
- 8.9.1. Company overview
- 8.9.2. Key executives
- 8.9.3. Company snapshot
- 8.9.4. Operating business segments
- 8.9.5. Product portfolio
- 8.9.6. Business performance
- 8.9.7. Key strategic moves and developments
- 8.10. Minesto AB
- 8.10.1. Company overview
- 8.10.2. Key executives
- 8.10.3. Company snapshot
- 8.10.4. Operating business segments
- 8.10.5. Product portfolio
- 8.10.6. Business performance
- 8.10.7. Key strategic moves and developments
LIST OF TABLES
- TABLE 01. GLOBAL TIDAL ENERGY MARKET, BY METHOD, 2023-2033 ($MILLION)
- TABLE 02. TIDAL ENERGY MARKET FOR TIDAL STREAM, BY REGION, 2023-2033 ($MILLION)
- TABLE 03. TIDAL ENERGY MARKET FOR TIDAL BARRAGE, BY REGION, 2023-2033 ($MILLION)
- TABLE 04. TIDAL ENERGY MARKET FOR TIDAL TURBINE, BY REGION, 2023-2033 ($MILLION)
- TABLE 05. TIDAL ENERGY MARKET FOR OTHERS, BY REGION, 2023-2033 ($MILLION)
- TABLE 06. GLOBAL TIDAL ENERGY MARKET, BY APPLICATION, 2023-2033 ($MILLION)
- TABLE 07. TIDAL ENERGY MARKET FOR POWER GENERATION, BY REGION, 2023-2033 ($MILLION)
- TABLE 08. TIDAL ENERGY MARKET FOR DESALINATION, BY REGION, 2023-2033 ($MILLION)
- TABLE 09. TIDAL ENERGY MARKET, BY REGION, 2023-2033 ($MILLION)
- TABLE 10. NORTH AMERICA TIDAL ENERGY MARKET, BY METHOD, 2023-2033 ($MILLION)
- TABLE 11. NORTH AMERICA TIDAL ENERGY MARKET, BY APPLICATION, 2023-2033 ($MILLION)
- TABLE 12. NORTH AMERICA TIDAL ENERGY MARKET, BY COUNTRY, 2023-2033 ($MILLION)
- TABLE 13. U.S. TIDAL ENERGY MARKET, BY METHOD, 2023-2033 ($MILLION)
- TABLE 14. U.S. TIDAL ENERGY MARKET, BY APPLICATION, 2023-2033 ($MILLION)
- TABLE 15. CANADA TIDAL ENERGY MARKET, BY METHOD, 2023-2033 ($MILLION)
- TABLE 16. CANADA TIDAL ENERGY MARKET, BY APPLICATION, 2023-2033 ($MILLION)
- TABLE 17. MEXICO TIDAL ENERGY MARKET, BY METHOD, 2023-2033 ($MILLION)
- TABLE 18. MEXICO TIDAL ENERGY MARKET, BY APPLICATION, 2023-2033 ($MILLION)
- TABLE 19. EUROPE TIDAL ENERGY MARKET, BY METHOD, 2023-2033 ($MILLION)
- TABLE 20. EUROPE TIDAL ENERGY MARKET, BY APPLICATION, 2023-2033 ($MILLION)
- TABLE 21. EUROPE TIDAL ENERGY MARKET, BY COUNTRY, 2023-2033 ($MILLION)
- TABLE 22. FRANCE TIDAL ENERGY MARKET, BY METHOD, 2023-2033 ($MILLION)
- TABLE 23. FRANCE TIDAL ENERGY MARKET, BY APPLICATION, 2023-2033 ($MILLION)
- TABLE 24. GERMANY TIDAL ENERGY MARKET, BY METHOD, 2023-2033 ($MILLION)
- TABLE 25. GERMANY TIDAL ENERGY MARKET, BY APPLICATION, 2023-2033 ($MILLION)
- TABLE 26. UK TIDAL ENERGY MARKET, BY METHOD, 2023-2033 ($MILLION)
- TABLE 27. UK TIDAL ENERGY MARKET, BY APPLICATION, 2023-2033 ($MILLION)
- TABLE 28. SPAIN TIDAL ENERGY MARKET, BY METHOD, 2023-2033 ($MILLION)
- TABLE 29. SPAIN TIDAL ENERGY MARKET, BY APPLICATION, 2023-2033 ($MILLION)
- TABLE 30. ITALY TIDAL ENERGY MARKET, BY METHOD, 2023-2033 ($MILLION)
- TABLE 31. ITALY TIDAL ENERGY MARKET, BY APPLICATION, 2023-2033 ($MILLION)
- TABLE 32. REST OF EUROPE TIDAL ENERGY MARKET, BY METHOD, 2023-2033 ($MILLION)
- TABLE 33. REST OF EUROPE TIDAL ENERGY MARKET, BY APPLICATION, 2023-2033 ($MILLION)
- TABLE 34. ASIA-PACIFIC TIDAL ENERGY MARKET, BY METHOD, 2023-2033 ($MILLION)
- TABLE 35. ASIA-PACIFIC TIDAL ENERGY MARKET, BY APPLICATION, 2023-2033 ($MILLION)
- TABLE 36. ASIA-PACIFIC TIDAL ENERGY MARKET, BY COUNTRY, 2023-2033 ($MILLION)
- TABLE 37. SOUTH KOREA TIDAL ENERGY MARKET, BY METHOD, 2023-2033 ($MILLION)
- TABLE 38. SOUTH KOREA TIDAL ENERGY MARKET, BY APPLICATION, 2023-2033 ($MILLION)
- TABLE 39. CHINA TIDAL ENERGY MARKET, BY METHOD, 2023-2033 ($MILLION)
- TABLE 40. CHINA TIDAL ENERGY MARKET, BY APPLICATION, 2023-2033 ($MILLION)
- TABLE 41. JAPAN TIDAL ENERGY MARKET, BY METHOD, 2023-2033 ($MILLION)
- TABLE 42. JAPAN TIDAL ENERGY MARKET, BY APPLICATION, 2023-2033 ($MILLION)
- TABLE 43. INDIA TIDAL ENERGY MARKET, BY METHOD, 2023-2033 ($MILLION)
- TABLE 44. INDIA TIDAL ENERGY MARKET, BY APPLICATION, 2023-2033 ($MILLION)
- TABLE 45. AUSTRALIA TIDAL ENERGY MARKET, BY METHOD, 2023-2033 ($MILLION)
- TABLE 46. AUSTRALIA TIDAL ENERGY MARKET, BY APPLICATION, 2023-2033 ($MILLION)
- TABLE 47. REST OF ASIA-PACIFIC TIDAL ENERGY MARKET, BY METHOD, 2023-2033 ($MILLION)
- TABLE 48. REST OF ASIA-PACIFIC TIDAL ENERGY MARKET, BY APPLICATION, 2023-2033 ($MILLION)
- TABLE 49. LAMEA TIDAL ENERGY MARKET, BY METHOD, 2023-2033 ($MILLION)
- TABLE 50. LAMEA TIDAL ENERGY MARKET, BY APPLICATION, 2023-2033 ($MILLION)
- TABLE 51. LAMEA TIDAL ENERGY MARKET, BY COUNTRY, 2023-2033 ($MILLION)
- TABLE 52. BRAZIL TIDAL ENERGY MARKET, BY METHOD, 2023-2033 ($MILLION)
- TABLE 53. BRAZIL TIDAL ENERGY MARKET, BY APPLICATION, 2023-2033 ($MILLION)
- TABLE 54. SAUDI ARABIA TIDAL ENERGY MARKET, BY METHOD, 2023-2033 ($MILLION)
- TABLE 55. SAUDI ARABIA TIDAL ENERGY MARKET, BY APPLICATION, 2023-2033 ($MILLION)
- TABLE 56. SOUTH AFRICA TIDAL ENERGY MARKET, BY METHOD, 2023-2033 ($MILLION)
- TABLE 57. SOUTH AFRICA TIDAL ENERGY MARKET, BY APPLICATION, 2023-2033 ($MILLION)
- TABLE 58. REST OF LAMEA TIDAL ENERGY MARKET, BY METHOD, 2023-2033 ($MILLION)
- TABLE 59. REST OF LAMEA TIDAL ENERGY MARKET, BY APPLICATION, 2023-2033 ($MILLION)
- TABLE 60. EUROPEAN MARINE ENERGY CENTRE (EMEC): KEY EXECUTIVES
- TABLE 61. EUROPEAN MARINE ENERGY CENTRE (EMEC): COMPANY SNAPSHOT
- TABLE 62. EUROPEAN MARINE ENERGY CENTRE (EMEC): PRODUCT SEGMENTS
- TABLE 63. EUROPEAN MARINE ENERGY CENTRE (EMEC): SERVICE SEGMENTS
- TABLE 64. EUROPEAN MARINE ENERGY CENTRE (EMEC): PRODUCT PORTFOLIO
- TABLE 65. EUROPEAN MARINE ENERGY CENTRE (EMEC): KEY STRATEGIES
- TABLE 66. ANDRITZ AG: KEY EXECUTIVES
- TABLE 67. ANDRITZ AG: COMPANY SNAPSHOT
- TABLE 68. ANDRITZ AG: PRODUCT SEGMENTS
- TABLE 69. ANDRITZ AG: SERVICE SEGMENTS
- TABLE 70. ANDRITZ AG: PRODUCT PORTFOLIO
- TABLE 71. ANDRITZ AG: KEY STRATEGIES
- TABLE 72. ORBITAL MARINE POWER LTD: KEY EXECUTIVES
- TABLE 73. ORBITAL MARINE POWER LTD: COMPANY SNAPSHOT
- TABLE 74. ORBITAL MARINE POWER LTD: PRODUCT SEGMENTS
- TABLE 75. ORBITAL MARINE POWER LTD: SERVICE SEGMENTS
- TABLE 76. ORBITAL MARINE POWER LTD: PRODUCT PORTFOLIO
- TABLE 77. ORBITAL MARINE POWER LTD: KEY STRATEGIES
- TABLE 78. SUSTAINABLE MARINE ENERGY LTD: KEY EXECUTIVES
- TABLE 79. SUSTAINABLE MARINE ENERGY LTD: COMPANY SNAPSHOT
- TABLE 80. SUSTAINABLE MARINE ENERGY LTD: PRODUCT SEGMENTS
- TABLE 81. SUSTAINABLE MARINE ENERGY LTD: SERVICE SEGMENTS
- TABLE 82. SUSTAINABLE MARINE ENERGY LTD: PRODUCT PORTFOLIO
- TABLE 83. SUSTAINABLE MARINE ENERGY LTD: KEY STRATEGIES
- TABLE 84. NOVA INNOVATION LTD: KEY EXECUTIVES
- TABLE 85. NOVA INNOVATION LTD: COMPANY SNAPSHOT
- TABLE 86. NOVA INNOVATION LTD: PRODUCT SEGMENTS
- TABLE 87. NOVA INNOVATION LTD: SERVICE SEGMENTS
- TABLE 88. NOVA INNOVATION LTD: PRODUCT PORTFOLIO
- TABLE 89. NOVA INNOVATION LTD: KEY STRATEGIES
- TABLE 90. SIMEC ATLANTIS ENERGY: KEY EXECUTIVES
- TABLE 91. SIMEC ATLANTIS ENERGY: COMPANY SNAPSHOT
- TABLE 92. SIMEC ATLANTIS ENERGY: PRODUCT SEGMENTS
- TABLE 93. SIMEC ATLANTIS ENERGY: SERVICE SEGMENTS
- TABLE 94. SIMEC ATLANTIS ENERGY: PRODUCT PORTFOLIO
- TABLE 95. SIMEC ATLANTIS ENERGY: KEY STRATEGIES
- TABLE 96. HYDROQUEST SAS: KEY EXECUTIVES
- TABLE 97. HYDROQUEST SAS: COMPANY SNAPSHOT
- TABLE 98. HYDROQUEST SAS: PRODUCT SEGMENTS
- TABLE 99. HYDROQUEST SAS: SERVICE SEGMENTS
- TABLE 100. HYDROQUEST SAS: PRODUCT PORTFOLIO
- TABLE 101. HYDROQUEST SAS: KEY STRATEGIES
- TABLE 102. VERDANT POWER: KEY EXECUTIVES
- TABLE 103. VERDANT POWER: COMPANY SNAPSHOT
- TABLE 104. VERDANT POWER: PRODUCT SEGMENTS
- TABLE 105. VERDANT POWER: SERVICE SEGMENTS
- TABLE 106. VERDANT POWER: PRODUCT PORTFOLIO
- TABLE 107. VERDANT POWER: KEY STRATEGIES
- TABLE 108. HAMMERFEST STROM AS: KEY EXECUTIVES
- TABLE 109. HAMMERFEST STROM AS: COMPANY SNAPSHOT
- TABLE 110. HAMMERFEST STROM AS: PRODUCT SEGMENTS
- TABLE 111. HAMMERFEST STROM AS: SERVICE SEGMENTS
- TABLE 112. HAMMERFEST STROM AS: PRODUCT PORTFOLIO
- TABLE 113. HAMMERFEST STROM AS: KEY STRATEGIES
- TABLE 114. MINESTO AB: KEY EXECUTIVES
- TABLE 115. MINESTO AB: COMPANY SNAPSHOT
- TABLE 116. MINESTO AB: PRODUCT SEGMENTS
- TABLE 117. MINESTO AB: SERVICE SEGMENTS
- TABLE 118. MINESTO AB: PRODUCT PORTFOLIO
- TABLE 119. MINESTO AB: KEY STRATEGIES
LIST OF FIGURES
- FIGURE 01. TIDAL ENERGY MARKET, 2023-2033
- FIGURE 02. SEGMENTATION OF TIDAL ENERGY MARKET,2023-2033
- FIGURE 03. TOP IMPACTING FACTORS IN TIDAL ENERGY MARKET
- FIGURE 04. TOP INVESTMENT POCKETS IN TIDAL ENERGY MARKET (2024-2033)
- FIGURE 05. BARGAINING POWER OF SUPPLIERS
- FIGURE 06. BARGAINING POWER OF BUYERS
- FIGURE 07. THREAT OF SUBSTITUTION
- FIGURE 08. THREAT OF SUBSTITUTION
- FIGURE 09. COMPETITIVE RIVALRY
- FIGURE 10. GLOBAL TIDAL ENERGY MARKET:DRIVERS, RESTRAINTS AND OPPORTUNITIES
- FIGURE 11. PRICING ANALYSIS: TIDAL ENERGY MARKET 2023 AND 2033
- FIGURE 12. IMPACT OF KEY REGULATION: TIDAL ENERGY MARKET
- FIGURE 13. PATENT ANALYSIS BY COMPANY
- FIGURE 14. PATENT ANALYSIS BY COUNTRY
- FIGURE 15. TIDAL ENERGY MARKET, BY METHOD, 2023 AND 2033(%)
- FIGURE 16. COMPARATIVE SHARE ANALYSIS OF TIDAL ENERGY MARKET FOR TIDAL STREAM, BY COUNTRY 2023 AND 2033(%)
- FIGURE 17. COMPARATIVE SHARE ANALYSIS OF TIDAL ENERGY MARKET FOR TIDAL BARRAGE, BY COUNTRY 2023 AND 2033(%)
- FIGURE 18. COMPARATIVE SHARE ANALYSIS OF TIDAL ENERGY MARKET FOR TIDAL TURBINE, BY COUNTRY 2023 AND 2033(%)
- FIGURE 19. COMPARATIVE SHARE ANALYSIS OF TIDAL ENERGY MARKET FOR OTHERS, BY COUNTRY 2023 AND 2033(%)
- FIGURE 20. TIDAL ENERGY MARKET, BY APPLICATION, 2023 AND 2033(%)
- FIGURE 21. COMPARATIVE SHARE ANALYSIS OF TIDAL ENERGY MARKET FOR POWER GENERATION, BY COUNTRY 2023 AND 2033(%)
- FIGURE 22. COMPARATIVE SHARE ANALYSIS OF TIDAL ENERGY MARKET FOR DESALINATION, BY COUNTRY 2023 AND 2033(%)
- FIGURE 23. TIDAL ENERGY MARKET BY REGION, 2023 AND 2033(%)
- FIGURE 24. U.S. TIDAL ENERGY MARKET, 2023-2033 ($MILLION)
- FIGURE 25. CANADA TIDAL ENERGY MARKET, 2023-2033 ($MILLION)
- FIGURE 26. MEXICO TIDAL ENERGY MARKET, 2023-2033 ($MILLION)
- FIGURE 27. FRANCE TIDAL ENERGY MARKET, 2023-2033 ($MILLION)
- FIGURE 28. GERMANY TIDAL ENERGY MARKET, 2023-2033 ($MILLION)
- FIGURE 29. UK TIDAL ENERGY MARKET, 2023-2033 ($MILLION)
- FIGURE 30. SPAIN TIDAL ENERGY MARKET, 2023-2033 ($MILLION)
- FIGURE 31. ITALY TIDAL ENERGY MARKET, 2023-2033 ($MILLION)
- FIGURE 32. REST OF EUROPE TIDAL ENERGY MARKET, 2023-2033 ($MILLION)
- FIGURE 33. SOUTH KOREA TIDAL ENERGY MARKET, 2023-2033 ($MILLION)
- FIGURE 34. CHINA TIDAL ENERGY MARKET, 2023-2033 ($MILLION)
- FIGURE 35. JAPAN TIDAL ENERGY MARKET, 2023-2033 ($MILLION)
- FIGURE 36. INDIA TIDAL ENERGY MARKET, 2023-2033 ($MILLION)
- FIGURE 37. AUSTRALIA TIDAL ENERGY MARKET, 2023-2033 ($MILLION)
- FIGURE 38. REST OF ASIA-PACIFIC TIDAL ENERGY MARKET, 2023-2033 ($MILLION)
- FIGURE 39. BRAZIL TIDAL ENERGY MARKET, 2023-2033 ($MILLION)
- FIGURE 40. SAUDI ARABIA TIDAL ENERGY MARKET, 2023-2033 ($MILLION)
- FIGURE 41. SOUTH AFRICA TIDAL ENERGY MARKET, 2023-2033 ($MILLION)
- FIGURE 42. REST OF LAMEA TIDAL ENERGY MARKET, 2023-2033 ($MILLION)
- FIGURE 43. TOP WINNING STRATEGIES, BY YEAR
- FIGURE 44. TOP WINNING STRATEGIES, BY DEVELOPMENT
- FIGURE 45. TOP WINNING STRATEGIES, BY COMPANY
- FIGURE 46. PRODUCT MAPPING OF TOP 10 PLAYERS
- FIGURE 47. COMPETITIVE DASHBOARD
- FIGURE 48. COMPETITIVE HEATMAP: TIDAL ENERGY MARKET
- FIGURE 49. TOP PLAYER POSITIONING, 2023
 潮汐能 -市場佔有率分析、行業趨勢和統計、成長預測(2025-2030 年)
 2024 年潮汐能全球市場報告
 2024年海洋能全球市場報告
 波浪能和潮汐能市場:按產品和最終用戶 - 2025-2030 年全球預測
 波浪能市場:按技術、地點和應用分類 - 2025-2030 年全球預測
 波浪能轉換器市場:按技術、位置和應用分類 - 2025-2030 年全球預測
 全球波浪能市場評估:依技術、應用、地區、機會和預測(2017-2031)
 2024 年至 2028 年全球波浪能與潮汐能市場
 船用電力市場:按類型、應用、區域分類
 到 2030 年波浪能和潮汐能市場預測 - 按組件(渦輪機、發電機、海底電纜和其他組件)、位置、技術、應用、最終用戶和地理位置進行的全球分析