


 |
市場調查報告書
商品編碼
1513406
全球 5G 毫微微基地台市場:按類型、應用程式和最終用戶分類 - 2024-2033 年機會分析和產業預測5G Femtocell Market By Type (IU-H, IMS/SIP), By Application (Indoor, Outdoor), By End User (Residential, Commercial, Public Places): Global Opportunity Analysis and Industry Forecast, 2024-2033 |
||||||
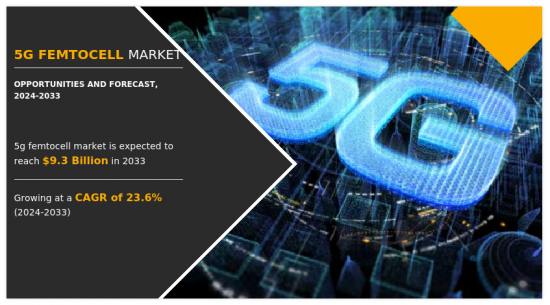
2023年,全球5G毫微微基地台市場規模將達12億美元。
預計到2033年將達到93億美元,2024年至2033年複合年成長率為23.6%。 5G 毫微微基地台用作緊湊型蜂窩基地台,旨在增強建築物和家庭等各種室內環境的室內覆蓋範圍和容量。它利用現有的網際網路連接來擴展 5G 網路的覆蓋範圍,為用戶提供適用於串流媒體、遊戲和物聯網設備等各種應用的可靠、高速連接。透過將流量從大型基地台台轉移並減少網路擁塞,5G毫微微基地台可提高整體網路效能,並為消費者和企業提供無縫連接體驗。
採用人工智慧和機器學習來最佳化網路管理以及採用邊緣運算來減少延遲和提高效能等因素預計將在預測期內推動市場擴張。此外,工業和企業應用專用 5G 網路的激增,加上開放 RAN架構的進步提高了互通性和靈活性,預計將提供大量成長機會。此外,軟體定義網路(SDN)和網路功能虛擬(NFV)的發展以增強擴充性和敏捷性,已成為促進 5G 毫微微基地台市場成長的關鍵因素。
此外,不斷興起的遠距工作文化加上快速的數位化和不斷上升的網路普及率正在推動市場成長。此外,物聯網設備需求的激增預計將在預測期內推動市場成長。然而,監管挑戰、頻寬、安全和隱私問題以及高昂的初始投資成本正在阻礙市場成長。相反,對高效網路卸載和擁塞管理的需求,以及政府不斷採取的促進 5G 基礎設施開拓的舉措預計將為市場成長提供有利的機會。此外,5G 毫微微基地台與智慧城市計畫的整合以及通訊業者和企業之間不斷加強的客製化解決方案合作預計將在未來幾年為 5G 毫微微基地台市場創造許多機會。
5G 毫微微基地台市場研究涵蓋基於類型、應用程式、最終用戶和區域的細分。該報告提供了有關不同類型毫微微基地台的資訊,包括 IU-H 和 IMS/SIP。此外,本研究涵蓋的應用包括室內和室外。此外,住宅、商業和公共設施是報告中詳細討論的主要最終用戶。此外,它還分析了北美、歐洲、亞太、拉丁美洲/中東/非洲等不同地區5G毫微微基地台的當前市場趨勢,並提出了未來的成長機會。
相關人員的主要利益
- 本報告對 2023 年至 2033 年 5G 毫微微基地台市場分析的細分市場、當前趨勢、估計/趨勢和動態進行了定量分析,以確定 5G 毫微微基地台的強大市場機會。
- 我們提供市場研究以及與市場促進因素、市場限制和市場機會相關的資訊。
- 波特的五力分析揭示了買家和供應商的潛力,幫助相關人員做出利潤驅動的業務決策並加強供應商和買家網路。
- 對 5G 毫微微基地台市場細分的詳細分析有助於識別市場機會。
- 每個地區的主要國家都根據其對全球市場的收益貢獻繪製了地圖。
- 市場公司定位有助於基準化分析並提供對市場公司當前地位的清晰了解。
- 該報告包括對區域和全球 5G 毫微微基地台市場趨勢、主要企業、細分市場、應用領域和市場成長策略的分析。
報告可以客製化(可能需要額外費用和時間表,請聯絡您的銷售負責人以了解詳細資訊)。
- 投資機會
- 科技趨勢分析
- 監管指引
- 策略建議
- 針對客戶興趣的其他公司簡介
- SWOT分析
目錄
第1章簡介
第 2 章執行摘要
第3章市場概況
- 市場定義和範圍
- 主要發現
- 影響因素
- 主要投資機會
- 波特五力分析
- 市場動態
- 促進因素
- 擴大5G網路和物聯網設備的部署
- 開發開放式 RAN架構以實現互通性和靈活性
- 抑制因素
- 安全和隱私問題
- 初始實施成本和基礎設施投資較高
- 機會
- 政府加大力度支持5G基礎建設
- 促進因素
第 4 章 5G 毫微微基地台市場:按類型
- 概述
- IU-H
- IMS/SIP
第5章 5G 毫微微基地台市場:依應用分類
- 概述
- 室內的
- 戶外
第 6 章 5G 毫微微基地台市場:依最終用戶分類
- 概述
- 住宅
- 商業的
- 公共設施
第7章 5G 毫微微基地台市場:依地區
- 概述
- 北美洲
- 美國
- 加拿大
- 歐洲
- 英國
- 德國
- 法國
- 西班牙
- 義大利
- 其他
- 亞太地區
- 中國
- 印度
- 日本
- 韓國
- 澳洲
- 馬來西亞
- 其他
- 拉丁美洲/中東/非洲
- 巴西
- 墨西哥
- 沙烏地阿拉伯
- 南非
- 其他
第8章 競爭格局
- 介紹
- 關鍵成功策略
- 10家主要企業產品圖譜
- 競爭對手儀表板
- 競爭熱圖
- 2023年主要企業定位
第9章 公司簡介
- ZTE Corporation
- Fujitsu Limited
- Aricent Inc.
- Nokia Corporation
- Cisco System Inc.
- Huawei Technologies Co. Ltd.
- Samsung Electronics Co Ltd.
- Vodafone Group Plc
- Telefonaktiebolaget LM Ericsson
- Corning Incorporated
In 2023, the global market for 5G femtocells was valued at $1.2 billion. Projected to reach $9.3 billion by 2033, with a CAGR of 23.6% from 2024 to 2033. A 5G femtocell serves as a compact cellular base station engineered to enhance indoor coverage and capacity within various indoor settings, including buildings and homes. It operates by utilizing existing internet connections to extend the range of 5G networks, furnishing users with dependable high-speed connectivity for diverse applications like streaming, gaming, and IoT devices. By diverting traffic from macrocell towers and alleviating network congestion, 5G femtocells augment overall network performance, delivering seamless connectivity experiences for both consumers and businesses.
Factors such as the incorporation of AI and machine learning for optimized network management, along with the adoption of edge computing to diminish latency and bolster performance, are poised to drive market expansion throughout the forecast period. Furthermore, the proliferation of private 5G networks for industrial and enterprise applications, coupled with the advancement of open RAN architectures to enhance interoperability and flexibility, is expected to yield numerous growth opportunities. Additionally, the evolution of software-defined networking (SDN) and network function virtualization (NFV) for enhanced scalability and agility stands as a pivotal factor contributing to the growth of the 5G femtocell market.
Moreover, the rise in remote work culture coupled with rapid digitalization and increase internet penetration, drive the growth of the market. Moreover, a surge in demand for IoT devices is expected to propel the growth of the market during the forecast period. However, regulatory challenges and spectrum availability, security & privacy concerns, and high initial investment costs hamper the growth of the market. On the contrary, the need for efficient network offloading and congestion management as well as rise in government initiatives to boost 5G infrastructure development are expected to provide lucrative opportunities for the market growth. In addition, integration of 5G femtocells with smart city initiatives and growing collaboration between telecom operators and enterprises for customized solutions are anticipated to create numerous opportunities for the 5G femtocell market in the coming years.
The 5G femtocell market scope covers segmentation based on type, application, end user, and region. The report provides information about various types of femtocell such as IU-H and IMS/SIP. In addition, the applications covered in the study include indoor and outdoor. Furthermore, residential, commercial, and public places are the key end users discussed in detail in the report. Moreover, it analyzes the current market trends of 5G femtocells across different regions such as North America, Europe, Asia-Pacific, and LAMEA and suggests future growth opportunities.
This report further outlines the current trends and key areas of investment. In addition, it includes Porter's five forces analysis to understand the competitive scenario of the industry and role of each stakeholder. The report features the strategies adopted by key market players to maintain their foothold in the market. Furthermore, it highlights the competitive landscape of key market players to increase their market share and sustain intense competition in the industry. The key players operating in the 5G femtocell market are Telefonaktiebolaget LM Ericsson, Fujitsu Limited, Aricent, Inc., Nokia Corporation, Cisco System Inc., Huawei Technologies Co. Ltd, Samsung Electronics Co. Ltd, Vodafone Group Plc, Corning Incorporated, and ZTE Corporation.
Key Benefits for Stakeholders
- This report provides a quantitative analysis of the market segments, current trends, estimations, and dynamics of the 5G femtocell market analysis from 2023 to 2033 to identify the prevailing 5G femtocell market opportunities.
- The market research is offered along with information related to key drivers, restraints, and opportunities.
- Porter's five forces analysis highlights the potency of buyers and suppliers to enable stakeholders make profit-oriented business decisions and strengthen their supplier-buyer network.
- In-depth analysis of the 5G femtocell market segmentation assists to determine the prevailing market opportunities.
- Major countries in each region are mapped according to their revenue contribution to the global market.
- Market player positioning facilitates benchmarking and provides a clear understanding of the present position of the market players.
- The report includes the analysis of the regional as well as global 5G femtocell market trends, key players, market segments, application areas, and market growth strategies.
Additional benefits you will get with this purchase are:
- Quarterly Update and* (only available with a corporate license, on listed price)
- 5 additional Company Profile of client Choice pre- or Post-purchase, as a free update.
- Free Upcoming Version on the Purchase of Five and Enterprise User License.
- 16 analyst hours of support* (post-purchase, if you find additional data requirements upon review of the report, you may receive support amounting to 16 analyst hours to solve questions, and post-sale queries)
- 15% Free Customization* (in case the scope or segment of the report does not match your requirements, 15% is equivalent to 3 working days of free work, applicable once)
- Free data Pack on the Five and Enterprise User License. (Excel version of the report)
- Free Updated report if the report is 6-12 months old or older.
- 24-hour priority response*
- Free Industry updates and white papers.
Possible Customization with this report (with additional cost and timeline, please talk to the sales executive to know more)
- Investment Opportunities
- Technology Trend Analysis
- Regulatory Guidelines
- Strategic Recommendations
- Additional company profiles with specific to client's interest
- SWOT Analysis
Key Market Segments
By Type
- IU-H
- IMS/SIP
By Application
- Indoor
- Outdoor
By End User
- Residential
- Commercial
- Public Places
By Region
- North America
- U.S.
- Canada
- Europe
- UK
- Germany
- France
- Spain
- Italy
- Rest of Europe
- Asia-Pacific
- China
- India
- Japan
- South Korea
- Australia
- Malaysia
- Rest of Asia-Pacific
- LAMEA
- Brazil
- Mexico
- Saudi Arabia
- South Africa
- Rest of LAMEA
Key Market Players:
- Fujitsu Limited
- Nokia Corporation
- Huawei Technologies Co. Ltd.
- Vodafone Group Plc
- Corning Incorporated
- Aricent Inc.
- Telefonaktiebolaget LM Ericsson
- Samsung Electronics Co Ltd.
- ZTE Corporation
- Cisco System Inc.
TABLE OF CONTENTS
CHAPTER 1: INTRODUCTION
- 1.1. Report description
- 1.2. Key market segments
- 1.3. Key benefits to the stakeholders
- 1.4. Research methodology
- 1.4.1. Primary research
- 1.4.2. Secondary research
- 1.4.3. Analyst tools and models
CHAPTER 2: EXECUTIVE SUMMARY
- 2.1. CXO perspective
CHAPTER 3: MARKET OVERVIEW
- 3.1. Market definition and scope
- 3.2. Key findings
- 3.2.1. Top impacting factors
- 3.2.2. Top investment pockets
- 3.3. Porter's five forces analysis
- 3.3.1. Low to moderate bargaining power of suppliers
- 3.3.2. Moderate to high threat of new entrants
- 3.3.3. Moderate to high threat of substitutes
- 3.3.4. Moderate to high intensity of rivalry
- 3.3.5. Low to moderate bargaining power of buyers
- 3.4. Market dynamics
- 3.4.1. Drivers
- 3.4.1.1. Increasing deployment of 5G networks and IoT devices
- 3.4.1.2. Development of open RAN architectures for interoperability and flexibility
- 3.4.2. Restraints
- 3.4.2.1. Security and privacy concerns
- 3.4.2.2. High initial deployment costs and infrastructure investment
- 3.4.3. Opportunities
- 3.4.3.1. Growing government initiatives to boost 5G infrastructure development
- 3.4.1. Drivers
CHAPTER 4: 5G FEMTOCELL MARKET, BY TYPE
- 4.1. Overview
- 4.1.1. Market size and forecast
- 4.2. IU-H
- 4.2.1. Key market trends, growth factors and opportunities
- 4.2.2. Market size and forecast, by region
- 4.2.3. Market share analysis by country
- 4.3. IMS/SIP
- 4.3.1. Key market trends, growth factors and opportunities
- 4.3.2. Market size and forecast, by region
- 4.3.3. Market share analysis by country
CHAPTER 5: 5G FEMTOCELL MARKET, BY APPLICATION
- 5.1. Overview
- 5.1.1. Market size and forecast
- 5.2. Indoor
- 5.2.1. Key market trends, growth factors and opportunities
- 5.2.2. Market size and forecast, by region
- 5.2.3. Market share analysis by country
- 5.3. Outdoor
- 5.3.1. Key market trends, growth factors and opportunities
- 5.3.2. Market size and forecast, by region
- 5.3.3. Market share analysis by country
CHAPTER 6: 5G FEMTOCELL MARKET, BY END USER
- 6.1. Overview
- 6.1.1. Market size and forecast
- 6.2. Residential
- 6.2.1. Key market trends, growth factors and opportunities
- 6.2.2. Market size and forecast, by region
- 6.2.3. Market share analysis by country
- 6.3. Commercial
- 6.3.1. Key market trends, growth factors and opportunities
- 6.3.2. Market size and forecast, by region
- 6.3.3. Market share analysis by country
- 6.4. Public Places
- 6.4.1. Key market trends, growth factors and opportunities
- 6.4.2. Market size and forecast, by region
- 6.4.3. Market share analysis by country
CHAPTER 7: 5G FEMTOCELL MARKET, BY REGION
- 7.1. Overview
- 7.1.1. Market size and forecast By Region
- 7.2. North America
- 7.2.1. Key market trends, growth factors and opportunities
- 7.2.2. Market size and forecast, by Type
- 7.2.3. Market size and forecast, by Application
- 7.2.4. Market size and forecast, by End User
- 7.2.5. Market size and forecast, by country
- 7.2.5.1. U.S.
- 7.2.5.1.1. Market size and forecast, by Type
- 7.2.5.1.2. Market size and forecast, by Application
- 7.2.5.1.3. Market size and forecast, by End User
- 7.2.5.2. Canada
- 7.2.5.2.1. Market size and forecast, by Type
- 7.2.5.2.2. Market size and forecast, by Application
- 7.2.5.2.3. Market size and forecast, by End User
- 7.3. Europe
- 7.3.1. Key market trends, growth factors and opportunities
- 7.3.2. Market size and forecast, by Type
- 7.3.3. Market size and forecast, by Application
- 7.3.4. Market size and forecast, by End User
- 7.3.5. Market size and forecast, by country
- 7.3.5.1. UK
- 7.3.5.1.1. Market size and forecast, by Type
- 7.3.5.1.2. Market size and forecast, by Application
- 7.3.5.1.3. Market size and forecast, by End User
- 7.3.5.2. Germany
- 7.3.5.2.1. Market size and forecast, by Type
- 7.3.5.2.2. Market size and forecast, by Application
- 7.3.5.2.3. Market size and forecast, by End User
- 7.3.5.3. France
- 7.3.5.3.1. Market size and forecast, by Type
- 7.3.5.3.2. Market size and forecast, by Application
- 7.3.5.3.3. Market size and forecast, by End User
- 7.3.5.4. Spain
- 7.3.5.4.1. Market size and forecast, by Type
- 7.3.5.4.2. Market size and forecast, by Application
- 7.3.5.4.3. Market size and forecast, by End User
- 7.3.5.5. Italy
- 7.3.5.5.1. Market size and forecast, by Type
- 7.3.5.5.2. Market size and forecast, by Application
- 7.3.5.5.3. Market size and forecast, by End User
- 7.3.5.6. Rest of Europe
- 7.3.5.6.1. Market size and forecast, by Type
- 7.3.5.6.2. Market size and forecast, by Application
- 7.3.5.6.3. Market size and forecast, by End User
- 7.4. Asia-Pacific
- 7.4.1. Key market trends, growth factors and opportunities
- 7.4.2. Market size and forecast, by Type
- 7.4.3. Market size and forecast, by Application
- 7.4.4. Market size and forecast, by End User
- 7.4.5. Market size and forecast, by country
- 7.4.5.1. China
- 7.4.5.1.1. Market size and forecast, by Type
- 7.4.5.1.2. Market size and forecast, by Application
- 7.4.5.1.3. Market size and forecast, by End User
- 7.4.5.2. India
- 7.4.5.2.1. Market size and forecast, by Type
- 7.4.5.2.2. Market size and forecast, by Application
- 7.4.5.2.3. Market size and forecast, by End User
- 7.4.5.3. Japan
- 7.4.5.3.1. Market size and forecast, by Type
- 7.4.5.3.2. Market size and forecast, by Application
- 7.4.5.3.3. Market size and forecast, by End User
- 7.4.5.4. South Korea
- 7.4.5.4.1. Market size and forecast, by Type
- 7.4.5.4.2. Market size and forecast, by Application
- 7.4.5.4.3. Market size and forecast, by End User
- 7.4.5.5. Australia
- 7.4.5.5.1. Market size and forecast, by Type
- 7.4.5.5.2. Market size and forecast, by Application
- 7.4.5.5.3. Market size and forecast, by End User
- 7.4.5.6. Malaysia
- 7.4.5.6.1. Market size and forecast, by Type
- 7.4.5.6.2. Market size and forecast, by Application
- 7.4.5.6.3. Market size and forecast, by End User
- 7.4.5.7. Rest of Asia-Pacific
- 7.4.5.7.1. Market size and forecast, by Type
- 7.4.5.7.2. Market size and forecast, by Application
- 7.4.5.7.3. Market size and forecast, by End User
- 7.5. LAMEA
- 7.5.1. Key market trends, growth factors and opportunities
- 7.5.2. Market size and forecast, by Type
- 7.5.3. Market size and forecast, by Application
- 7.5.4. Market size and forecast, by End User
- 7.5.5. Market size and forecast, by country
- 7.5.5.1. Brazil
- 7.5.5.1.1. Market size and forecast, by Type
- 7.5.5.1.2. Market size and forecast, by Application
- 7.5.5.1.3. Market size and forecast, by End User
- 7.5.5.2. Mexico
- 7.5.5.2.1. Market size and forecast, by Type
- 7.5.5.2.2. Market size and forecast, by Application
- 7.5.5.2.3. Market size and forecast, by End User
- 7.5.5.3. Saudi Arabia
- 7.5.5.3.1. Market size and forecast, by Type
- 7.5.5.3.2. Market size and forecast, by Application
- 7.5.5.3.3. Market size and forecast, by End User
- 7.5.5.4. South Africa
- 7.5.5.4.1. Market size and forecast, by Type
- 7.5.5.4.2. Market size and forecast, by Application
- 7.5.5.4.3. Market size and forecast, by End User
- 7.5.5.5. Rest of LAMEA
- 7.5.5.5.1. Market size and forecast, by Type
- 7.5.5.5.2. Market size and forecast, by Application
- 7.5.5.5.3. Market size and forecast, by End User
CHAPTER 8: COMPETITIVE LANDSCAPE
- 8.1. Introduction
- 8.2. Top winning strategies
- 8.3. Product mapping of top 10 player
- 8.4. Competitive dashboard
- 8.5. Competitive heatmap
- 8.6. Top player positioning, 2023
CHAPTER 9: COMPANY PROFILES
- 9.1. ZTE Corporation
- 9.1.1. Company overview
- 9.1.2. Key executives
- 9.1.3. Company snapshot
- 9.1.4. Operating business segments
- 9.1.5. Product portfolio
- 9.1.6. Business performance
- 9.1.7. Key strategic moves and developments
- 9.2. Fujitsu Limited
- 9.2.1. Company overview
- 9.2.2. Key executives
- 9.2.3. Company snapshot
- 9.2.4. Operating business segments
- 9.2.5. Product portfolio
- 9.2.6. Business performance
- 9.2.7. Key strategic moves and developments
- 9.3. Aricent Inc.
- 9.3.1. Company overview
- 9.3.2. Key executives
- 9.3.3. Company snapshot
- 9.3.4. Operating business segments
- 9.3.5. Product portfolio
- 9.3.6. Business performance
- 9.4. Nokia Corporation
- 9.4.1. Company overview
- 9.4.2. Key executives
- 9.4.3. Company snapshot
- 9.4.4. Operating business segments
- 9.4.5. Product portfolio
- 9.4.6. Business performance
- 9.4.7. Key strategic moves and developments
- 9.5. Cisco System Inc.
- 9.5.1. Company overview
- 9.5.2. Key executives
- 9.5.3. Company snapshot
- 9.5.4. Operating business segments
- 9.5.5. Product portfolio
- 9.5.6. Business performance
- 9.5.7. Key strategic moves and developments
- 9.6. Huawei Technologies Co. Ltd.
- 9.6.1. Company overview
- 9.6.2. Key executives
- 9.6.3. Company snapshot
- 9.6.4. Operating business segments
- 9.6.5. Product portfolio
- 9.6.6. Business performance
- 9.6.7. Key strategic moves and developments
- 9.7. Samsung Electronics Co Ltd.
- 9.7.1. Company overview
- 9.7.2. Key executives
- 9.7.3. Company snapshot
- 9.7.4. Operating business segments
- 9.7.5. Product portfolio
- 9.7.6. Business performance
- 9.7.7. Key strategic moves and developments
- 9.8. Vodafone Group Plc
- 9.8.1. Company overview
- 9.8.2. Key executives
- 9.8.3. Company snapshot
- 9.8.4. Operating business segments
- 9.8.5. Product portfolio
- 9.8.6. Business performance
- 9.8.7. Key strategic moves and developments
- 9.9. Telefonaktiebolaget LM Ericsson
- 9.9.1. Company overview
- 9.9.2. Key executives
- 9.9.3. Company snapshot
- 9.9.4. Operating business segments
- 9.9.5. Product portfolio
- 9.9.6. Business performance
- 9.9.7. Key strategic moves and developments
- 9.10. Corning Incorporated
- 9.10.1. Company overview
- 9.10.2. Key executives
- 9.10.3. Company snapshot
- 9.10.4. Operating business segments
- 9.10.5. Product portfolio
- 9.10.6. Business performance
- 9.10.7. Key strategic moves and developments
LIST OF TABLES
- TABLE 01. GLOBAL 5G FEMTOCELL MARKET, BY TYPE, 2023-2033 ($MILLION)
- TABLE 02. 5G FEMTOCELL MARKET FOR IU-H, BY REGION, 2023-2033 ($MILLION)
- TABLE 03. 5G FEMTOCELL MARKET FOR IMS/SIP, BY REGION, 2023-2033 ($MILLION)
- TABLE 04. GLOBAL 5G FEMTOCELL MARKET, BY APPLICATION, 2023-2033 ($MILLION)
- TABLE 05. 5G FEMTOCELL MARKET FOR INDOOR, BY REGION, 2023-2033 ($MILLION)
- TABLE 06. 5G FEMTOCELL MARKET FOR OUTDOOR, BY REGION, 2023-2033 ($MILLION)
- TABLE 07. GLOBAL 5G FEMTOCELL MARKET, BY END USER, 2023-2033 ($MILLION)
- TABLE 08. 5G FEMTOCELL MARKET FOR RESIDENTIAL, BY REGION, 2023-2033 ($MILLION)
- TABLE 09. 5G FEMTOCELL MARKET FOR COMMERCIAL, BY REGION, 2023-2033 ($MILLION)
- TABLE 10. 5G FEMTOCELL MARKET FOR PUBLIC PLACES, BY REGION, 2023-2033 ($MILLION)
- TABLE 11. 5G FEMTOCELL MARKET, BY REGION, 2023-2033 ($MILLION)
- TABLE 12. NORTH AMERICA 5G FEMTOCELL MARKET, BY TYPE, 2023-2033 ($MILLION)
- TABLE 13. NORTH AMERICA 5G FEMTOCELL MARKET, BY APPLICATION, 2023-2033 ($MILLION)
- TABLE 14. NORTH AMERICA 5G FEMTOCELL MARKET, BY END USER, 2023-2033 ($MILLION)
- TABLE 15. NORTH AMERICA 5G FEMTOCELL MARKET, BY COUNTRY, 2023-2033 ($MILLION)
- TABLE 16. U.S. 5G FEMTOCELL MARKET, BY TYPE, 2023-2033 ($MILLION)
- TABLE 17. U.S. 5G FEMTOCELL MARKET, BY APPLICATION, 2023-2033 ($MILLION)
- TABLE 18. U.S. 5G FEMTOCELL MARKET, BY END USER, 2023-2033 ($MILLION)
- TABLE 19. CANADA 5G FEMTOCELL MARKET, BY TYPE, 2023-2033 ($MILLION)
- TABLE 20. CANADA 5G FEMTOCELL MARKET, BY APPLICATION, 2023-2033 ($MILLION)
- TABLE 21. CANADA 5G FEMTOCELL MARKET, BY END USER, 2023-2033 ($MILLION)
- TABLE 22. EUROPE 5G FEMTOCELL MARKET, BY TYPE, 2023-2033 ($MILLION)
- TABLE 23. EUROPE 5G FEMTOCELL MARKET, BY APPLICATION, 2023-2033 ($MILLION)
- TABLE 24. EUROPE 5G FEMTOCELL MARKET, BY END USER, 2023-2033 ($MILLION)
- TABLE 25. EUROPE 5G FEMTOCELL MARKET, BY COUNTRY, 2023-2033 ($MILLION)
- TABLE 26. UK 5G FEMTOCELL MARKET, BY TYPE, 2023-2033 ($MILLION)
- TABLE 27. UK 5G FEMTOCELL MARKET, BY APPLICATION, 2023-2033 ($MILLION)
- TABLE 28. UK 5G FEMTOCELL MARKET, BY END USER, 2023-2033 ($MILLION)
- TABLE 29. GERMANY 5G FEMTOCELL MARKET, BY TYPE, 2023-2033 ($MILLION)
- TABLE 30. GERMANY 5G FEMTOCELL MARKET, BY APPLICATION, 2023-2033 ($MILLION)
- TABLE 31. GERMANY 5G FEMTOCELL MARKET, BY END USER, 2023-2033 ($MILLION)
- TABLE 32. FRANCE 5G FEMTOCELL MARKET, BY TYPE, 2023-2033 ($MILLION)
- TABLE 33. FRANCE 5G FEMTOCELL MARKET, BY APPLICATION, 2023-2033 ($MILLION)
- TABLE 34. FRANCE 5G FEMTOCELL MARKET, BY END USER, 2023-2033 ($MILLION)
- TABLE 35. SPAIN 5G FEMTOCELL MARKET, BY TYPE, 2023-2033 ($MILLION)
- TABLE 36. SPAIN 5G FEMTOCELL MARKET, BY APPLICATION, 2023-2033 ($MILLION)
- TABLE 37. SPAIN 5G FEMTOCELL MARKET, BY END USER, 2023-2033 ($MILLION)
- TABLE 38. ITALY 5G FEMTOCELL MARKET, BY TYPE, 2023-2033 ($MILLION)
- TABLE 39. ITALY 5G FEMTOCELL MARKET, BY APPLICATION, 2023-2033 ($MILLION)
- TABLE 40. ITALY 5G FEMTOCELL MARKET, BY END USER, 2023-2033 ($MILLION)
- TABLE 41. REST OF EUROPE 5G FEMTOCELL MARKET, BY TYPE, 2023-2033 ($MILLION)
- TABLE 42. REST OF EUROPE 5G FEMTOCELL MARKET, BY APPLICATION, 2023-2033 ($MILLION)
- TABLE 43. REST OF EUROPE 5G FEMTOCELL MARKET, BY END USER, 2023-2033 ($MILLION)
- TABLE 44. ASIA-PACIFIC 5G FEMTOCELL MARKET, BY TYPE, 2023-2033 ($MILLION)
- TABLE 45. ASIA-PACIFIC 5G FEMTOCELL MARKET, BY APPLICATION, 2023-2033 ($MILLION)
- TABLE 46. ASIA-PACIFIC 5G FEMTOCELL MARKET, BY END USER, 2023-2033 ($MILLION)
- TABLE 47. ASIA-PACIFIC 5G FEMTOCELL MARKET, BY COUNTRY, 2023-2033 ($MILLION)
- TABLE 48. CHINA 5G FEMTOCELL MARKET, BY TYPE, 2023-2033 ($MILLION)
- TABLE 49. CHINA 5G FEMTOCELL MARKET, BY APPLICATION, 2023-2033 ($MILLION)
- TABLE 50. CHINA 5G FEMTOCELL MARKET, BY END USER, 2023-2033 ($MILLION)
- TABLE 51. INDIA 5G FEMTOCELL MARKET, BY TYPE, 2023-2033 ($MILLION)
- TABLE 52. INDIA 5G FEMTOCELL MARKET, BY APPLICATION, 2023-2033 ($MILLION)
- TABLE 53. INDIA 5G FEMTOCELL MARKET, BY END USER, 2023-2033 ($MILLION)
- TABLE 54. JAPAN 5G FEMTOCELL MARKET, BY TYPE, 2023-2033 ($MILLION)
- TABLE 55. JAPAN 5G FEMTOCELL MARKET, BY APPLICATION, 2023-2033 ($MILLION)
- TABLE 56. JAPAN 5G FEMTOCELL MARKET, BY END USER, 2023-2033 ($MILLION)
- TABLE 57. SOUTH KOREA 5G FEMTOCELL MARKET, BY TYPE, 2023-2033 ($MILLION)
- TABLE 58. SOUTH KOREA 5G FEMTOCELL MARKET, BY APPLICATION, 2023-2033 ($MILLION)
- TABLE 59. SOUTH KOREA 5G FEMTOCELL MARKET, BY END USER, 2023-2033 ($MILLION)
- TABLE 60. AUSTRALIA 5G FEMTOCELL MARKET, BY TYPE, 2023-2033 ($MILLION)
- TABLE 61. AUSTRALIA 5G FEMTOCELL MARKET, BY APPLICATION, 2023-2033 ($MILLION)
- TABLE 62. AUSTRALIA 5G FEMTOCELL MARKET, BY END USER, 2023-2033 ($MILLION)
- TABLE 63. MALAYSIA 5G FEMTOCELL MARKET, BY TYPE, 2023-2033 ($MILLION)
- TABLE 64. MALAYSIA 5G FEMTOCELL MARKET, BY APPLICATION, 2023-2033 ($MILLION)
- TABLE 65. MALAYSIA 5G FEMTOCELL MARKET, BY END USER, 2023-2033 ($MILLION)
- TABLE 66. REST OF ASIA-PACIFIC 5G FEMTOCELL MARKET, BY TYPE, 2023-2033 ($MILLION)
- TABLE 67. REST OF ASIA-PACIFIC 5G FEMTOCELL MARKET, BY APPLICATION, 2023-2033 ($MILLION)
- TABLE 68. REST OF ASIA-PACIFIC 5G FEMTOCELL MARKET, BY END USER, 2023-2033 ($MILLION)
- TABLE 69. LAMEA 5G FEMTOCELL MARKET, BY TYPE, 2023-2033 ($MILLION)
- TABLE 70. LAMEA 5G FEMTOCELL MARKET, BY APPLICATION, 2023-2033 ($MILLION)
- TABLE 71. LAMEA 5G FEMTOCELL MARKET, BY END USER, 2023-2033 ($MILLION)
- TABLE 72. LAMEA 5G FEMTOCELL MARKET, BY COUNTRY, 2023-2033 ($MILLION)
- TABLE 73. BRAZIL 5G FEMTOCELL MARKET, BY TYPE, 2023-2033 ($MILLION)
- TABLE 74. BRAZIL 5G FEMTOCELL MARKET, BY APPLICATION, 2023-2033 ($MILLION)
- TABLE 75. BRAZIL 5G FEMTOCELL MARKET, BY END USER, 2023-2033 ($MILLION)
- TABLE 76. MEXICO 5G FEMTOCELL MARKET, BY TYPE, 2023-2033 ($MILLION)
- TABLE 77. MEXICO 5G FEMTOCELL MARKET, BY APPLICATION, 2023-2033 ($MILLION)
- TABLE 78. MEXICO 5G FEMTOCELL MARKET, BY END USER, 2023-2033 ($MILLION)
- TABLE 79. SAUDI ARABIA 5G FEMTOCELL MARKET, BY TYPE, 2023-2033 ($MILLION)
- TABLE 80. SAUDI ARABIA 5G FEMTOCELL MARKET, BY APPLICATION, 2023-2033 ($MILLION)
- TABLE 81. SAUDI ARABIA 5G FEMTOCELL MARKET, BY END USER, 2023-2033 ($MILLION)
- TABLE 82. SOUTH AFRICA 5G FEMTOCELL MARKET, BY TYPE, 2023-2033 ($MILLION)
- TABLE 83. SOUTH AFRICA 5G FEMTOCELL MARKET, BY APPLICATION, 2023-2033 ($MILLION)
- TABLE 84. SOUTH AFRICA 5G FEMTOCELL MARKET, BY END USER, 2023-2033 ($MILLION)
- TABLE 85. REST OF LAMEA 5G FEMTOCELL MARKET, BY TYPE, 2023-2033 ($MILLION)
- TABLE 86. REST OF LAMEA 5G FEMTOCELL MARKET, BY APPLICATION, 2023-2033 ($MILLION)
- TABLE 87. REST OF LAMEA 5G FEMTOCELL MARKET, BY END USER, 2023-2033 ($MILLION)
- TABLE 88. ZTE CORPORATION: KEY EXECUTIVES
- TABLE 89. ZTE CORPORATION: COMPANY SNAPSHOT
- TABLE 90. ZTE CORPORATION: SERVICE SEGMENTS
- TABLE 91. ZTE CORPORATION: PRODUCT PORTFOLIO
- TABLE 92. ZTE CORPORATION: KEY STRATEGIES
- TABLE 93. FUJITSU LIMITED: KEY EXECUTIVES
- TABLE 94. FUJITSU LIMITED: COMPANY SNAPSHOT
- TABLE 95. FUJITSU LIMITED: SERVICE SEGMENTS
- TABLE 96. FUJITSU LIMITED: PRODUCT PORTFOLIO
- TABLE 97. FUJITSU LIMITED: KEY STRATEGIES
- TABLE 98. ARICENT INC.: KEY EXECUTIVES
- TABLE 99. ARICENT INC.: COMPANY SNAPSHOT
- TABLE 100. ARICENT INC.: SERVICE SEGMENTS
- TABLE 101. ARICENT INC.: PRODUCT PORTFOLIO
- TABLE 102. NOKIA CORPORATION: KEY EXECUTIVES
- TABLE 103. NOKIA CORPORATION: COMPANY SNAPSHOT
- TABLE 104. NOKIA CORPORATION: SERVICE SEGMENTS
- TABLE 105. NOKIA CORPORATION: PRODUCT PORTFOLIO
- TABLE 106. NOKIA CORPORATION: KEY STRATEGIES
- TABLE 107. CISCO SYSTEM INC.: KEY EXECUTIVES
- TABLE 108. CISCO SYSTEM INC.: COMPANY SNAPSHOT
- TABLE 109. CISCO SYSTEM INC.: SERVICE SEGMENTS
- TABLE 110. CISCO SYSTEM INC.: PRODUCT PORTFOLIO
- TABLE 111. CISCO SYSTEM INC.: KEY STRATEGIES
- TABLE 112. HUAWEI TECHNOLOGIES CO. LTD.: KEY EXECUTIVES
- TABLE 113. HUAWEI TECHNOLOGIES CO. LTD.: COMPANY SNAPSHOT
- TABLE 114. HUAWEI TECHNOLOGIES CO. LTD.: SERVICE SEGMENTS
- TABLE 115. HUAWEI TECHNOLOGIES CO. LTD.: PRODUCT PORTFOLIO
- TABLE 116. HUAWEI TECHNOLOGIES CO. LTD.: KEY STRATEGIES
- TABLE 117. SAMSUNG ELECTRONICS CO LTD.: KEY EXECUTIVES
- TABLE 118. SAMSUNG ELECTRONICS CO LTD.: COMPANY SNAPSHOT
- TABLE 119. SAMSUNG ELECTRONICS CO LTD.: SERVICE SEGMENTS
- TABLE 120. SAMSUNG ELECTRONICS CO LTD.: PRODUCT PORTFOLIO
- TABLE 121. SAMSUNG ELECTRONICS CO LTD.: KEY STRATEGIES
- TABLE 122. VODAFONE GROUP PLC: KEY EXECUTIVES
- TABLE 123. VODAFONE GROUP PLC: COMPANY SNAPSHOT
- TABLE 124. VODAFONE GROUP PLC: SERVICE SEGMENTS
- TABLE 125. VODAFONE GROUP PLC: PRODUCT PORTFOLIO
- TABLE 126. VODAFONE GROUP PLC: KEY STRATEGIES
- TABLE 127. TELEFONAKTIEBOLAGET LM ERICSSON: KEY EXECUTIVES
- TABLE 128. TELEFONAKTIEBOLAGET LM ERICSSON: COMPANY SNAPSHOT
- TABLE 129. TELEFONAKTIEBOLAGET LM ERICSSON: SERVICE SEGMENTS
- TABLE 130. TELEFONAKTIEBOLAGET LM ERICSSON: PRODUCT PORTFOLIO
- TABLE 131. TELEFONAKTIEBOLAGET LM ERICSSON: KEY STRATEGIES
- TABLE 132. CORNING INCORPORATED: KEY EXECUTIVES
- TABLE 133. CORNING INCORPORATED: COMPANY SNAPSHOT
- TABLE 134. CORNING INCORPORATED: SERVICE SEGMENTS
- TABLE 135. CORNING INCORPORATED: PRODUCT PORTFOLIO
- TABLE 136. CORNING INCORPORATED: KEY STRATEGIES
LIST OF FIGURES
- FIGURE 01. 5G FEMTOCELL MARKET, 2023-2033
- FIGURE 02. SEGMENTATION OF 5G FEMTOCELL MARKET,2023-2033
- FIGURE 03. TOP IMPACTING FACTORS IN 5G FEMTOCELL MARKET (2023 TO 2033)
- FIGURE 04. TOP INVESTMENT POCKETS IN 5G FEMTOCELL MARKET (2024-2033)
- FIGURE 05. LOW TO MODERATE BARGAINING POWER OF SUPPLIERS
- FIGURE 06. MODERATE TO HIGH THREAT OF NEW ENTRANTS
- FIGURE 07. MODERATE TO HIGH THREAT OF SUBSTITUTES
- FIGURE 08. MODERATE TO HIGH INTENSITY OF RIVALRY
- FIGURE 09. LOW TO MODERATE BARGAINING POWER OF BUYERS
- FIGURE 10. GLOBAL 5G FEMTOCELL MARKET: DRIVERS, RESTRAINTS AND OPPORTUNITIES
- FIGURE 11. 5G FEMTOCELL MARKET, BY TYPE, 2023 AND 2033(%)
- FIGURE 12. COMPARATIVE SHARE ANALYSIS OF 5G FEMTOCELL MARKET FOR IU-H, BY COUNTRY 2023 AND 2033(%)
- FIGURE 13. COMPARATIVE SHARE ANALYSIS OF 5G FEMTOCELL MARKET FOR IMS/SIP, BY COUNTRY 2023 AND 2033(%)
- FIGURE 14. 5G FEMTOCELL MARKET, BY APPLICATION, 2023 AND 2033(%)
- FIGURE 15. COMPARATIVE SHARE ANALYSIS OF 5G FEMTOCELL MARKET FOR INDOOR, BY COUNTRY 2023 AND 2033(%)
- FIGURE 16. COMPARATIVE SHARE ANALYSIS OF 5G FEMTOCELL MARKET FOR OUTDOOR, BY COUNTRY 2023 AND 2033(%)
- FIGURE 17. 5G FEMTOCELL MARKET, BY END USER, 2023 AND 2033(%)
- FIGURE 18. COMPARATIVE SHARE ANALYSIS OF 5G FEMTOCELL MARKET FOR RESIDENTIAL, BY COUNTRY 2023 AND 2033(%)
- FIGURE 19. COMPARATIVE SHARE ANALYSIS OF 5G FEMTOCELL MARKET FOR COMMERCIAL, BY COUNTRY 2023 AND 2033(%)
- FIGURE 20. COMPARATIVE SHARE ANALYSIS OF 5G FEMTOCELL MARKET FOR PUBLIC PLACES, BY COUNTRY 2023 AND 2033(%)
- FIGURE 21. 5G FEMTOCELL MARKET BY REGION, 2023 AND 2033(%)
- FIGURE 22. U.S. 5G FEMTOCELL MARKET, 2023-2033 ($MILLION)
- FIGURE 23. CANADA 5G FEMTOCELL MARKET, 2023-2033 ($MILLION)
- FIGURE 24. UK 5G FEMTOCELL MARKET, 2023-2033 ($MILLION)
- FIGURE 25. GERMANY 5G FEMTOCELL MARKET, 2023-2033 ($MILLION)
- FIGURE 26. FRANCE 5G FEMTOCELL MARKET, 2023-2033 ($MILLION)
- FIGURE 27. SPAIN 5G FEMTOCELL MARKET, 2023-2033 ($MILLION)
- FIGURE 28. ITALY 5G FEMTOCELL MARKET, 2023-2033 ($MILLION)
- FIGURE 29. REST OF EUROPE 5G FEMTOCELL MARKET, 2023-2033 ($MILLION)
- FIGURE 30. CHINA 5G FEMTOCELL MARKET, 2023-2033 ($MILLION)
- FIGURE 31. INDIA 5G FEMTOCELL MARKET, 2023-2033 ($MILLION)
- FIGURE 32. JAPAN 5G FEMTOCELL MARKET, 2023-2033 ($MILLION)
- FIGURE 33. SOUTH KOREA 5G FEMTOCELL MARKET, 2023-2033 ($MILLION)
- FIGURE 34. AUSTRALIA 5G FEMTOCELL MARKET, 2023-2033 ($MILLION)
- FIGURE 35. MALAYSIA 5G FEMTOCELL MARKET, 2023-2033 ($MILLION)
- FIGURE 36. REST OF ASIA-PACIFIC 5G FEMTOCELL MARKET, 2023-2033 ($MILLION)
- FIGURE 37. BRAZIL 5G FEMTOCELL MARKET, 2023-2033 ($MILLION)
- FIGURE 38. MEXICO 5G FEMTOCELL MARKET, 2023-2033 ($MILLION)
- FIGURE 39. SAUDI ARABIA 5G FEMTOCELL MARKET, 2023-2033 ($MILLION)
- FIGURE 40. SOUTH AFRICA 5G FEMTOCELL MARKET, 2023-2033 ($MILLION)
- FIGURE 41. REST OF LAMEA 5G FEMTOCELL MARKET, 2023-2033 ($MILLION)
- FIGURE 42. TOP WINNING STRATEGIES, BY YEAR (2020-2024)
- FIGURE 43. TOP WINNING STRATEGIES, BY DEVELOPMENT (2020-2024)
- FIGURE 44. TOP WINNING STRATEGIES, BY COMPANY (2020-2024)
- FIGURE 45. PRODUCT MAPPING OF TOP 10 PLAYERS
- FIGURE 46. COMPETITIVE DASHBOARD
- FIGURE 47. COMPETITIVE HEATMAP: 5G FEMTOCELL MARKET
- FIGURE 48. TOP PLAYER POSITIONING, 2023
- FIGURE 49. ZTE CORPORATION: NET REVENUE, 2021-2023 ($MILLION)
- FIGURE 50. ZTE CORPORATION: RESEARCH & DEVELOPMENT EXPENDITURE, 2021-2023 ($MILLION)
- FIGURE 51. ZTE CORPORATION: REVENUE SHARE BY SEGMENT, 2023 (%)
- FIGURE 52. ZTE CORPORATION: REVENUE SHARE BY REGION, 2023 (%)
- FIGURE 53. FUJITSU LIMITED: NET REVENUE, 2020-2022 ($MILLION)
- FIGURE 54. FUJITSU LIMITED: REVENUE SHARE BY SEGMENT, 2022 (%)
- FIGURE 55. FUJITSU LIMITED: REVENUE SHARE BY REGION, 2022 (%)
- FIGURE 56. ARICENT INC.: NET REVENUE, 2021-2023 ($MILLION)
- FIGURE 57. ARICENT INC.: REVENUE SHARE BY REGION, 2023 (%)
- FIGURE 58. NOKIA CORPORATION: NET REVENUE, 2021-2023 ($MILLION)
- FIGURE 59. NOKIA CORPORATION: RESEARCH & DEVELOPMENT EXPENDITURE, 2021-2023 ($MILLION)
- FIGURE 60. NOKIA CORPORATION: REVENUE SHARE BY SEGMENT, 2022 (%)
- FIGURE 61. NOKIA CORPORATION: REVENUE SHARE BY REGION, 2022 (%)
- FIGURE 62. CISCO SYSTEM INC.: RESEARCH & DEVELOPMENT EXPENDITURE, 2020-2022 ($MILLION)
- FIGURE 63. CISCO SYSTEM INC.: NET REVENUE, 2020-2022 ($MILLION)
- FIGURE 64. CISCO SYSTEM INC.: REVENUE SHARE BY SEGMENT, 2022 (%)
- FIGURE 65. CISCO SYSTEM INC.: REVENUE SHARE BY REGION, 2022 (%)
- FIGURE 66. HUAWEI TECHNOLOGIES CO. LTD.: NET REVENUE, 2021-2023 ($MILLION)
- FIGURE 67. HUAWEI TECHNOLOGIES CO. LTD.: REVENUE SHARE BY SEGMENT, 2023 (%)
- FIGURE 68. HUAWEI TECHNOLOGIES CO. LTD.: REVENUE SHARE BY REGION, 2023 (%)
- FIGURE 69. SAMSUNG ELECTRONICS CO LTD.: RESEARCH & DEVELOPMENT EXPENDITURE, 2021-2023 ($MILLION)
- FIGURE 70. SAMSUNG ELECTRONICS CO LTD.: NET REVENUE, 2021-2023 ($MILLION)
- FIGURE 71. SAMSUNG ELECTRONICS CO LTD.: REVENUE SHARE BY REGION, 2023 (%)
- FIGURE 72. SAMSUNG ELECTRONICS CO LTD.: REVENUE SHARE BY SEGMENT, 2023 (%)
- FIGURE 73. VODAFONE GROUP PLC: NET REVENUE, 2020-2022 ($MILLION)
- FIGURE 74. VODAFONE GROUP PLC: REVENUE SHARE BY REGION, 2022 (%)
- FIGURE 75. TELEFONAKTIEBOLAGET LM ERICSSON: NET SALES, 2021-2023 ($MILLION)
- FIGURE 76. TELEFONAKTIEBOLAGET LM ERICSSON: RESEARCH & DEVELOPMENT EXPENDITURE, 2021-2023 ($MILLION)
- FIGURE 77. TELEFONAKTIEBOLAGET LM ERICSSON: REVENUE SHARE BY SEGMENT, 2023 (%)
- FIGURE 78. TELEFONAKTIEBOLAGET LM ERICSSON: REVENUE SHARE BY REGION, 2023 (%)
- FIGURE 79. CORNING INCORPORATED: NET SALES, 2021-2023 ($MILLION)
- FIGURE 80. CORNING INCORPORATED: RESEARCH & DEVELOPMENT EXPENDITURE, 2021-2023
- FIGURE 81. CORNING INCORPORATED: REVENUE SHARE BY SEGMENT, 2023 (%)
- FIGURE 82. CORNING INCORPORATED: REVENUE SHARE BY REGION, 2023 (%)


