

 |
市場調查報告書
商品編碼
1876815
數位孿生市場機會、成長促進因素、產業趨勢分析及預測(2025-2034年)Digital Twin Market Opportunity, Growth Drivers, Industry Trend Analysis, and Forecast 2025 - 2034 |
||||||
2024 年全球數位孿生市場價值為 136 億美元,預計到 2034 年將以 41.4% 的複合年成長率成長至 4,281 億美元。
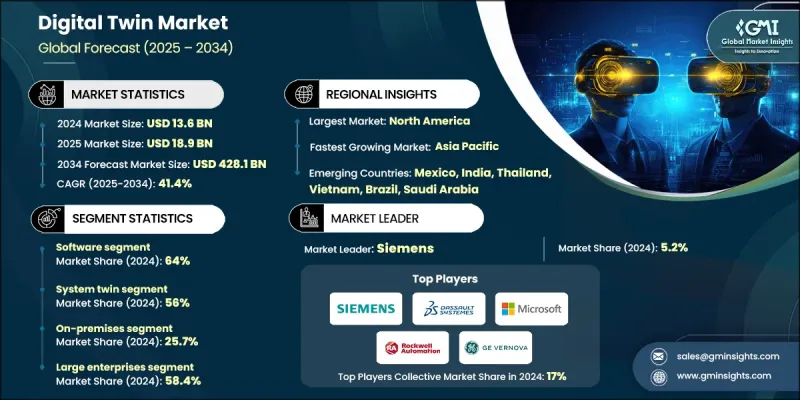
工業4.0的興起推動各行業採用先進技術,旨在提高生產力、營運效率和獲利能力。數位孿生技術使企業能夠利用感測器和網路設備等軟硬體,虛擬複製產品、系統和流程。這些感測器收集即時資料,以可視化系統行為、偵測錯誤並持續監控組件。製造業、航太、交通運輸、電信和能源等行業正在採用數位孿生技術來最佳化維護計劃、降低能耗並減少監控成本。由於仍有相當一部分產業尚未應用這項技術,分析、人工智慧和模擬工具的不斷進步正在為市場參與者創造巨大的機會。
| 市場範圍 | |
|---|---|
| 起始年份 | 2024 |
| 預測年份 | 2025-2034 |
| 起始值 | 136億美元 |
| 預測值 | 4281億美元 |
| 複合年成長率 | 41.4% |
預計到2034年,軟體領域的複合年成長率將達到43.3%。該領域的領先地位反映了數位孿生解決方案的技術密集特性,其價值由模擬軟體、人工智慧功能和進階分析所驅動。軟體平台能夠實現即時同步、預測建模和最佳化,其功能遠超基本的監控功能。
由於系統孿生技術在設計和管理複雜工業裝置(包括生產線、通訊網路和管道系統)方面有著廣泛的應用,預計到2024年,系統孿生技術將佔據56%的市場佔有率。系統孿生技術對於最佳化營運和實現預測性維護至關重要。整體而言,系統孿生技術能夠模擬複雜環境中多個元件和子系統之間的交互作用。
預計到2024年,美國數位孿生市場規模將達到44億美元,使其成為北美最大的市場貢獻者。推動市場成長的主要動力來自企業和政府研究機構在製造業、能源、醫療保健和航太等領域部署的大規模解決方案。雲端平台供應商、工業整合商和託管服務供應商的存在,加速了數位孿生解決方案的普及應用,並縮短了企業實現價值所需的時間。
全球數位孿生市場的主要參與者包括羅克韋爾自動化、達梭系統、西門子、微軟、GE Vernova、亞馬遜網路服務和海克斯康。這些公司正採取多種策略來提升市場佔有率並鞏固自身地位。他們大力投資研發,以改善軟體平台、模擬工具和人工智慧驅動的分析技術,提供更精準、更具可擴展性的解決方案。與工業企業和技術供應商建立策略合作夥伴關係有助於拓展服務範圍並簽訂長期合約。併購使公司能夠整合自身能力、提升市場佔有率並進入新的市場。此外,各公司也致力於提供託管服務、雲端解決方案和行業特定應用,以實現產品差異化。
目錄
第1章:方法論
- 市場範圍和定義
- 研究設計
- 研究方法
- 資料收集方法
- 資料探勘來源
- 全球的
- 地區/國家
- 基準估算和計算
- 基準年計算
- 市場估算的關鍵趨勢
- 初步研究和驗證
- 原始資料
- 預報
- 研究假設和局限性
第2章:執行概要
第3章:行業洞察
- 產業生態系分析
- 供應商格局
- 利潤率
- 成本結構
- 每個階段的價值增加
- 影響價值鏈的因素
- 中斷
- 產業影響因素
- 成長促進因素
- 工業4.0和智慧製造的採用
- 物聯網和感測器技術進步
- AI/ML整合能力
- 預測性維護成本效益
- 產業陷阱與挑戰
- 實施成本高且複雜
- 網路安全和隱私問題
- 市場機遇
- 邊緣運算整合
- 數位孿生即服務模型
- 跨產業平台開發
- 新興市場滲透
- 成長促進因素
- 成長潛力分析
- 監管環境
- 北美洲
- 歐洲
- 亞太地區
- 拉丁美洲
- 中東和非洲
- 波特的分析
- PESTEL 分析
- 技術與創新格局
- 當前技術趨勢
- 新興技術
- 技術路線圖與演進
- 技術採納生命週期分析
- 價格趨勢
- 按地區
- 依產品
- 成本細分分析
- 專利分析
- 永續性和環境方面
- 永續實踐
- 減少廢棄物策略
- 生產中的能源效率
- 環保舉措
- 碳足跡考量
- 風險與韌性分析
- 技術風險評估
- 營運風險管理
- 安全風險框架
- 監理與合規風險
- 財務風險評估
- 韌性建設策略
- 網路安全與資料治理格局
- 網路安全框架
- 威脅情報與監控
- 資料治理框架
- 隱私與合規管理
- 安全架構與設計
- 審計與合規監控
- 人才與技能格局
- 技能差距分析
- 勞動力發展計劃
- 人才招募策略
- 未來技能需求
- 培訓與發展路線圖
- 產學合作
- 案例研究
第4章:競爭格局
- 介紹
- 公司市佔率分析
- 北美洲
- 歐洲
- 亞太地區
- 拉丁美洲
- MEA
- 主要市場參與者的競爭分析
- 競爭定位矩陣
- 戰略展望矩陣
- 關鍵進展
- 併購
- 合作夥伴關係與合作
- 新產品發布
- 擴張計劃和資金
- 供應商選擇標準
第5章:市場估算與預測:依產品類型分類,2021-2034年
- 主要趨勢
- 硬體
- 感應器
- 網路裝置
- 資料儲存和運算設備
- 電力及配套基礎設施
- 控制器
- 其他
- 軟體
- 服務
- 專業服務
- 系統整合
- 培訓與諮詢
- 支援與維護
- 託管服務
- 專業服務
第6章:市場估算與預測:依解法分類,2021-2034年
- 主要趨勢
- 流程孿生
- 雙子系統
- 產品孿生
第7章:市場估算與預測:依部署模式分類,2021-2034年
- 主要趨勢
- 雲
- 現場
- 混合
第8章:市場估算與預測:依企業規模分類,2021-2034年
- 主要趨勢
- 中小企業
- 大型企業
第9章:市場估計與預測:依技術分類,2021-2034年
- 主要趨勢
- 人工智慧和機器學習
- 物聯網和工業物聯網(IIoT)
- 擴增實境(AR)和虛擬實境(VR)
- 區塊鏈
- 其他
第10章:市場估計與預測:依最終用途分類,2021-2034年
- 主要趨勢
- 製造業
- 衛生保健
- 汽車與運輸
- 航太與國防
- 智慧城市
- 能源與公用事業
- 電信
- 其他
第11章:市場估計與預測:按地區分類,2021-2034年
- 主要趨勢
- 北美洲
- 美國
- 加拿大
- 歐洲
- 德國
- 英國
- 法國
- 義大利
- 西班牙
- 俄羅斯
- 北歐
- 比荷盧經濟聯盟
- 亞太地區
- 中國
- 印度
- 日本
- 韓國
- 澳新銀行
- 新加坡
- 馬來西亞
- 印尼
- 越南
- 泰國
- 拉丁美洲
- 巴西
- 墨西哥
- 阿根廷
- 哥倫比亞
- MEA
- 南非
- 沙烏地阿拉伯
- 阿拉伯聯合大公國
第12章:公司簡介
- Global companies
- Siemens
- GE Vernova
- Microsoft
- PTC
- Dassault Systemes
- Autodesk
- Rockwell Automation
- Ansys
- SAP
- Honeywell International
- Regional companies
- Accenture
- Infosys
- Tata Consultancy Services
- Wipro
- Atos
- NTT Data
- Fujitsu
- Ericsson
- Nokia
- DXC Technology
- Emerging companies
- Unity Technologies
- Bentley Systems
- Emerson Electric
- Hexagon
- C3.ai
The Global Digital Twin Market was valued at USD 13.6 billion in 2024 and is estimated to grow at a CAGR of 41.4% to reach USD 428.1 billion by 2034.
The rise of Industry 4.0 has driven industries to adopt advanced technologies aimed at improving productivity, operational efficiency, and profitability. Digital twin technology enables companies to virtually replicate products, systems, and processes, leveraging hardware and software such as sensors and networking devices. These sensors collect real-time data to visualize system behavior, detect errors, and monitor components continuously. Sectors such as manufacturing, aerospace, transportation, telecommunications, and energy are adopting digital twins to optimize maintenance schedules, lower energy consumption, and reduce monitoring costs. With a large portion of industries yet to implement this technology, continuous advancements in analytics, artificial intelligence, and simulation tools are creating significant opportunities for market players.
| Market Scope | |
|---|---|
| Start Year | 2024 |
| Forecast Year | 2025-2034 |
| Start Value | $13.6 Billion |
| Forecast Value | $428.1 Billion |
| CAGR | 41.4% |
The software segment is expected to grow at a CAGR of 43.3% through 2034. This segment's leadership reflects the technology-intensive nature of digital twin solutions, where value is driven by simulation software, AI capabilities, and advanced analytics. Software platforms enable real-time synchronization, predictive modeling, and optimization, offering functionalities that go far beyond basic monitoring.
The system twin segment held a 56% share in 2024 owing to its extensive application in designing and managing complex industrial setups, including manufacturing lines, communication networks, and piping systems. System twins are crucial for optimizing operations and enabling predictive maintenance. Overall, system twins can simulate interactions between multiple components and subsystems in complex environments.
U.S. Digital Twin Market reached USD 4.4 billion in 2024, making the country the largest contributor in North America. Growth is driven by enterprises and government research facilities deploying large-scale solutions across manufacturing, energy, healthcare, and aerospace sectors. The presence of cloud platform providers, industrial integrators, and managed service offerings accelerates adoption and reduces time-to-value for organizations implementing digital twin solutions.
Key players operating in the Global Digital Twin Market include Rockwell Automation, Dassault Systemes, Siemens, Microsoft, GE Vernova, Amazon Web Services, and Hexagon. Companies in the Global Digital Twin Market are employing multiple strategies to enhance their market presence and strengthen their foothold. They are investing heavily in R&D to improve software platforms, simulation tools, and AI-driven analytics for more accurate and scalable solutions. Strategic partnerships with industrial enterprises and technology providers help expand service offerings and secure long-term contracts. Mergers and acquisitions allow companies to consolidate capabilities, increase market share, and enter new geographies. Firms are also focusing on providing managed services, cloud-based solutions, and industry-specific applications to differentiate their products.
Table of Contents
Chapter 1 Methodology
- 1.1 Market scope and definition
- 1.2 Research design
- 1.2.1 Research approach
- 1.2.2 Data collection methods
- 1.3 Data mining sources
- 1.3.1 Global
- 1.3.2 Regional/Country
- 1.4 Base estimates and calculations
- 1.4.1 Base year calculation
- 1.4.2 Key trends for market estimation
- 1.5 Primary research and validation
- 1.5.1 Primary sources
- 1.6 Forecast
- 1.7 Research assumptions and limitations
Chapter 2 Executive Summary
- 2.1 Industry 3600 synopsis
- 2.2 Key market trends
- 2.2.1 Regional
- 2.2.2 Offering
- 2.2.3 Solution
- 2.2.4 Deployment mode
- 2.2.5 Enterprise size
- 2.2.6 Technology
- 2.2.7 End use
- 2.3 TAM analysis, 2025-2034
- 2.4 CXO perspectives: Strategic imperatives
- 2.4.1 Executive decision points
- 2.4.2 Critical success factors
- 2.5 Future outlook and recommendations
Chapter 3 Industry Insights
- 3.1 Industry ecosystem analysis
- 3.1.1 Supplier landscape
- 3.1.2 Profit margin
- 3.1.3 Cost structure
- 3.1.4 Value addition at each stage
- 3.1.5 Factor affecting the value chain
- 3.1.6 Disruptions
- 3.2 Industry impact forces
- 3.2.1 Growth drivers
- 3.2.1.1 Industry 4.0 & smart manufacturing adoption
- 3.2.1.2 IoT & sensor technology advancement
- 3.2.1.3 AI/ML integration capabilities
- 3.2.1.4 Predictive maintenance cost benefits
- 3.2.2 Industry pitfalls and challenges
- 3.2.2.1 High implementation costs & complexity
- 3.2.2.2 Cybersecurity & privacy concerns
- 3.2.3 Market opportunities
- 3.2.3.1 Edge computing integration
- 3.2.3.2 Digital twin-as-a-service models
- 3.2.3.3 Cross-industry platform development
- 3.2.3.4 Emerging market penetration
- 3.2.1 Growth drivers
- 3.3 Growth potential analysis
- 3.4 Regulatory landscape
- 3.4.1 North America
- 3.4.2 Europe
- 3.4.3 Asia Pacific
- 3.4.4 Latin America
- 3.4.5 Middle East & Africa
- 3.5 Porter's analysis
- 3.6 PESTEL analysis
- 3.7 Technology and innovation landscape
- 3.7.1 Current technological trends
- 3.7.2 Emerging technologies
- 3.7.3 Technology roadmaps & evolution
- 3.7.4 Technology adoption lifecycle analysis
- 3.8 Price trends
- 3.8.1 By region
- 3.8.2 By product
- 3.9 Cost breakdown analysis
- 3.10 Patent analysis
- 3.11 Sustainability and environmental aspects
- 3.11.1 Sustainable practices
- 3.11.2 Waste reduction strategies
- 3.11.3 Energy efficiency in production
- 3.11.4 Eco-friendly initiatives
- 3.12 Carbon footprint considerations
- 3.13 Risk & Resilience Analysis
- 3.13.1 Technology Risk Assessment
- 3.13.2 Operational Risk Management
- 3.13.3 Security Risk Framework
- 3.13.4 Regulatory & Compliance Risks
- 3.13.5 Financial Risk Assessment
- 3.13.6 Resilience Building Strategies
- 3.14 Cybersecurity & Data Governance Landscape
- 3.14.1 Cybersecurity Framework
- 3.14.2 Threat Intelligence & Monitoring
- 3.14.3 Data Governance Framework
- 3.14.4 Privacy & Compliance Management
- 3.14.5 Security Architecture & Design
- 3.14.6 Audit & Compliance Monitoring
- 3.15 Talent & Skills Landscape
- 3.15.1 Skills Gap Analysis
- 3.15.2 Workforce Development Programs
- 3.15.3 Talent Acquisition Strategies
- 3.15.4 Future Skills Requirements
- 3.15.5 Training & Development Roadmap
- 3.15.6 Industry-Academia Collaboration
- 3.16 Case Studies
Chapter 4 Competitive Landscape, 2024
- 4.1 Introduction
- 4.2 Company market share analysis
- 4.2.1 North America
- 4.2.2 Europe
- 4.2.3 Asia Pacific
- 4.2.4 LATAM
- 4.2.5 MEA
- 4.3 Competitive analysis of major market players
- 4.4 Competitive positioning matrix
- 4.5 Strategic outlook matrix
- 4.6 Key developments
- 4.6.1 Mergers & acquisitions
- 4.6.2 Partnerships & collaborations
- 4.6.3 New product launches
- 4.6.4 Expansion plans and funding
- 4.7 Vendor selection criteria
Chapter 5 Market Estimates & Forecast, By Offering, 2021 - 2034 ($Mn)
- 5.1 Key trends
- 5.2 Hardware
- 5.2.1 Sensors
- 5.2.2 Networking devices
- 5.2.3 Data storage & computing devices
- 5.2.4 Power & Support Infrastructure
- 5.2.5 Controllers
- 5.2.6 Others
- 5.3 Software
- 5.4 Services
- 5.4.1 Professional Services
- 5.4.1.1 System integration
- 5.4.1.2 Training & Consulting
- 5.4.1.3 Support & maintenance
- 5.4.2 Managed Services
- 5.4.1 Professional Services
Chapter 6 Market Estimates & Forecast, By Solution, 2021 - 2034 ($Mn)
- 6.1 Key trends
- 6.2 Process Twin
- 6.3 System Twin
- 6.4 Product Twin
Chapter 7 Market Estimates & Forecast, By Deployment Mode, 2021 - 2034 ($Mn)
- 7.1 Key trends
- 7.2 Cloud
- 7.3 On-premises
- 7.4 Hybrid
Chapter 8 Market Estimates & Forecast, By Enterprise Size, 2021 - 2034 ($Mn)
- 8.1 Key trends
- 8.2 SME
- 8.3 Large Enterprises
Chapter 9 Market Estimates & Forecast, By Technology, 2021 - 2034 ($Mn)
- 9.1 Key trends
- 9.2 Artificial Intelligence and Machine Learning
- 9.3 IoT and Industrial IoT (IIoT)
- 9.4 Augmented Reality (AR) and Virtual Reality (VR)
- 9.5 Blockchain
- 9.6 Others
Chapter 10 Market Estimates & Forecast, By End Use, 2021 - 2034 ($Mn)
- 10.1 Key trends
- 10.2 Manufacturing
- 10.3 Healthcare
- 10.4 Automotive and Transportation
- 10.5 Aerospace and Defense
- 10.6 Smart Cities
- 10.7 Energy and Utilities
- 10.8 Telecommunications
- 10.9 Others
Chapter 11 Market Estimates & Forecast, By Region, 2021 - 2034 ($Mn)
- 11.1 Key trends
- 11.2 North America
- 11.2.1 US
- 11.2.2 Canada
- 11.3 Europe
- 11.3.1 Germany
- 11.3.2 UK
- 11.3.3 France
- 11.3.4 Italy
- 11.3.5 Spain
- 11.3.6 Russia
- 11.3.7 Nordics
- 11.3.8 Benelux
- 11.4 Asia Pacific
- 11.4.1 China
- 11.4.2 India
- 11.4.3 Japan
- 11.4.4 South Korea
- 11.4.5 ANZ
- 11.4.6 Singapore
- 11.4.7 Malaysia
- 11.4.8 Indonesia
- 11.4.9 Vietnam
- 11.4.10 Thailand
- 11.5 Latin America
- 11.5.1 Brazil
- 11.5.2 Mexico
- 11.5.3 Argentina
- 11.5.4 Colombia
- 11.6 MEA
- 11.6.1 South Africa
- 11.6.2 Saudi Arabia
- 11.6.3 UAE
Chapter 12 Company Profiles
- 12.1 Global companies
- 12.1.1 Siemens
- 12.1.2 GE Vernova
- 12.1.3 Microsoft
- 12.1.4 PTC
- 12.1.5 Dassault Systemes
- 12.1.6 Autodesk
- 12.1.7 Rockwell Automation
- 12.1.8 Ansys
- 12.1.9 SAP
- 12.1.10 Honeywell International
- 12.2 Regional companies
- 12.2.1 Accenture
- 12.2.2 Infosys
- 12.2.3 Tata Consultancy Services
- 12.2.4 Wipro
- 12.2.5 Atos
- 12.2.6 NTT Data
- 12.2.7 Fujitsu
- 12.2.8 Ericsson
- 12.2.9 Nokia
- 12.2.10 DXC Technology
- 12.3 Emerging companies
- 12.3.1 Unity Technologies
- 12.3.2 Bentley Systems
- 12.3.3 Emerson Electric
- 12.3.4 Hexagon
- 12.3.5 C3.ai
 2026-2034年全球航太航太數位訊號處理器市場規模、佔有率、趨勢與成長分析報告
 數位孿生市場預測至2034年—按組件、部署模式、應用、最終用戶和地區分類的全球分析
 數位雙胞胎市場:按組件、類型、技術、企業規模、應用和最終用戶分類-2026-2032年全球市場預測
 2026年全球垂直起降機場數位雙胞胎市場報告2026年全球車聯網(V2X)數位雙胞胎分析市場報告2026年全球門區數位雙胞胎市場報告2034年交通運輸業數位雙胞胎市場預測-全球分析(依孿生類型、交通途徑、技術、部署模式、應用、最終用戶和地區分類)數位雙胞胎市場預測(自動化領域)至 2034 年-全球分析(按組件、部署模式、產業、應用、最終用戶和地區分類)數位雙胞胎系統市場預測至2034年-按類型、技術、應用、最終用戶和地區分類的全球分析認知數位雙胞胎智慧市場預測至2034年:按組件、部署模式、技術、應用、最終用戶和地區分類的全球分析