


 |
市場調查報告書
商品編碼
1665031
無線條形音箱市場機會、成長動力、產業趨勢分析與 2024 - 2032 年預測Wireless Soundbar Market Opportunity, Growth Drivers, Industry Trend Analysis, and Forecast 2024 - 2032 |
||||||
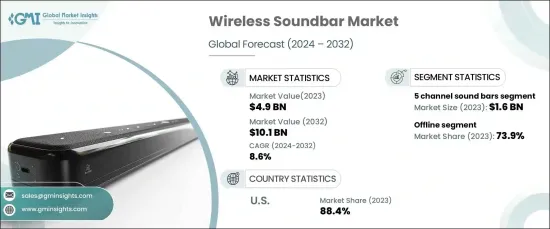
2023 年全球無線條形音箱市場價值為 49 億美元,預計將經歷強勁成長,2024 年至 2032 年的複合年成長率為 8.6%。這些先進的音響系統與現代設備無縫整合,提供無與倫比的音訊體驗,引起當今精通技術的消費者的共鳴。
技術創新是這一成長背後的重要力量。多房間音訊功能、杜比全景聲支援和語音助理整合等功能使條形音箱成為發燒友和技術愛好者必備的設備。此外,新興市場的可支配收入不斷增加和城市化進程加快,也擴大了高階無線條形音箱的受眾。電子商務平台的激增也使得這些產品更容易獲得,為全球消費者提供了廣泛的選擇,進一步推動了市場成長。
| 市場範圍 | |
|---|---|
| 起始年份 | 2023 |
| 預測年份 | 2024-2032 |
| 起始值 | 49億美元 |
| 預測值 | 101億美元 |
| 複合年成長率 | 8.6% |
在各種類型的條形音箱中,5 聲道部分處於領先地位,到 2023 年將創造 16 億美元的收入。這些條形音箱適合那些尋求身臨其境但又簡單的音訊體驗的人,提供包括標準左、右和中置聲道以及兩個額外的後置或環繞聲道的配置。結果是動態且豐富的聲音環境,無需成熟的家庭劇院設置即可增強整體家庭娛樂體驗。
市場也受到分銷管道的影響,到 2023 年,線下銷售將佔據 73.9% 的市場佔有率。實體零售店為消費者提供了透過簡報設定親自測試音質的機會,讓他們可以在做出購買決定之前用自己的媒體內容評估表現。
在美國,無線條形音箱市場在 2023 年佔據了令人印象深刻的 88.4% 的佔有率,預計在預測期內的複合年成長率為 8.5%。美國憑藉其蓬勃發展的消費性電子產業和家庭娛樂系統的廣泛普及引領全球市場。串流媒體服務和智慧電視的日益普及繼續推動對高品質無線音訊解決方案的需求,將條形音箱定位為增強家庭娛樂體驗的首選。
目錄
第 1 章:方法論與範圍
- 市場範圍和定義
- 基礎估算與計算
- 預測計算
- 資料來源
- 基本的
- 次要
- 付費來源
- 公共資源
第 2 章:執行摘要
第 3 章:產業洞察
- 產業生態系統分析
- 影響價值鏈的因素
- 利潤率分析
- 中斷
- 未來展望
- 製造商
- 經銷商
- 供應商概況
- 利潤率分析
- 重要新聞及舉措
- 監管格局
- 衝擊力
- 成長動力
- 家庭娛樂系統需求不斷成長
- 技術進步和智慧功能的整合
- 平面電視的普及率不斷提高
- 產業陷阱與挑戰
- 高階長條音箱的成本較高
- 與舊設備的兼容性問題
- 成長動力
- 成長潛力分析
- 波特的分析
- PESTEL 分析
第4章:競爭格局
- 介紹
- 公司市佔率分析
- 競爭定位矩陣
- 戰略展望矩陣
第 5 章:市場估計與預測:按產品類型,2021-2032 年
- 主要趨勢
- 雙聲道長條音箱
- 3 聲道長條音箱
- 5 聲道長條音箱
- 7 聲道長條音箱
第6章:市場估計與預測:依連結性,2021-2032 年
- 主要趨勢
- 藍牙
- 無線上網
第 7 章:市場估計與預測:按安裝類型,2021-2032 年
- 主要趨勢
- 壁掛式
- 桌面
- 獨立式
第 8 章:市場估計與預測:按揚聲器瓦數,2021 年至 2032 年
- 主要趨勢
- 高達 99 瓦
- 100-199瓦
- 200-499瓦
- 500-799 瓦
- 800 瓦以上
第9章:市場估計與預測:依價格範圍,2021-2032 年
- 主要趨勢
- 低的
- 中等的
- 高的
第 10 章:市場估計與預測:按規模,2021-2032 年
- 主要趨勢
- 30 吋以下
- 30-60英寸
- 60 吋以上
第 11 章:市場估計與預測:按應用,2021 年至 2032 年
- 主要趨勢
- 住宅
- 商業的
第 12 章:市場估計與預測:按配銷通路,2021-2032 年
- 主要趨勢
- 線上
- 電子商務
- 公司網站
- 離線
- 大賣場/超市
- 專賣店
- 其他零售店
第 13 章:市場估計與預測:按地區,2021-2032 年
- 主要趨勢
- 北美洲
- 美國
- 加拿大
- 歐洲
- 英國
- 德國
- 法國
- 義大利
- 西班牙
- 亞太地區
- 中國
- 印度
- 日本
- 韓國
- 澳洲
- 拉丁美洲
- 巴西
- 墨西哥
- 中東及非洲
- 南非
- 沙烏地阿拉伯
- 阿拉伯聯合大公國
第 14 章:公司簡介
- Bose
- Bowers & Wilkins
- Klipsch
- LG Electronics
- Panasonic
- Philips
- Pioneer
- Polk Audio (Sound United)
- Samsung Electronics
- Sennheiser
- Sonos
- Sony
- TCL Technology Group
- VIZIO
- Yamaha
The Global Wireless Soundbar Market, valued at USD 4.9 billion in 2023, is set to experience robust growth with a projected CAGR of 8.6% from 2024 to 2032. This expansion is driven by the increasing adoption of smart TVs and home entertainment systems, fueling the demand for cutting-edge wireless audio solutions. These advanced sound systems seamlessly integrate with modern devices, delivering an unparalleled audio experience that resonates with today's tech-savvy consumers.
Technological innovations are a significant force behind this growth. Features like multi-room audio capabilities, Dolby Atmos support, and voice assistant integration have elevated soundbars into must-have gadgets for audiophiles and tech enthusiasts alike. Additionally, rising disposable incomes and rapid urbanization in emerging markets are expanding the audience for premium wireless soundbars. The surge in e-commerce platforms has also made these products more accessible, connecting global consumers to a wide range of options and further propelling market growth.
| Market Scope | |
|---|---|
| Start Year | 2023 |
| Forecast Year | 2024-2032 |
| Start Value | $4.9 Billion |
| Forecast Value | $10.1 Billion |
| CAGR | 8.6% |
Among the various types of soundbars, the 5-channel segment leads the pack, generating USD 1.6 billion in revenue in 2023. This segment is forecasted to grow at a CAGR of 8.9% during the same period. These soundbars cater to those seeking an immersive yet uncomplicated audio experience, offering configurations that include standard left, right, and center channels, along with two additional rear or surround channels. The result is a dynamic and rich sound environment that enhances the overall home entertainment experience without the need for a full-fledged home theater setup.
The market is also shaped by distribution channels, with offline sales dominating at 73.9% of the market share in 2023. This segment is expected to grow at a CAGR of 8.5% from 2024 to 2032. A key factor in this dominance is the emphasis on in-store experiences. Physical retail outlets provide consumers the opportunity to test sound quality firsthand through demonstration setups, allowing them to evaluate the performance with their own media content before making a purchase decision.
In the United States, the wireless soundbar market commanded an impressive 88.4% share in 2023 and is projected to grow at a CAGR of 8.5% over the forecast period. The U.S. leads the global market thanks to its thriving consumer electronics industry and the widespread popularity of home entertainment systems. The increasing adoption of streaming services and smart TVs continues to drive the demand for high-quality, wireless audio solutions, positioning soundbars as the preferred choice for enhancing the home entertainment experience.
Table of Contents
Chapter 1 Methodology & Scope
- 1.1 Market scope & definitions
- 1.2 Base estimates & calculations
- 1.3 Forecast calculations
- 1.4 Data sources
- 1.4.1 Primary
- 1.4.2 Secondary
- 1.4.2.1 Paid sources
- 1.4.2.2 Public sources
Chapter 2 Executive Summary
- 2.1 Industry 3600 synopsis, 2021-2032
Chapter 3 Industry Insights
- 3.1 Industry ecosystem analysis
- 3.1.1 Factor affecting the value chain
- 3.1.2 Profit margin analysis
- 3.1.3 Disruptions
- 3.1.4 Future outlook
- 3.1.5 Manufacturers
- 3.1.6 Distributors
- 3.2 Supplier landscape
- 3.3 Profit margin analysis
- 3.4 Key news & initiatives
- 3.5 Regulatory landscape
- 3.6 Impact forces
- 3.6.1 Growth drivers
- 3.6.1.1 Increasing demand for home entertainment systems
- 3.6.1.2 Technological advancements and integration of smart features
- 3.6.1.3 Growing adoption of flat panel TVs
- 3.6.2 Industry pitfalls & challenges
- 3.6.2.1 High cost of premium soundbars
- 3.6.2.2 Compatibility issues with older devices
- 3.6.1 Growth drivers
- 3.7 Growth potential analysis
- 3.8 Porter’s analysis
- 3.9 PESTEL analysis
Chapter 4 Competitive Landscape, 2023
- 4.1 Introduction
- 4.2 Company market share analysis
- 4.3 Competitive positioning matrix
- 4.4 Strategic outlook matrix
Chapter 5 Market Estimates & Forecast, By Product Type, 2021-2032 (USD Billion)
- 5.1 Key trends
- 5.2 2 channel sound bars
- 5.3 3 channel sound bars
- 5.4 5 channel sound bars
- 5.5 7 channel sound bars
Chapter 6 Market Estimates & Forecast, By Connectivity, 2021-2032 (USD Billion)
- 6.1 Key trends
- 6.2 Bluetooth
- 6.3 Wi-fi
Chapter 7 Market Estimates & Forecast, By Installation Type, 2021-2032 (USD Billion)
- 7.1 Key trends
- 7.2 Wall mounted
- 7.3 Tabletop
- 7.4 Free standing
Chapter 8 Market Estimates & Forecast, By Speaker Wattage, 2021-2032 (USD Billion)
- 8.1 Key trends
- 8.2 Up to 99 watts
- 8.3 100-199 watts
- 8.4 200-499 watts
- 8.5 500-799 watts
- 8.6 Above 800 watts
Chapter 9 Market Estimates & Forecast, By Price Range, 2021-2032 (USD Billion)
- 9.1 Key trends
- 9.2 Low
- 9.3 Medium
- 9.4 High
Chapter 10 Market Estimates & Forecast, By Size, 2021-2032 (USD Billion)
- 10.1 Key trends
- 10.2 Under 30 inches
- 10.3 30-60 inches
- 10.4 Above 60 inches
Chapter 11 Market Estimates & Forecast, By Application, 2021-2032 (USD Billion)
- 11.1 Key trends
- 11.2 Residential
- 11.3 Commercial
Chapter 12 Market Estimates & Forecast, By Distribution Channel, 2021-2032 (USD Billion)
- 12.1 Key trends
- 12.2 Online
- 12.2.1 E-commerce
- 12.2.2 Company websites
- 12.3 Offline
- 12.3.1 Hypermarkets/Supermarkets
- 12.3.2 Specialty stores
- 12.3.3 Other retail stores
Chapter 13 Market Estimates & Forecast, By Region, 2021-2032 (USD Billion)
- 13.1 Key trends
- 13.2 North America
- 13.2.1 U.S.
- 13.2.2 Canada
- 13.3 Europe
- 13.3.1 UK
- 13.3.2 Germany
- 13.3.3 France
- 13.3.4 Italy
- 13.3.5 Spain
- 13.4 Asia Pacific
- 13.4.1 China
- 13.4.2 India
- 13.4.3 Japan
- 13.4.4 South Korea
- 13.4.5 Australia
- 13.5 Latin America
- 13.5.1 Brazil
- 13.5.2 Mexico
- 13.6 MEA
- 13.6.1 South Africa
- 13.6.2 Saudi Arabia
- 13.6.3 UAE
Chapter 14 Company Profiles
- 14.1 Bose
- 14.2 Bowers & Wilkins
- 14.3 Klipsch
- 14.4 LG Electronics
- 14.5 Panasonic
- 14.6 Philips
- 14.7 Pioneer
- 14.8 Polk Audio (Sound United)
- 14.9 Samsung Electronics
- 14.10 Sennheiser
- 14.11 Sonos
- 14.12 Sony
- 14.13 TCL Technology Group
- 14.14 VIZIO
- 14.15 Yamaha
 條形音箱市場規模、佔有率和成長分析(按類型、性別、安裝方式、配銷通路、應用和地區)- 2025-2032 年行業預測
 2025 年至 2033 年條形音箱市場報告(按類型、安裝方法、連接性、應用和地區)
 全球條形音箱市場:按類型、連接性、安裝方法、應用和最終用途 - 預測 2025-2030
 Soundbar 市場 - 全球產業規模、佔有率、趨勢、機會和預測,按安裝類型、連接性、銷售管道、地區和競爭細分,2019-2029 年
 Soundbar 市場、機會、成長動力、產業趨勢分析與預測,2024-2032 年
 Soundbars 市場(產品:2.1 聲道、5.1 聲道、7.1 聲道等;以及連接:Wi-Fi、藍牙等)- 2024-2034 年全球產業分析、規模、佔有率、成長、趨勢和預測