


 |
市場調查報告書
商品編碼
1665083
智慧奈米建築材料市場機會、成長動力、產業趨勢分析及 2024 - 2032 年預測Smart Nano-Construction Materials Market Opportunity, Growth Drivers, Industry Trend Analysis, and Forecast 2024 - 2032 |
||||||
2023 年全球智慧奈米建築材料市場估值達到 125 億美元,預計 2024 年至 2032 年期間的複合年成長率為 4.5%。這些創新具有自我修復能力、增強的耐用性和更好的隔熱性等優勢,所有這些都提高了建築項目的壽命和性能。隨著這些材料變得越來越複雜,它們不僅提高了建築標準,而且還滿足了對節能和環境永續建築解決方案日益成長的需求。這種轉變符合全球永續發展目標,因為這些先進的材料可以幫助減少能源消耗並降低現代建築對環境的影響。
綠色節能建築的需求加速了智慧奈米建築材料的採用。這些材料越來越受到青睞,因為它們能夠提高建築物的能源效率和結構完整性,有助於大幅降低能源成本和排放。智慧奈米建築材料在塑造建築業的未來方面發揮著至關重要的作用,有助於實現永續發展目標,同時確保建築物在更長的時間內保持耐用性和功能性。
| 市場範圍 | |
|---|---|
| 起始年份 | 2023 |
| 預測年份 | 2024-2032 |
| 起始值 | 125億美元 |
| 預測值 | 185億美元 |
| 複合年成長率 | 4.5% |
就材料類型而言,市場分為兩個主要部分:主動智慧材料和被動智慧材料。 2023 年,被動智慧材料佔據市場主導地位,價值達 75 億美元。預計該部分在預測期內的複合年成長率為 4.2%。自修復混凝土和隔熱奈米複合材料等被動智慧材料無需外部控制系統即可自主提高建築物的性能。
這些材料的分銷管道也在不斷發展,人們明顯傾向於直接分銷方式。 2023 年,直接配銷通路佔據了 51.5% 的市場佔有率,預計 2024 年至 2032 年期間的複合年成長率為 4.6%。此外,它還能確保專業產品及時進入市場,進而提高整體市場的覆蓋率和滲透率。
美國智慧奈米建築材料市場在 2023 年的價值為 25 億美元,預計在 2024 年至 2032 年期間的複合年成長率為 4.6%。政府支持綠色建築實踐的舉措進一步推動了美國採用智慧奈米建築材料,加強了國家對創造永續和耐用建築的承諾。
目錄
第 1 章:方法論與範圍
- 市場範圍和定義
- 基礎估算與計算
- 預測參數
- 資料來源
- 基本的
- 次要
- 付費來源
- 公共資源
第 2 章:執行摘要
第 3 章:產業洞察
- 產業生態系統分析
- 影響價值鏈的因素
- 利潤率分析
- 中斷
- 未來展望
- 製造商
- 經銷商
- 供應商概況
- 利潤率分析
- 重要新聞及舉措
- 監管格局
- 技術格局
- 衝擊力
- 成長動力
- 奈米科技的進步
- 綠建築需求不斷成長
- 加強基礎建設
- 增強材料性能和耐用性
- 產業陷阱與挑戰
- 生產成本高
- 認知和採用有限
- 成長動力
- 成長潛力分析
- 波特的分析
- PESTEL 分析
第4章:競爭格局
- 介紹
- 公司市佔率分析
- 競爭定位矩陣
- 戰略展望矩陣
第 5 章:市場估計與預測:按材料類型,2021 年至 2032 年
- 主要趨勢
- 智慧奈米混凝土
- 智慧奈米塗層
- 智慧奈米玻璃
- 其他(奈米絕緣材料、添加劑等)
第6章:市場估計與預測:依技術類型,2021 – 2032 年
- 主要趨勢
- 活性智慧材料
- 被動智慧材料
第 7 章:市場估計與預測:按應用,2021 年至 2032 年
- 主要趨勢
- 結構應用
- 非結構性應用
- 監控系統
第 8 章:市場估計與預測:依最終用途,2021 年至 2032 年
- 主要趨勢
- 商業建築
- 住宅建築
- 基礎設施
- 工業的
第 9 章:市場估計與預測:按配銷通路,2021 年至 2032 年
- 主要趨勢
- 直接的
- 間接
第 10 章:市場估計與預測:按地區,2021 年至 2032 年
- 主要趨勢
- 北美洲
- 美國
- 加拿大
- 歐洲
- 英國
- 德國
- 法國
- 義大利
- 西班牙
- 亞太地區
- 中國
- 日本
- 印度
- 澳洲
- 拉丁美洲
- 巴西
- 墨西哥
- 中東及非洲
- 南非
- 沙烏地阿拉伯
- 阿拉伯聯合大公國
第 11 章:公司簡介
- 3M Company
- Advenira Enterprises, Inc.
- Aerogel Technologies, LLC
- AkzoNobel NV
- Arkema
- BASF SE
- Cabot Corporation
- Dupont
- Evonik Industries AG
- Haliburton Company
- Nanogate SE
- Nanophase Technologies Corporation
- NanoPore Incorporated
- Saint-Gobain
- XG Sciences, Inc.
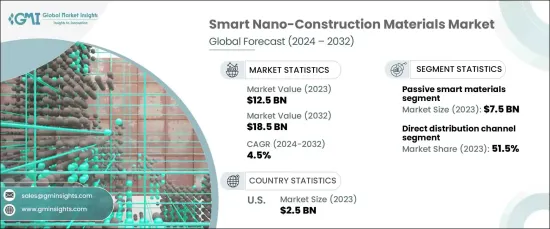
The Global Smart Nano-Construction Materials Market reached a valuation of USD 12.5 billion in 2023 and is expected to grow at a CAGR of 4.5% from 2024 to 2032. This growth is primarily driven by rapid advancements in nanotechnology, which have led to the development of materials with exceptional properties. These innovations offer benefits like self-healing capabilities, enhanced durability, and better thermal insulation, all of which improve the longevity and performance of construction projects. As these materials become more sophisticated, they not only elevate building standards but also cater to the growing demand for energy-efficient and environmentally sustainable construction solutions. This shift aligns with global sustainability goals, as these advanced materials can help reduce energy consumption and lower the environmental footprint of modern buildings.
The demand for green, energy-efficient buildings has accelerated the adoption of smart nano-construction materials. These materials are increasingly favored due to their ability to enhance the energy efficiency and structural integrity of buildings, which contributes to substantial reductions in energy costs and emissions. Smart nano-construction materials play a crucial role in shaping the future of the construction industry, helping to meet sustainability goals while ensuring that buildings remain durable and functional for longer periods.
| Market Scope | |
|---|---|
| Start Year | 2023 |
| Forecast Year | 2024-2032 |
| Start Value | $12.5 Billion |
| Forecast Value | $18.5 Billion |
| CAGR | 4.5% |
Regarding material types, the market is divided into two key segments: active and passive smart materials. In 2023, passive smart materials dominated the market, holding a value of USD 7.5 billion. This segment is projected to expand at a CAGR of 4.2% through the forecast period. Passive smart materials, such as self-healing concrete and thermal insulation nanocomposites, autonomously enhance the performance of buildings without the need for external control systems.
The distribution channels for these materials are also evolving, with a notable preference for direct distribution methods. In 2023, the direct distribution channel held a 51.5% share of the market and is anticipated to grow at a CAGR of 4.6% from 2024 to 2032. Direct distribution allows manufacturers to establish a direct connection with end-users, helping to reduce costs and improve customer service. Additionally, it ensures that specialized products reach the market promptly, which boosts overall market reach and penetration.
The U.S. market for smart nano-construction materials, valued at USD 2.5 billion in 2023, is projected to grow at a CAGR of 4.6% from 2024 to 2032. Factors such as substantial investments in sustainable infrastructure, advanced construction technologies, and a focus on energy-efficient materials are driving this growth. Government initiatives supporting green building practices further propel the adoption of smart nano-construction materials in the U.S., reinforcing the nation's commitment to creating sustainable and durable buildings.
Table of Contents
Chapter 1 Methodology & Scope
- 1.1 Market scope & definition
- 1.2 Base estimates & calculations
- 1.3 Forecast parameters
- 1.4 Data sources
- 1.4.1 Primary
- 1.5 Secondary
- 1.5.1.1 Paid sources
- 1.5.1.2 Public sources
Chapter 2 Executive Summary
- 2.1 Industry synopsis, 2021 - 2032
Chapter 3 Industry Insights
- 3.1 Industry ecosystem analysis
- 3.1.1 Factor affecting the value chain
- 3.1.2 Profit margin analysis
- 3.1.3 Disruptions
- 3.1.4 Future outlook
- 3.1.5 Manufacturers
- 3.1.6 Distributors
- 3.2 Supplier landscape
- 3.3 Profit margin analysis
- 3.4 Key news & initiatives
- 3.5 Regulatory landscape
- 3.6 Technological landscape
- 3.7 Impact forces
- 3.7.1 Growth drivers
- 3.7.1.1 Advancements in nanotechnology
- 3.7.1.2 Rising demand for green buildings
- 3.7.1.3 Increased infrastructure development
- 3.7.1.4 Enhanced material performance and durability
- 3.7.2 Industry pitfalls & challenges
- 3.7.2.1 High production costs
- 3.7.2.2 Limited awareness and adoption
- 3.7.1 Growth drivers
- 3.8 Growth potential analysis
- 3.9 Porter’s analysis
- 3.10 PESTEL analysis
Chapter 4 Competitive Landscape, 2023
- 4.1 Introduction
- 4.2 Company market share analysis
- 4.3 Competitive positioning matrix
- 4.4 Strategic outlook matrix
Chapter 5 Market Estimates and Forecast, By Material Type, 2021 – 2032 (USD Billion) (Tons)
- 5.1 Key trends
- 5.2 Smart nano concrete
- 5.3 Smart nano coatings
- 5.4 Smart nano glass
- 5.5 Others (nano-insulation materials, additives, etc.)
Chapter 6 Market Estimates and Forecast, By Technology Type, 2021 – 2032 (USD Billion) (Tons)
- 6.1 Key trends
- 6.2 Active smart materials
- 6.3 Passive smart materials
Chapter 7 Market Estimates and Forecast, By Application, 2021 – 2032 (USD Billion) (Tons)
- 7.1 Key trends
- 7.2 Structural applications
- 7.3 Non-structural applications
- 7.4 Monitoring systems
Chapter 8 Market Estimates and Forecast, By End Use, 2021 – 2032 (USD Billion) (Tons)
- 8.1 Key trends
- 8.2 Commercial buildings
- 8.3 Residential buildings
- 8.4 Infrastructure
- 8.5 Industrial
Chapter 9 Market Estimates & Forecast, By Distribution Channel, 2021 – 2032, (USD Billion) (Tons)
- 9.1 Key trends
- 9.2 Direct
- 9.3 Indirect
Chapter 10 Market Estimates & Forecast, By Region, 2021 – 2032, (USD Billion) (Tons)
- 10.1 Key trends
- 10.2 North America
- 10.2.1 U.S.
- 10.2.2 Canada
- 10.3 Europe
- 10.3.1 UK
- 10.3.2 Germany
- 10.3.3 France
- 10.3.4 Italy
- 10.3.5 Spain
- 10.4 Asia Pacific
- 10.4.1 China
- 10.4.2 Japan
- 10.4.3 India
- 10.4.4 Australia
- 10.5 Latin America
- 10.5.1 Brazil
- 10.5.2 Mexico
- 10.6 MEA
- 10.6.1 South Africa
- 10.6.2 Saudi Arabia
- 10.6.3 UAE
Chapter 11 Company Profiles (Business Overview, Financial Data, Product Landscape, Strategic Outlook, SWOT Analysis)
- 11.1 3M Company
- 11.2 Advenira Enterprises, Inc.
- 11.3 Aerogel Technologies, LLC
- 11.4 AkzoNobel N.V.
- 11.5 Arkema
- 11.6 BASF SE
- 11.7 Cabot Corporation
- 11.8 Dupont
- 11.9 Evonik Industries AG
- 11.10 Haliburton Company
- 11.11 Nanogate SE
- 11.12 Nanophase Technologies Corporation
- 11.13 NanoPore Incorporated
- 11.14 Saint-Gobain
- 11.15 XG Sciences, Inc.
 智慧奈米建築材料市場,按材料、按應用、按技術、按最終用途、按配銷通路、按國家和地區 - 2025 年至 2032 年全球行業分析、市場規模、市場佔有率和預測奈米分散產品市場報告:趨勢、預測和競爭分析(至2031年)奈米銀市場,按合成方法、按最終用戶、按國家和地區分類 - 2025 年至 2032 年全球行業分析、市場規模、市場佔有率和預測
 2025 年奈米材料全球市場報告
 奈米技術的全球市場(2025年~2035年)
 奈米材料市場:全球產業分析、市場規模、佔有率、成長、趨勢和未來預測(2025-2032 年)
 透明絕緣氣凝膠市場分析與預測(至 2033 年):類型、產品、應用、材料類型、技術、形式、最終用戶、安裝類型、功能
 奈米材料-市場佔有率分析、行業趨勢和統計、成長預測(2025-2030 年)
 奈米材料的全球市場 - 全球產業分析,規模,佔有率,成長,趨勢,預測(2031年)埃洛石市場機會、成長動力、產業趨勢分析與 2025 - 2034 年預測