


 |
市場調查報告書
商品編碼
1665235
石油和天然氣市場中的數位孿生機會、成長動力、產業趨勢分析和 2025 - 2034 年預測Digital Twin in Oil And Gas Market Opportunity, Growth Drivers, Industry Trend Analysis, and Forecast 2025 - 2034 |
||||||
2024 年全球石油和天然氣市場的數字孿生價值為 12 億美元,預計 2025 年至 2034 年期間將以 11.2% 的強勁複合年成長率成長。這一令人印象深刻的成長是由整個行業對數字化轉型的不斷推動、對營運效率的不斷成長的需求以及對預測性維護的日益重視所推動的。隨著石油和天然氣公司尋求簡化流程、提高生產力和最大限度地減少停機時間,數位孿生技術正成為實現這些目標不可或缺的一部分。
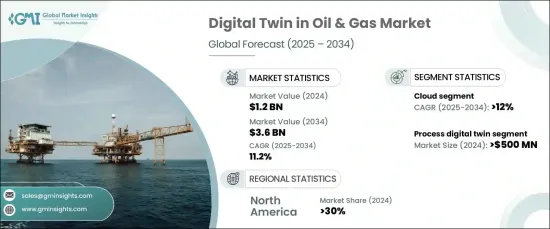
市場主要分為三種:產品、流程、系統數位孿生。其中,流程數位孿生領域預計將實現最顯著的成長,到 2024 年其價值將達到 5 億美元。這部分對於建模和模擬各種石油和天然氣作業的複雜工作流程至關重要。透過提供對整個流程的洞察,流程數位孿生使組織能夠最佳化生產、增強決策能力並提高整體績效。這些數位孿生在精煉流程、探勘和鑽探方面特別有效,有助於提高安全標準和操作準確性。
| 市場範圍 | |
|---|---|
| 起始年份 | 2024 |
| 預測年份 | 2025-2034 |
| 起始值 | 12億美元 |
| 預測值 | 36億美元 |
| 複合年成長率 | 11.2% |
談到部署模式,市場分為內部部署和基於雲端的解決方案。預計雲端運算領域將在 2025 年至 2034 年間以 12% 的強勁複合年成長率成長,這得益於其可擴展性、成本效益以及支援遠端監控的能力。雲端解決方案提供無縫即時資料整合,支援跨地理位置分散的團隊進行協作操作。雲端平台的靈活性使企業能夠快速適應不斷變化的營運條件並實施效能驅動的更新,使其成為石油和天然氣行業的首選。
受數位技術的快速發展、自動化投資的增加以及對資料分析的日益關注的推動,北美在 2024 年佔據全球市場的 30% 的主導佔有率。該地區對數位孿生解決方案的採用在資產管理和營運最佳化方面尤為強勁。特別是上游和中游產業的公司正在利用這些技術來加強安全協議、降低營運成本並滿足嚴格的監管標準。該地區領先的技術提供者和行業先驅的存在進一步支持了市場的強勁成長。
目錄
第 1 章:方法論與範圍
- 研究設計
- 研究方法
- 資料收集方法
- 基礎估算與計算
- 基準年計算
- 市場估計的主要趨勢
- 預測模型
- 初步研究和驗證
- 主要來源
- 資料探勘來源
- 市場範圍和定義
第 2 章:執行摘要
第 3 章:產業洞察
- 產業生態系統分析
- 供應商概況
- 技術提供者
- 平台提供者
- 石油和天然氣營運商
- 經銷商
- 最終用戶
- 利潤率分析
- 技術與創新格局
- 專利分析
- 監管格局
- 使用案例
- 使用案例1
- 好處
- 投資報酬率
- 使用案例2
- 好處
- 投資報酬率
- 使用案例1
- 案例研究
- 案例研究 1
- 消費者姓名
- 挑戰
- 解決方案
- 影響
- 案例研究 2
- 消費者姓名
- 挑戰
- 解決方案
- 影響
- 案例研究 1
- 衝擊力
- 成長動力
- 即時監控需求日益增加
- 預測性維護的採用率不斷提高
- 越來越重視永續發展舉措
- 基於雲端的數位孿生技術的進步
- 產業陷阱與挑戰
- 實施成本高
- 資料安全問題
- 成長動力
- 成長潛力分析
- 波特的分析
- PESTEL 分析
第4章:競爭格局
- 介紹
- 公司市佔率分析
- 競爭定位矩陣
- 戰略展望矩陣
第5章:市場估計與預測:依供應量,2021 - 2034 年
- 主要趨勢
- 產品數位孿生
- 流程數位孿生
- 系統數位孿生
第6章:市場估計與預測:依部署模式,2021 - 2034 年
- 主要趨勢
- 雲
- 本地
第 7 章:市場估計與預測:按營運,2021 - 2034 年
- 主要趨勢
- 上游
- 中游
- 下游
第 8 章:市場估計與預測:按應用,2021 - 2034 年
- 主要趨勢
- 探勘與生產
- 鑽井作業
- 水庫管理
- 管道管理
- 煉油業務
- 資產績效管理
- 其他
第 9 章:市場估計與預測:按最終用途,2021 - 2034 年
- 主要趨勢
- 國家石油公司 (NOC)
- 獨立石油公司 (IOC)
第 10 章:市場估計與預測:按地區,2021 - 2034 年
- 主要趨勢
- 北美洲
- 美國
- 加拿大
- 歐洲
- 英國
- 德國
- 法國
- 義大利
- 西班牙
- 俄羅斯
- 北歐
- 亞太地區
- 中國
- 印度
- 日本
- 澳洲
- 韓國
- 東南亞
- 拉丁美洲
- 巴西
- 墨西哥
- 阿根廷
- 中東及非洲
- 阿拉伯聯合大公國
- 南非
- 沙烏地阿拉伯
第 11 章:公司簡介
- AVEVA
- Baker Hughes
- BP
- Chevron
- Emerson
- Eni Analytics
- Equinor
- General Electric
- Halliburton
- Honeywell
- IBM
- Petrobras
- Repsol
- Saudi Aramco
- Schlumberger
- Siemens Energy
- TechnipFMC
- TotalEnergies
- Wood
- Yokogawa
The Global Digital Twin In Oil And Gas Market was valued at USD 1.2 billion in 2024 and is projected to grow at a robust CAGR of 11.2% from 2025 to 2034. This impressive growth is driven by the increasing push for digital transformation across the industry, a heightened demand for operational efficiency, and a growing emphasis on predictive maintenance. As oil and gas companies seek to streamline their processes, enhance productivity, and minimize downtime, digital twin technologies are becoming integral to achieving these goals.
The market is primarily segmented by offering into three types: product, process, and system digital twins. Among these, the process digital twin segment, valued at USD 500 million in 2024, is expected to experience the most significant growth. This segment is crucial for modeling and simulating complex workflows across various oil and gas operations. By providing insights into the entire process, process digital twins enable organizations to optimize production, enhance decision-making, and boost overall performance. These digital twins are particularly effective in refining processes, exploration, and drilling, helping improve safety standards and operational accuracy.
| Market Scope | |
|---|---|
| Start Year | 2024 |
| Forecast Year | 2025-2034 |
| Start Value | $1.2 Billion |
| Forecast Value | $3.6 Billion |
| CAGR | 11.2% |
When it comes to deployment modes, the market is divided into on-premises and cloud-based solutions. The cloud segment is projected to grow at a strong CAGR of 12% from 2025 to 2034, driven by its scalability, cost-effectiveness, and ability to support remote monitoring. Cloud solutions offer seamless real-time data integration, enabling collaborative operations across geographically dispersed teams. The flexibility of cloud platforms allows businesses to quickly adapt to changing operational conditions and implement performance-driven updates, making them a preferred choice for the oil and gas industry.
North America held a dominant 30% share of the global market in 2024, fueled by rapid advancements in digital technologies, increased investments in automation, and a growing focus on data analytics. The region's adoption of digital twin solutions is especially strong in asset management and operational optimization. In particular, companies in the upstream and midstream sectors are leveraging these technologies to enhance safety protocols, reduce operational costs, and meet stringent regulatory standards. The presence of leading technology providers and industry pioneers in the region further supports the market's robust growth.
Table of Contents
Chapter 1 Methodology & Scope
- 1.1 Research design
- 1.1.1 Research approach
- 1.1.2 Data collection methods
- 1.2 Base estimates & calculations
- 1.2.1 Base year calculation
- 1.2.2 Key trends for market estimation
- 1.3 Forecast model
- 1.4 Primary research and validation
- 1.4.1 Primary sources
- 1.4.2 Data mining sources
- 1.5 Market scope & definition
Chapter 2 Executive Summary
- 2.1 Industry 3600 synopsis, 2021 - 2034
Chapter 3 Industry Insights
- 3.1 Industry ecosystem analysis
- 3.2 Supplier landscape
- 3.2.1 Technology providers
- 3.2.2 Platform providers
- 3.2.3 Oil & gas operators
- 3.2.4 Distributors
- 3.2.5 End users
- 3.3 Profit margin analysis
- 3.4 Technology & innovation landscape
- 3.5 Patent analysis
- 3.6 Regulatory landscape
- 3.7 Used cases
- 3.7.1 Used case 1
- 3.7.1.1 Benefits
- 3.7.1.2 ROI
- 3.7.2 Used case 2
- 3.7.2.1 Benefits
- 3.7.2.2 ROI
- 3.7.1 Used case 1
- 3.8 Case study
- 3.8.1 Case study 1
- 3.8.1.1 Consumer name
- 3.8.1.2 Challenge
- 3.8.1.3 Solution
- 3.8.1.4 Impact
- 3.8.2 Case study 2
- 3.8.2.1 Consumer name
- 3.8.2.2 Challenge
- 3.8.2.3 Solution
- 3.8.2.4 Impact
- 3.8.1 Case study 1
- 3.9 Impact forces
- 3.9.1 Growth drivers
- 3.9.1.1 Increasing demand for real-time monitoring
- 3.9.1.2 Rising adoption of predictive maintenance
- 3.9.1.3 Growing emphasis on sustainability initiatives
- 3.9.1.4 Advancements in cloud-based digital twin technologies
- 3.9.2 Industry pitfalls & challenges
- 3.9.2.1 High implementation costs
- 3.9.2.2 Data security concerns
- 3.9.1 Growth drivers
- 3.10 Growth potential analysis
- 3.11 Porter’s analysis
- 3.12 PESTEL analysis
Chapter 4 Competitive Landscape, 2024
- 4.1 Introduction
- 4.2 Company market share analysis
- 4.3 Competitive positioning matrix
- 4.4 Strategic outlook matrix
Chapter 5 Market Estimates & Forecast, By Offering, 2021 - 2034 ($Bn)
- 5.1 Key trends
- 5.2 Product digital twin
- 5.3 Process digital twin
- 5.4 System digital twin
Chapter 6 Market Estimates & Forecast, By Deployment Mode, 2021 - 2034 ($Bn)
- 6.1 Key trends
- 6.2 Cloud
- 6.3 On-premises
Chapter 7 Market Estimates & Forecast, By Operation, 2021 - 2034 ($Bn)
- 7.1 Key trends
- 7.2 Upstream
- 7.3 Midstream
- 7.4 Downstream
Chapter 8 Market Estimates & Forecast, By Application, 2021 - 2034 ($Bn)
- 8.1 Key trends
- 8.2 Exploration & production
- 8.3 Drilling operations
- 8.4 Reservoir management
- 8.5 Pipeline management
- 8.6 Refining operations
- 8.7 Asset performance management
- 8.8 Others
Chapter 9 Market Estimates & Forecast, By End Use, 2021 - 2034 ($Bn)
- 9.1 Key trends
- 9.2 National Oil Companies (NOCs)
- 9.3 Independent Oil Companies (IOCs)
Chapter 10 Market Estimates & Forecast, By Region, 2021 - 2034 ($Bn)
- 10.1 Key trends
- 10.2 North America
- 10.2.1 U.S.
- 10.2.2 Canada
- 10.3 Europe
- 10.3.1 UK
- 10.3.2 Germany
- 10.3.3 France
- 10.3.4 Italy
- 10.3.5 Spain
- 10.3.6 Russia
- 10.3.7 Nordics
- 10.4 Asia Pacific
- 10.4.1 China
- 10.4.2 India
- 10.4.3 Japan
- 10.4.4 Australia
- 10.4.5 South Korea
- 10.4.6 Southeast Asia
- 10.5 Latin America
- 10.5.1 Brazil
- 10.5.2 Mexico
- 10.5.3 Argentina
- 10.6 MEA
- 10.6.1 UAE
- 10.6.2 South Africa
- 10.6.3 Saudi Arabia
Chapter 11 Company Profiles
- 11.1 AVEVA
- 11.2 Baker Hughes
- 11.3 BP
- 11.4 Chevron
- 11.5 Emerson
- 11.6 Eni Analytics
- 11.7 Equinor
- 11.8 General Electric
- 11.9 Halliburton
- 11.10 Honeywell
- 11.11 IBM
- 11.12 Petrobras
- 11.13 Repsol
- 11.14 Saudi Aramco
- 11.15 Schlumberger
- 11.16 Siemens Energy
- 11.17 TechnipFMC
- 11.18 TotalEnergies
- 11.19 Wood
- 11.20 Yokogawa
 全球石油和天然氣市場的數位孿生—2025-2032
 能源物聯網 (IoT) 市場規模、佔有率及成長分析(按組件、解決方案、服務、網路技術、應用和地區)-2025 年至 2032 年產業預測
 2025 年能源物聯網 (IoT) 全球市場報告
 石油和天然氣領域的全球物聯網市場
 能源物聯網:市場佔有率分析、產業趨勢與統計、成長預測(2025-2030 年)石油和天然氣市場中的物聯網 (IoT) 機會、成長動力、產業趨勢分析和 2025 - 2034 年預測
 能源物聯網市場:按組件、應用和最終用途分類 - 2025-2030 年全球預測能源市場中的物聯網 (IoT) 規模、佔有率、趨勢分析報告:按組件、按應用、按部署、按連接性、按地區、按細分市場、預測,2024-2030 年太陽能物聯網市場評估:依類型、產品、材料、平台、應用和地區劃分的機會和預測(2017-2031)
 全球物聯網能源管理市場規模研究與預測,按組件(解決方案/平台/系統、服務)、按應用(智慧城市、智慧公用事業、工業物聯網)、最終用戶(商業、工業)和區域分析, 2023-2030