


 |
市場調查報告書
商品編碼
1665275
硬接線商用電湧保護裝置市場機會、成長動力、產業趨勢分析與 2025 - 2034 年預測Hard-Wired Commercial Surge Protection Devices Market Opportunity, Growth Drivers, Industry Trend Analysis, and Forecast 2025 - 2034 |
||||||
2024資料全球硬接線商用電湧保護裝置市場價值為 4.925 億美元,預計 2025 年至 2034 年期間將以 6.1% 的強勁複合年成長率成長。這些設備在資料中心、IT基礎設施和智慧建築技術中的應用日益廣泛,進一步推動了市場的擴張。
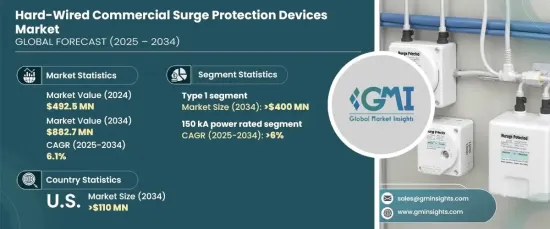
預計到 2034 年,1 型硬體連線商用電湧保護裝置市場規模將達到 4 億美元,這主要得益於對具有卓越電壓箝位能力和快速響應時間的設備的需求。人們對智慧建築、物聯網自動化和嚴格安全標準遵守的關注度不斷上升,這正在增強市場滲透率。此外,對尖端電氣系統的持續投資以及監控和診斷技術的整合正在加速各行業的應用。
| 市場範圍 | |
|---|---|
| 起始年份 | 2024 |
| 預測年份 | 2025-2034 |
| 起始值 | 4.925億美元 |
| 預測值 | 8.827 億美元 |
| 複合年成長率 | 6.1% |
預計到 2034 年,額定功率超過 150 kA 的突波保護裝置的成長率將達到 6%。資料中心和醫療保健等領域的應用不斷擴大,加上雷擊等極端天氣事件發生的頻率不斷增加,大大增強了市場機會。
預計到 2034 年,美國硬連線商用電湧保護裝置產業將創收 1.1 億美元,這得益於人們越來越依賴保護關鍵基礎設施和敏感電子設備免受電湧影響。電網的現代化以及包括伺服器、醫療設備和自動化技術在內的精密電子系統的廣泛部署正在加強市場的成長軌跡。
目錄
第 1 章:方法論與範圍
- 市場範圍和定義
- 市場估計和預測參數
- 預測計算
- 資料來源
- 基本的
- 次要
- 有薪資的
- 民眾
第 2 章:執行摘要
第 3 章:產業洞察
- 產業生態系統分析
- 監管格局
- 產業衝擊力
- 成長動力
- 產業陷阱與挑戰
- 成長潛力分析
- 波特的分析
- 供應商的議價能力
- 買家的議價能力
- 新進入者的威脅
- 替代品的威脅
- PESTEL 分析
第4章:競爭格局
- 介紹
- 戰略展望
- 創新與永續發展格局
第 5 章:市場規模及預測:依技術分類,2021 – 2034 年
- 主要趨勢
- 類型 1
- 類型 2
- 類型 3
第6章:市場規模及預測:依功率等級,2021 – 2034 年
- 主要趨勢
- ≤ 50kA
- > 50 kA 至 100 kA
- > 100 kA 至 150 kA
- >150千安
第 7 章:市場規模及預測:按地區,2021 – 2034 年
- 主要趨勢
- 北美洲
- 美國
- 加拿大
- 墨西哥
- 歐洲
- 德國
- 法國
- 俄羅斯
- 英國
- 義大利
- 西班牙
- 荷蘭
- 奧地利
- 亞太地區
- 中國
- 日本
- 韓國
- 印度
- 澳洲
- 紐西蘭
- 馬來西亞
- 印尼
- 中東和非洲
- 沙烏地阿拉伯
- 阿拉伯聯合大公國
- 卡達
- 埃及
- 南非
- 奈及利亞
- 科威特
- 阿曼
- 拉丁美洲
- 巴西
- 秘魯
- 阿根廷
第8章:公司簡介
- ABB
- Belkin
- Eaton
- Emerson Electric
- Hubbell
- Infineon Technologies
- Intermatic
- JMV
- Legrand
- Littelfuse
- Philips
- Phoenix Contact
- Schneider Electric
- Siemens
- Socomec
The Global Hard-Wired Commercial Surge Protection Devices Market was valued at USD 492.5 million in 2024 and is anticipated to grow at a robust CAGR of 6.1% from 2025 to 2034. The rising need to protect sensitive electrical systems from power surges-responsible for equipment damage, data loss, and financial disruptions-is a key driver of market growth. The increasing adoption of these devices in data centers, IT infrastructures, and smart building technologies further propels the market's expansion.
The Type 1 hard-wired commercial surge protection devices segment is forecasted to reach USD 400 million by 2034, fueled by demand for devices offering superior voltage clamping capabilities and rapid response times. The surging focus on smart buildings, IoT-enabled automation, and compliance with stringent safety standards is bolstering market penetration. Additionally, ongoing investments in cutting-edge electrical systems and the integration of monitoring and diagnostic technologies are accelerating adoption across industries.
| Market Scope | |
|---|---|
| Start Year | 2024 |
| Forecast Year | 2025-2034 |
| Start Value | $492.5 Million |
| Forecast Value | $882.7 Million |
| CAGR | 6.1% |
Surge protection devices with power ratings exceeding 150 kA are projected to experience a growth rate of 6% through 2034. The heightened use of systems with higher surge current ratings to safeguard crucial assets from electrical disturbances is driving this demand. Expanding applications in sectors such as data centers and healthcare, coupled with the increasing frequency of extreme weather events like lightning strikes, are significantly enhancing market opportunities.
The U.S. hard-wired commercial surge protection devices industry is expected to generate USD 110 million by 2034, underpinned by a growing reliance on safeguarding critical infrastructure and sensitive electronics from power surges. The modernization of grid networks and the extensive deployment of delicate electronic systems, including servers, medical equipment, and automated technologies, are strengthening the market's growth trajectory.
Table of Contents
Chapter 1 Methodology & Scope
- 1.1 Market scope & definitions
- 1.2 Market estimates & forecast parameters
- 1.3 Forecast calculation
- 1.4 Data sources
- 1.4.1 Primary
- 1.4.2 Secondary
- 1.4.2.1 Paid
- 1.4.2.2 Public
Chapter 2 Executive Summary
- 2.1 Industry synopsis, 2021 - 2034
Chapter 3 Industry Insights
- 3.1 Industry ecosystem analysis
- 3.2 Regulatory landscape
- 3.3 Industry impact forces
- 3.3.1 Growth drivers
- 3.3.2 Industry pitfalls & challenges
- 3.4 Growth potential analysis
- 3.5 Porter's analysis
- 3.5.1 Bargaining power of suppliers
- 3.5.2 Bargaining power of buyers
- 3.5.3 Threat of new entrants
- 3.5.4 Threat of substitutes
- 3.6 PESTEL analysis
Chapter 4 Competitive Landscape, 2024
- 4.1 Introduction
- 4.2 Strategic outlook
- 4.3 Innovation & sustainability landscape
Chapter 5 Market Size and Forecast, By Technology, 2021 – 2034 ('000 Units & USD Million)
- 5.1 Key trends
- 5.2 Type 1
- 5.3 Type 2
- 5.4 Type 3
Chapter 6 Market Size and Forecast, By Power Rating, 2021 – 2034 ('000 Units & USD Million)
- 6.1 Key trends
- 6.2 ≤ 50 kA
- 6.3 > 50 kA to 100 kA
- 6.4 > 100 kA to 150 kA
- 6.5 > 150 kA
Chapter 7 Market Size and Forecast, By Region, 2021 – 2034 ('000 Units & USD Million)
- 7.1 Key trends
- 7.2 North America
- 7.2.1 U.S.
- 7.2.2 Canada
- 7.2.3 Mexico
- 7.3 Europe
- 7.3.1 Germany
- 7.3.2 France
- 7.3.3 Russia
- 7.3.4 UK
- 7.3.5 Italy
- 7.3.6 Spain
- 7.3.7 Netherlands
- 7.3.8 Austria
- 7.4 Asia Pacific
- 7.4.1 China
- 7.4.2 Japan
- 7.4.3 South Korea
- 7.4.4 India
- 7.4.5 Australia
- 7.4.6 New Zealand
- 7.4.7 Malaysia
- 7.4.8 Indonesia
- 7.5 Middle East & Africa
- 7.5.1 Saudi Arabia
- 7.5.2 UAE
- 7.5.3 Qatar
- 7.5.4 Egypt
- 7.5.5 South Africa
- 7.5.6 Nigeria
- 7.5.7 Kuwait
- 7.5.8 Oman
- 7.6 Latin America
- 7.6.1 Brazil
- 7.6.2 Peru
- 7.6.3 Argentina
Chapter 8 Company Profiles
- 8.1 ABB
- 8.2 Belkin
- 8.3 Eaton
- 8.4 Emerson Electric
- 8.5 Hubbell
- 8.6 Infineon Technologies
- 8.7 Intermatic
- 8.8 JMV
- 8.9 Legrand
- 8.10 Littelfuse
- 8.11 Philips
- 8.12 Phoenix Contact
- 8.13 Schneider Electric
- 8.14 Siemens
- 8.15 Socomec
 2025 年至 2033 年突波保護裝置市場報告(按產品、類型、額定功率、最終用戶和地區)
 突波保護裝置 (SPD) 市場:全球市場佔有率和排名、總收入和需求預測(2025-2031年)
 閘流體突波抑制器市場報告:趨勢、預測和競爭分析(至 2031 年)
 突波保護元件 - 全球市場、最終用戶、應用程式和競爭對手
 突波保護裝置 - 全球市場、最終用戶、應用和競爭對手:分析和預測
 電源控制商用電湧保護裝置市場機會、成長動力、產業趨勢分析及 2025 - 2034 年預測
 全球突波保護裝置市場:佔有率分析、產業趨勢/統計、成長預測(2025-2030)
 瞬態保護元件:市場佔有率分析、產業趨勢與統計、成長預測(2025-2030)
 電湧保護裝置市場機會、成長動力、產業趨勢分析與 2025 - 2034 年預測
 閘流體突波保護元件 (TSPD) 市場報告:2030 年趨勢、預測與競爭分析