


 |
市場調查報告書
商品編碼
1665376
矽基 OLED (OLEDoS) 市場機會、成長動力、產業趨勢分析及 2025 - 2034 年預測OLED-on-Silicon (OLEDoS) Market Opportunity, Growth Drivers, Industry Trend Analysis, and Forecast 2025 - 2034 |
||||||
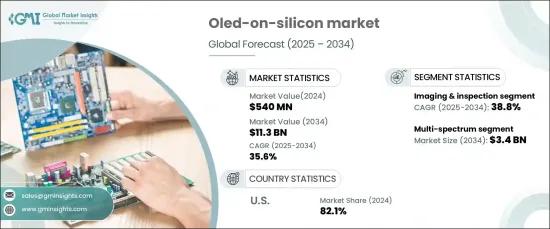
2024 年全球矽基 OLED 市場估值達到 5.4 億美元,預計將經歷顯著成長,2025 年至 2034 年的複合年成長率為 35.6%。 這一成長是由對提供卓越清晰度、鮮豔色彩和清晰視覺效果的高性能顯示器日益成長的需求推動的。 OLEDoS 技術憑藉其卓越的像素密度和出色的影像質量,在智慧型手機、穿戴式裝置和 AR/VR 產品等各種應用領域中廣泛應用。
消費性電子產品的小型化、整合化趨勢日益增強,進一步加速了市場的擴張。隨著設備變得越來越緊湊、輕巧和便攜,OLEDoS 成為一種理想的顯示解決方案,提供無與倫比的性能而不影響品質。其超薄緊湊的設計非常適合現代消費性電子產品,因為節省空間的組件至關重要。
| 市場範圍 | |
|---|---|
| 起始年份 | 2024 |
| 預測年份 | 2025-2034 |
| 起始值 | 5.4億美元 |
| 預測值 | 113億美元 |
| 複合年成長率 | 35.6% |
依光譜細分,矽基 OLED 市場涵蓋近紅外線、紅外線、紫外線、多光譜等。預計到 2034 年,多光譜領域的估值將達到 34 億美元。這些顯示器具有出色的亮度、色彩精確度和視覺性能,滿足遊戲、汽車和醫療保健等行業對生動細緻的視覺效果至關重要的需求。
根據應用,市場分為顯示系統、感測和檢測、成像和檢查、光通訊等。其中,成像和檢測領域有望實現令人矚目的成長,預計到 2034 年將實現 38.8% 的複合年成長率,成為成長最快的類別。然而,由於消費性電子產品和 AR/VR 設備對節能高效能顯示器的需求不斷成長,顯示系統仍佔據相當大的市場佔有率。 OLEDoS 技術以提供豐富的色彩、增強的亮度和低功耗而著稱,使其成為緊湊型高解析度顯示器系統的首選解決方案。
2024年,美國矽基OLED市場佔有率將達到驚人的82.1%,凸顯了其主導地位。對最先進的消費性電子產品和 AR/VR 設備的強勁需求增強了這一領導地位。強勁的研發投入,加上政府支持永續和節能技術的舉措,進一步推動了美國對 OLEDoS 的採用,鞏固了其在全球市場主要參與者的地位。
目錄
第 1 章:方法論與範圍
- 市場範圍和定義
- 基礎估算與計算
- 預測計算
- 資料來源
- 基本的
- 次要
- 付費來源
- 公共資源
第 2 章:執行摘要
第 3 章:產業洞察
- 產業生態系統分析
- 影響價值鏈的因素
- 利潤率分析
- 中斷
- 未來展望
- 製造商
- 經銷商
- 供應商概況
- 利潤率分析
- 重要新聞及舉措
- 監管格局
- 衝擊力
- 成長動力
- 高解析度顯示器需求不斷成長
- 消費性電子產品的小型化和整合化
- 提高效能和成本效率
- 軟性和透明顯示技術的進步
- 產業領袖和技術合作夥伴的支持
- 產業陷阱與挑戰
- 製造成本高且複雜
- 市場滲透率與消費者認知度有限
- 成長動力
- 成長潛力分析
- 波特的分析
- PESTEL 分析
第4章:競爭格局
- 介紹
- 公司市佔率分析
- 競爭定位矩陣
- 戰略展望矩陣
第 5 章:市場估計與預測:按光譜,2021 年至 2034 年
- 主要趨勢
- 可見光譜(RGB、全彩顯示器)
- 近紅外線(NIR,700-1400 nm)
- 紅外線(IR,700-3000 nm)
- 紫外線(UV,<400 nm)
- 多光譜(可見光 + 紅外線 + 近紅外線)
- 其他
第 6 章:市場估計與預測:按應用,2021 年至 2034 年
- 主要趨勢
- 顯示系統
- 感測與檢測
- 影像與檢查
- 光通訊
- 其他
第 7 章:市場估計與預測:依最終用途,2021 年至 2034 年
- 主要趨勢
- 航太和國防
- 消費性電子產品
- 工業和製造業
- 醫療保健
- 汽車
- 其他
第 8 章:市場估計與預測:按地區,2021 年至 2034 年
- 主要趨勢
- 北美洲
- 美國
- 加拿大
- 歐洲
- 英國
- 德國
- 法國
- 義大利
- 西班牙
- 俄羅斯
- 亞太地區
- 中國
- 印度
- 日本
- 韓國
- 澳洲
- 拉丁美洲
- 巴西
- 墨西哥
- 中東及非洲
- 南非
- 沙烏地阿拉伯
- 阿拉伯聯合大公國
第9章:公司簡介
- China Star Optoelectronics Technology (CSOT)
- eMagin Corporation
- Himax Technologies, Inc.
- HOLOEYE Photonics AG
- Innolux Corporation
- JDI (Japan Display Inc.)
- Kopin Corporation
- LG Display Co., Ltd.
- Olightek
- Pixelligent Technologies LLC
- Raystar Optronics Inc.
- Ritek Corporation
- Samsung Electronics Co., Ltd.
- SeeYA Technology
- SiliconCore Technology Inc.
- Sony Corporation
- Tridonic GmbH & Co. KG
- Visionox
- Winstar Display Co., Ltd.
- WiseChip Semiconductor Inc.
The Global OLED-On-Silicon Market achieved a valuation of USD 540 million in 2024 and is projected to experience remarkable growth, registering a CAGR of 35.6% from 2025 to 2034. This surge is propelled by the escalating demand for high-performance displays that deliver exceptional clarity, vibrant colors, and sharp visuals. OLEDoS technology is gaining widespread adoption across diverse applications, including smartphones, wearable devices, and AR/VR products, thanks to its superior pixel density and outstanding image quality.
The growing trend toward miniaturization and integration in consumer electronics is further accelerating the market's expansion. As devices become increasingly compact, lightweight, and portable, OLEDoS emerges as an ideal display solution, offering unparalleled performance without compromising quality. Its ultra-thin and compact design is perfectly suited for modern consumer gadgets, where space-saving components are paramount.
| Market Scope | |
|---|---|
| Start Year | 2024 |
| Forecast Year | 2025-2034 |
| Start Value | $540 Million |
| Forecast Value | $11.3 Billion |
| CAGR | 35.6% |
Segmented by light spectrum, the OLED-on-Silicon market encompasses near-infrared, infrared, ultraviolet, multi-spectrum, and others. The multi-spectrum segment is anticipated to reach a valuation of USD 3.4 billion by 2034. Meanwhile, the visible spectrum segment is set to dominate the market, driven by its extensive use in high-resolution displays for virtual and augmented reality devices, as well as consumer electronics. These displays deliver superior brightness, color accuracy, and visual performance, meeting the needs of industries such as gaming, automotive, and healthcare, where vibrant and detailed visuals are critical.
In terms of application, the market is divided into display systems, sensing and detection, imaging and inspection, optical communication, and others. Among these, the imaging and inspection segment is poised for impressive growth, projected to achieve a CAGR of 38.8% through 2034, making it the fastest-growing category. Display systems, however, continue to hold a significant share of the market, fueled by the rising demand for energy-efficient and high-performance displays in consumer electronics and AR/VR devices. OLEDoS technology distinguishes itself by delivering rich colors, enhanced brightness, and low power consumption, making it the go-to solution for compact and high-resolution display systems.
The U.S. OLED-on-Silicon market claimed an impressive 82.1% share in 2024, underscoring its dominant position. This leadership is bolstered by strong demand for state-of-the-art consumer electronics and AR/VR devices. Robust investments in research and development, coupled with government initiatives supporting sustainable and energy-efficient technologies, are further driving the adoption of OLEDoS in the U.S., solidifying its status as a key player in the global market.
Table of Contents
Chapter 1 Methodology & Scope
- 1.1 Market scope & definitions
- 1.2 Base estimates & calculations
- 1.3 Forecast calculations
- 1.4 Data sources
- 1.4.1 Primary
- 1.4.2 Secondary
- 1.4.2.1 Paid sources
- 1.4.2.2 Public sources
Chapter 2 Executive Summary
- 2.1 Industry synopsis, 2021-2034
Chapter 3 Industry Insights
- 3.1 Industry ecosystem analysis
- 3.1.1 Factor affecting the value chain
- 3.1.2 Profit margin analysis
- 3.1.3 Disruptions
- 3.1.4 Future outlook
- 3.1.5 Manufacturers
- 3.1.6 Distributors
- 3.2 Supplier landscape
- 3.3 Profit margin analysis
- 3.4 Key news & initiatives
- 3.5 Regulatory landscape
- 3.6 Impact forces
- 3.6.1 Growth drivers
- 3.6.1.1 Rising demand for high-resolution displays
- 3.6.1.2 Miniaturization and integration in consumer electronics
- 3.6.1.3 Enhanced performance and cost efficiency
- 3.6.1.4 Advancements in flexible and transparent display technologies
- 3.6.1.5 Support from industry leaders and technological partnerships
- 3.6.2 Industry pitfalls & challenges
- 3.6.2.1 High manufacturing costs and complexity
- 3.6.2.2 Limited market penetration and consumer awareness
- 3.6.1 Growth drivers
- 3.7 Growth potential analysis
- 3.8 Porter’s analysis
- 3.9 PESTEL analysis
Chapter 4 Competitive Landscape, 2024
- 4.1 Introduction
- 4.2 Company market share analysis
- 4.3 Competitive positioning matrix
- 4.4 Strategic outlook matrix
Chapter 5 Market Estimates & Forecast, By Light Spectrum, 2021-2034 (USD Billion) (Units)
- 5.1 Key trends
- 5.2 Visible spectrum (RGB, Full-Color Displays)
- 5.3 Near-infrared (NIR, 700-1400 nm)
- 5.4 Infrared (IR, 700-3000 nm)
- 5.5 Ultraviolet (UV, <400 nm)
- 5.6 Multi-spectrum (Visible + IR + NIR)
- 5.7 Others
Chapter 6 Market Estimates & Forecast, By Application, 2021-2034 (USD Billion) (Units)
- 6.1 Key trends
- 6.2 Display systems
- 6.3 Sensing & detection
- 6.4 Imaging & inspection
- 6.5 Optical communication
- 6.6 Others
Chapter 7 Market Estimates & Forecast, By End Use, 2021-2034 (USD Billion) (Units)
- 7.1 Key trends
- 7.2 Aerospace & defense
- 7.3 Consumer electronics
- 7.4 Industrial & manufacturing
- 7.5 Healthcare & medical
- 7.6 Automotive
- 7.7 Others
Chapter 8 Market Estimates & Forecast, By Region, 2021-2034 (USD Billion) (Units)
- 8.1 Key trends
- 8.2 North America
- 8.2.1 U.S.
- 8.2.2 Canada
- 8.3 Europe
- 8.3.1 UK
- 8.3.2 Germany
- 8.3.3 France
- 8.3.4 Italy
- 8.3.5 Spain
- 8.3.6 Russia
- 8.4 Asia Pacific
- 8.4.1 China
- 8.4.2 India
- 8.4.3 Japan
- 8.4.4 South Korea
- 8.4.5 Australia
- 8.5 Latin America
- 8.5.1 Brazil
- 8.5.2 Mexico
- 8.6 MEA
- 8.6.1 South Africa
- 8.6.2 Saudi Arabia
- 8.6.3 UAE
Chapter 9 Company Profiles
- 9.1 China Star Optoelectronics Technology (CSOT)
- 9.2 eMagin Corporation
- 9.3 Himax Technologies, Inc.
- 9.4 HOLOEYE Photonics AG
- 9.5 Innolux Corporation
- 9.6 JDI (Japan Display Inc.)
- 9.7 Kopin Corporation
- 9.8 LG Display Co., Ltd.
- 9.9 Olightek
- 9.10 Pixelligent Technologies LLC
- 9.11 Raystar Optronics Inc.
- 9.12 Ritek Corporation
- 9.13 Samsung Electronics Co., Ltd.
- 9.14 SeeYA Technology
- 9.15 SiliconCore Technology Inc.
- 9.16 Sony Corporation
- 9.17 Tridonic GmbH & Co. KG
- 9.18 Visionox
- 9.19 Winstar Display Co., Ltd.
- 9.20 WiseChip Semiconductor Inc.
 OLED微型顯示器:市場佔有率分析、產業趨勢與統計、成長預測(2025-2030)
 OLED 顯示器市場按顯示器類型、組件、技術、分銷管道、應用和行業細分 - 全球預測 2025-2030
 2025年軟性OLED顯示器全球市場報告
 OLED 顯示器市場:按顯示器類型、應用程式、最終用戶和地區分類透明 OLED 顯示器市場:依產品、尺寸、面板、應用、最終用途 - 2025-2030 年全球預測OLED 掩模張力市場:按應用、最終用戶、技術分類 - 2025-2030 年全球預測LED OLED 顯示器市場 - 全球產業規模、佔有率、趨勢、機會和預測,按技術類型、應用、最終用戶產業、地區和競爭細分,2019-2029 年Oled 微顯示器市場 - 全球產業規模、佔有率、趨勢、機會和預測,按產品類型、解析度(高清、全高清、超高清)、最終用戶、地區和競爭細分,2019-2029 年
 OLEDoS市場:現況分析與預測(2024-2032)
 矽基 OLED (OLEDoS) 市場:依顯示器尺寸、產品類型、產業、地區分類 - 到 2029 年的預測