


 |
市場調查報告書
商品編碼
1666585
區域隔離市場機會、成長動力、產業趨勢分析與 2025 - 2034 年預測Zonal Isolation Market Opportunity, Growth Drivers, Industry Trend Analysis, and Forecast 2025 - 2034 |
||||||
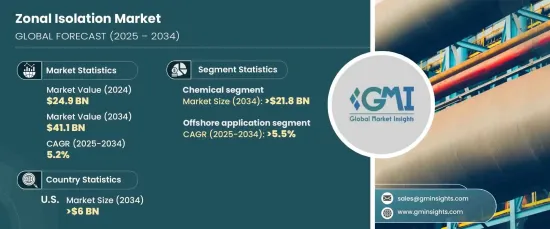
2024 年全球區域隔離市場價值為 249 億美元,預計 2025 年至 2034 年期間將以 5.2% 的複合年成長率穩步成長。一個關鍵促進因素是石油和天然氣公司為應對日益成長的能源需求而增加資本支出。預計油田設備和服務需求的增加將進一步推動區域隔離市場的發展。
深井和超深井以其蘊藏大量石油和天然氣的潛力而聞名,而開採這種油氣趨勢正加速對有效的區域封隔方法的需求。這些深水鑽井作業尤其帶來了獨特的挑戰,需要先進的技術來確保井的完整性並防止不必要的流體遷移。區域隔離是解決這些問題的解決方案,特別是在現有油井的產量下降的情況下。
| 市場範圍 | |
|---|---|
| 起始年份 | 2024 |
| 預測年份 | 2025-2034 |
| 起始值 | 249億美元 |
| 預測值 | 411億美元 |
| 複合年成長率 | 5.2% |
區域隔離市場的化學部分預計將獲得顯著發展,到 2034 年收入將超過 218 億美元。生物聚合物、彈性體和聚合物凝膠的使用增強了它們與水泥和鑽井液的兼容性,從而提高了淺井和深井應用中的操作效率。
包括深水和超深水探勘在內的海上應用預計也將推動市場成長,到 2034 年複合年成長率將超過 5.5%。隨著淺層和陸上資源的減少,探索海上資源的推動預計將重塑該產業,並帶來巨大的成長潛力。
到 2034 年,美國區域封隔市場規模預計將超過 60 億美元。此外,隨著營運商尋求最大限度提高現有油井的產量並開發新油田,該國已探明的石油儲量和不斷增加的鑽井項目正在推動市場擴張。
目錄
第 1 章:方法論與範圍
- 市場定義
- 基礎估算與計算
- 預測計算
- 資料來源
- 基本的
- 次要
- 有薪資的
- 民眾
第 2 章:執行摘要
第 3 章:產業洞察
- 產業生態系統分析
- 監管格局
- 產業衝擊力
- 成長動力
- 產業陷阱與挑戰
- 成長潛力分析
- 波特的分析
- 供應商的議價能力
- 買家的議價能力
- 新進入者的威脅
- 替代品的威脅
- PESTEL 分析
第4章:競爭格局
- 介紹
- 戰略儀表板
- 創新與永續發展格局
第 5 章:市場規模與預測:按應用,2021 – 2034 年
- 主要趨勢
- 陸上
- 海上
- 淺的
- 深的
- 超深
第 6 章:市場規模與預測:依方法,2021 – 2034 年
- 主要趨勢
- 機械的
- 滑動套筒
- 包裝工
- 穿孔/開槽襯管
- 其他
- 化學
- 聚合物凝膠
- 單體體系
- 生物聚合物
- 彈性體
- 其他
第 7 章:市場規模及預測:按地區,2021 – 2034 年
- 主要趨勢
- 北美洲
- 美國
- 加拿大
- 墨西哥
- 歐洲
- 英國
- 挪威
- 荷蘭
- 俄羅斯
- 亞太地區
- 中國
- 印度
- 澳洲
- 印尼
- 馬來西亞
- 泰國
- 中東和非洲
- 沙烏地阿拉伯
- 阿拉伯聯合大公國
- 埃及
- 土耳其
- 安哥拉
- 拉丁美洲
- 巴西
- 阿根廷
第8章:公司簡介
- Archer
- Baker Hughes
- Calfrac Well Services
- Expro
- Halliburton
- Helix Energy Solutions
- Hunting Energy Services
- Hydra Well Intervention
- NOV
- Omega Well Intervention
- Schlumberger
- Superior Energy Services
- TAM International
- Trican
- Weatherford
- Wellcem
- Welltec
The Global Zonal Isolation Market was valued at USD 24.9 billion in 2024, with projections indicating a steady growth at a CAGR of 5.2% from 2025 to 2034. The increasing focus on oil and gas exploration, coupled with rising offshore investments, is significantly shaping the growth trajectory of the market. A key driver is the surge in capital expenditure from oil and gas companies as they respond to the growing demand for energy. This heightened demand for oilfield equipment and services is anticipated to further boost the zonal isolation market.
The trend of tapping into deeper and ultra-deep wells, known for their potential to yield high volumes of oil and gas, is accelerating the need for effective zonal isolation methods. These deep-water drilling operations, in particular, present unique challenges, requiring advanced techniques to secure well integrity and prevent unwanted fluid migration. Zonal isolation serves as a solution for addressing these issues, particularly as existing wells experience diminishing production rates.
| Market Scope | |
|---|---|
| Start Year | 2024 |
| Forecast Year | 2025-2034 |
| Start Value | $24.9 Billion |
| Forecast Value | $41.1 Billion |
| CAGR | 5.2% |
The chemical segment of the zonal isolation market is expected to gain significant traction, with revenues surpassing USD 21.8 billion by 2034. This growth is attributed to the superior long-term stability of chemical methods, particularly in extreme temperature environments. The use of bio polymers, elastomers, and polymer gels enhances their compatibility with cement and drilling fluids, improving operational efficiency in both shallow and deep well applications.
Offshore applications, which include deep and ultra-deep-water exploration, are also expected to drive market growth, with a CAGR exceeding 5.5% through 2034. Companies are increasingly investing in advanced technologies to access untapped reserves in previously unreachable deep-water locations. As shallow and onshore resources dwindle, the push toward exploring offshore opportunities is expected to reshape the industry, presenting significant growth potential.
The U.S. zonal isolation market is set to surpass USD 6 billion by 2034. The demand for zonal isolation methods in the U.S. is being driven by the large number of mature oilfields and favorable regulatory measures supporting drilling activities. Additionally, the country's proven oil reserves and increasing drilling projects are fueling market expansion as operators seek to maximize production from existing wells and develop new fields.
Table of Contents
Chapter 1 Methodology & Scope
- 1.1 Market definitions
- 1.2 Base estimates & calculations
- 1.3 Forecast calculation
- 1.4 Data sources
- 1.4.1 Primary
- 1.4.2 Secondary
- 1.4.2.1 Paid
- 1.4.2.2 Public
Chapter 2 Executive Summary
- 2.1 Industry synopsis, 2021 - 2034
Chapter 3 Industry Insights
- 3.1 Industry ecosystem analysis
- 3.2 Regulatory landscape
- 3.3 Industry impact forces
- 3.3.1 Growth drivers
- 3.3.2 Industry pitfalls & challenges
- 3.4 Growth potential analysis
- 3.5 Porter's analysis
- 3.5.1 Bargaining power of suppliers
- 3.5.2 Bargaining power of buyers
- 3.5.3 Threat of new entrants
- 3.5.4 Threat of substitutes
- 3.6 PESTEL analysis
Chapter 4 Competitive Landscape, 2024
- 4.1 Introduction
- 4.2 Strategic dashboard
- 4.3 Innovation & sustainability landscape
Chapter 5 Market Size and Forecast, By Application, 2021 – 2034 (USD Million)
- 5.1 Key trends
- 5.2 Onshore
- 5.3 Offshore
- 5.3.1 Shallow
- 5.3.2 Deep
- 5.3.3 Ultra-deep
Chapter 6 Market Size and Forecast, By Method, 2021 – 2034 (USD Million)
- 6.1 Key trends
- 6.2 Mechanical
- 6.2.1 Sliding sleeves
- 6.2.2 Packers
- 6.2.3 Perforated/Slotted liners
- 6.2.4 Others
- 6.3 Chemical
- 6.3.1 Polymer gels
- 6.3.2 Monomer systems
- 6.3.3 Bio-Polymers
- 6.3.4 Elastomers
- 6.3.5 Others
Chapter 7 Market Size and Forecast, By Region, 2021 – 2034 (USD Million)
- 7.1 Key trends
- 7.2 North America
- 7.2.1 U.S
- 7.2.2 Canada
- 7.2.3 Mexico
- 7.3 Europe
- 7.3.1 UK
- 7.3.2 Norway
- 7.3.3 Netherlands
- 7.3.4 Russia
- 7.4 Asia Pacific
- 7.4.1 China
- 7.4.2 India
- 7.4.3 Australia
- 7.4.4 Indonesia
- 7.4.5 Malaysia
- 7.4.6 Thailand
- 7.5 Middle East & Africa
- 7.5.1 Saudi Arabia
- 7.5.2 UAE
- 7.5.3 Egypt
- 7.5.4 Turkey
- 7.5.5 Angola
- 7.6 Latin America
- 7.6.1 Brazil
- 7.6.2 Argentina
Chapter 8 Company Profiles
- 8.1 Archer
- 8.2 Baker Hughes
- 8.3 Calfrac Well Services
- 8.4 Expro
- 8.5 Halliburton
- 8.6 Helix Energy Solutions
- 8.7 Hunting Energy Services
- 8.8 Hydra Well Intervention
- 8.9 NOV
- 8.10 Omega Well Intervention
- 8.11 Schlumberger
- 8.12 Superior Energy Services
- 8.13 TAM International
- 8.14 Trican
- 8.15 Weatherford
- 8.16 Wellcem
- 8.17 Welltec
 油井干預服務市場 - 全球產業規模、佔有率、趨勢、機會和預測,按干預類型、服務、應用、地區、競爭細分,2020-2030 年預測隨鑽測井市場 - 全球產業規模、佔有率、趨勢、機會和預測,按服務、技術、應用、部署類型、地區、競爭細分,2020-2030F2025 年油井干預全球市場報告
 鑽井市場規模、佔有率和成長分析(按服務類型、應用、技術、最終用途和地區)- 產業預測 2025-2032
 世界井下干涉服務市場 2025-2029
 海底油井干預:市場佔有率分析、產業趨勢、成長預測(2025-2030)
 坑井干預的全球市場:市場規模·佔有率·趨勢,產業分析 (各類服務·各用途·干預·各地區),未來預測 (2025年~2034年)區域隔離市場 - 按技術(機械、化學)、應用(陸上、海上)、地區和競爭細分的全球行業規模、佔有率、趨勢、機會和預測,2019-2029F
 油井干預市場機會、成長動力、產業趨勢分析與 2025 - 2034 年預測
 2021-2031 年油井干預市場規模及預測、全球和區域佔有率、趨勢和成長機會分析報告範圍:按服務、應用、干預、油井類型和地理位置