


 |
市場調查報告書
商品編碼
1666956
連續油管市場機會、成長動力、產業趨勢分析及 2025 - 2034 年預測Coiled Tubing Market Opportunity, Growth Drivers, Industry Trend Analysis, and Forecast 2025 - 2034 |
||||||
2024 年全球連續油管市場規模達到 30 億美元,預計 2025 年至 2034 年期間的複合年成長率為 4.5%。對高效營運、成本效益和永續解決方案的日益關注進一步推動了市場擴張。
由於營運商優先考慮提高油井完整性和延長老化資產的使用壽命,預計到 2034 年油井干預服務部門將創造 21 億美元。自動化、井下感測器和即時資料分析等先進技術的採用,透過提高操作效率和精度,正在改變干預活動。為了應對惡劣的井況和複雜的油藏,產業參與者正在開發專門的材料和設備,包括高壓控制系統和耐腐蝕合金,進一步推動該領域的成長。
| 市場範圍 | |
|---|---|
| 起始年份 | 2024 |
| 預測年份 | 2025-2034 |
| 起始值 | 30億美元 |
| 預測值 | 46億美元 |
| 複合年成長率 | 4.5% |
預計到 2034 年,陸上連續油管市場將實現 4% 的成長率,這得益於石油和天然氣作業對經濟高效的解決方案的需求不斷成長。遠端監控和自動化等技術的進步正在簡化連續油管操作、提高準確性並最大限度地減少停機時間。井改造和壓裂服務正在獲得發展勢頭,特別是對於需要提高產量或進行維護的陸上油田。這種趨勢在老化油井中尤其明顯,操作員的目標是最佳化性能和提高生產力。
到 2034 年,美國連續油管市場預計將創收 10 億美元,這主要得益於水平鑽井和水力壓裂等技術對碳氫化合物生產的大力推動。能源密集產業的投資不斷成長以及對石油和天然氣資源的需求不斷上升強化了市場的成長軌跡。正在進行的探勘活動以及高效資源開採的需求也促使該地區擴大採用連續油管解決方案。
由於能源需求的不斷成長、石油和天然氣探勘活動的不斷擴大以及對最佳化油井性能的重視,連續油管市場將經歷持續成長。技術創新與永續且經濟高效的解決方案相結合,正在重塑營運並推動採用。對先進干預服務和陸上應用的日益重視進一步凸顯了未來十年市場穩步擴張的潛力。
目錄
第 1 章:方法論與範圍
- 市場定義
- 基礎估算與計算
- 預測計算
- 資料來源
- 基本的
- 次要
- 有薪資的
- 民眾
第 2 章:執行摘要
第 3 章:產業洞察
- 產業生態系統分析
- 監管格局
- 產業衝擊力
- 成長動力
- 產業陷阱與挑戰
- 成長潛力分析
- 波特的分析
- 供應商的議價能力
- 買家的議價能力
- 新進入者的威脅
- 替代品的威脅
- PESTEL 分析
第4章:競爭格局
- 介紹
- 戰略儀表板
- 創新與永續發展格局
第 5 章:市場規模及預測:依服務,2021 – 2034 年
- 主要趨勢
- 油井干預
- 井清潔
- 完井
- 釣魚
- 穿孔
- 日誌記錄
- 其他
- 鑽孔
- 控壓鑽井
- 定向鑽井
第 6 章:市場規模與預測:按應用,2021 – 2034 年
- 主要趨勢
- 陸上
- 服務
- 井干預
- 井清潔
- 完井
- 釣魚
- 服務
6.2.1.3.2 穿孔
6.2.1.3.3 日誌記錄
6.2.1.3.4 其他
- 鑽孔
- 控壓鑽井
- 定向鑽井
- 海上
- 淺的
- 井干預
- 井清潔
- 完井
- 釣魚
- 穿孔
- 日誌記錄
- 其他
- 鑽孔
- 控壓鑽井
- 定向鑽井
- 深的
- 井干預
- 井清潔
- 完井
- 釣魚
- 穿孔
- 日誌記錄
- 其他
- 鑽孔
- 控壓鑽井
- 定向鑽井
- 超深
- 井干預
- 井清潔
- 完井
- 釣魚
- 穿孔
- 日誌記錄
- 其他
- 鑽孔
- 控壓鑽井
- 定向鑽井
- 淺的
第 7 章:市場規模及預測:按地區,2021 – 2034 年
- 主要趨勢
- 北美洲
- 美國
- 加拿大
- 歐洲
- 俄羅斯
- 英國
- 挪威
- 荷蘭
- 亞太地區
- 中國
- 印度
- 澳洲
- 印尼
- 中東和非洲
- 沙烏地阿拉伯
- 阿拉伯聯合大公國
- 埃及
- 拉丁美洲
- 巴西
- 墨西哥
- 阿根廷
第8章:公司簡介
- Baker Hughes
- Calfrac Well Services
- CJ Well Services
- Halliburton
- KLX Energy
- Nabors Industries
- National Oilwell Varco
- Nine Energy Service
- Royal IHC
- Schlumberger
- STEP Energy Services
- Tenaris
- Trican
- Weatherford
- Well Service Group
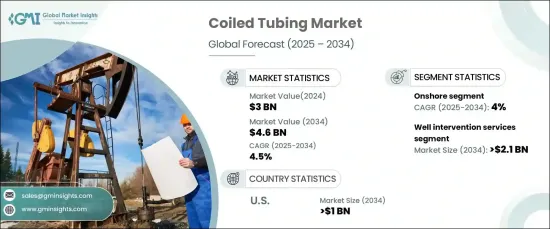
The Global Coiled Tubing Market reached USD 3 billion in 2024 and is anticipated to grow at a CAGR of 4.5% from 2025 to 2034. This growth is primarily driven by rising exploration and production (E&P) investments, surging energy demands, and the need for enhanced services to maintain mature oil fields. Increasing focus on efficient operations, cost-effectiveness, and sustainable solutions is further propelling market expansion.
The well intervention services segment is expected to generate USD 2.1 billion by 2034 as operators prioritize improving well integrity and extending the lifespan of aging assets. The adoption of advanced technologies, such as automation, downhole sensors, and real-time data analytics, is transforming intervention activities by enhancing operational efficiency and precision. To address harsh well conditions and complex reservoirs, industry players are developing specialized materials and equipment, including high-pressure control systems and corrosion-resistant alloys, further driving growth in this segment.
| Market Scope | |
|---|---|
| Start Year | 2024 |
| Forecast Year | 2025-2034 |
| Start Value | $3 Billion |
| Forecast Value | $4.6 Billion |
| CAGR | 4.5% |
The onshore coiled tubing market is projected to witness a growth rate of 4% through 2034, fueled by the increasing demand for cost-effective solutions in oil and gas operations. Advancements in technology, such as remote monitoring and automation, are streamlining coiled tubing operations, improving accuracy, and minimizing downtime. Well stimulation and fracturing services are gaining momentum, particularly for onshore fields requiring production enhancements or maintenance. This trend is particularly evident in aging wells where operators aim to optimize performance and extend productivity.
U.S. coiled tubing market is poised to generate USD 1 billion through 2034, driven by a strong focus on hydrocarbon production through technologies like horizontal drilling and hydraulic fracturing. Growing investments in energy-intensive sectors and the rising demand for oil and gas resources reinforce the market's growth trajectory. Ongoing exploration activities, along with the need for efficient resource extraction, are also contributing to the increased adoption of coiled tubing solutions across the region.
The coiled tubing market is set to experience consistent growth due to rising energy needs, expanding oil and gas exploration activities, and the focus on optimizing well performance. Technological innovations, coupled with sustainable and cost-efficient solutions, are reshaping operations and driving adoption. The increasing emphasis on advanced intervention services and onshore applications further highlights the market's potential for steady expansion over the coming decade.
Table of Contents
Chapter 1 Methodology & Scope
- 1.1 Market definitions
- 1.2 Base estimates & calculations
- 1.3 Forecast calculation
- 1.4 Data sources
- 1.4.1 Primary
- 1.4.2 Secondary
- 1.4.2.1 Paid
- 1.4.2.2 Public
Chapter 2 Executive Summary
- 2.1 Industry 360° synopsis, 2021 - 2034
Chapter 3 Industry Insights
- 3.1 Industry ecosystem analysis
- 3.2 Regulatory landscape
- 3.3 Industry impact forces
- 3.3.1 Growth drivers
- 3.3.2 Industry pitfalls & challenges
- 3.4 Growth potential analysis
- 3.5 Porter's analysis
- 3.5.1 Bargaining power of suppliers
- 3.5.2 Bargaining power of buyers
- 3.5.3 Threat of new entrants
- 3.5.4 Threat of substitutes
- 3.6 PESTEL analysis
Chapter 4 Competitive Landscape, 2024
- 4.1 Introduction
- 4.2 Strategic dashboard
- 4.3 Innovation & sustainability landscape
Chapter 5 Market Size and Forecast, By Service, 2021 – 2034 (USD Million, Units)
- 5.1 Key trends
- 5.2 Well Intervention
- 5.3 Well cleaning
- 5.4 Well completion
- 5.4.1 Fishing
- 5.4.2 Perforation
- 5.4.3 Logging
- 5.4.4 Others
- 5.5 Drilling
- 5.5.1 Managed pressure drilling
- 5.5.2 Directional drilling
Chapter 6 Market Size and Forecast, By Application, 2021 – 2034 (USD Million, Units)
- 6.1 Key trends
- 6.2 Onshore
- 6.2.1 Service
- 6.2.1.1 Well intervention
- 6.2.1.2 Well cleaning
- 6.2.1.3 Well completion
- 6.2.1.3.1 Fishing
- 6.2.1.3.2 Perforation
- 6.2.1.3.3 Logging
- 6.2.1.3.4 Others
- 6.2.1 Service
- 6.2.4 Drilling
- 6.2.4.1 Managed pressure drilling
- 6.2.4.2 Directional drilling
- 6.3 Offshore
- 6.3.1 Shallow
- 6.3.1.1 Well intervention
- 6.3.1.2 Well cleaning
- 6.3.1.3 Well completion
- 6.3.1.3.1 Fishing
- 6.3.1.3.2 Perforation
- 6.3.1.3.3 Logging
- 6.3.1.3.4 Others
- 6.3.1.4 Drilling
- 6.3.1.4.1 Managed pressure drilling
- 6.3.1.4.2 Directional drilling
- 6.3.2 Deep
- 6.3.2.1 Well intervention
- 6.3.2.2 Well cleaning
- 6.3.2.3 Well completion
- 6.3.2.3.1 Fishing
- 6.3.2.3.2 Perforation
- 6.3.2.3.3 Logging
- 6.3.2.3.4 Others
- 6.3.2.4 Drilling
- 6.3.2.4.1 Managed pressure drilling
- 6.3.2.4.2 Directional drilling
- 6.3.3 Ultra-Deep
- 6.3.3.1 Well intervention
- 6.3.3.2 Well cleaning
- 6.3.3.3 Well completion
- 6.3.3.3.1 Fishing
- 6.3.3.3.2 Perforation
- 6.3.3.3.3 Logging
- 6.3.3.3.4 Others
- 6.3.3.4 Drilling
- 6.3.3.4.1 Managed pressure drilling
- 6.3.3.4.2 Directional drilling
- 6.3.1 Shallow
Chapter 7 Market Size and Forecast, By Region, 2021 – 2034 (USD Million, Units)
- 7.1 Key trends
- 7.2 North America
- 7.2.1 U.S.
- 7.2.2 Canada
- 7.3 Europe
- 7.3.1 Russia
- 7.3.2 UK
- 7.3.3 Norway
- 7.3.4 Netherlands
- 7.4 Asia Pacific
- 7.4.1 China
- 7.4.2 India
- 7.4.3 Australia
- 7.4.4 Indonesia
- 7.5 Middle East & Africa
- 7.5.1 Saudi Arabia
- 7.5.2 UAE
- 7.5.3 Egypt
- 7.6 Latin America
- 7.6.1 Brazil
- 7.6.2 Mexico
- 7.6.3 Argentina
Chapter 8 Company Profiles
- 8.1 Baker Hughes
- 8.2 Calfrac Well Services
- 8.3 CJ Well Services
- 8.4 Halliburton
- 8.5 KLX Energy
- 8.6 Nabors Industries
- 8.7 National Oilwell Varco
- 8.8 Nine Energy Service
- 8.9 Royal IHC
- 8.10 Schlumberger
- 8.11 STEP Energy Services
- 8.12 Tenaris
- 8.13 Trican
- 8.14 Weatherford
- 8.15 Well Service Group
 2032 年撓曲油管服務市場預測:按服務類型、應用、最終用戶和地區進行的全球分析撓曲油管市場規模、佔有率和成長分析(按服務、應用、車隊和地區)- 2025-2032 年產業預測
 2025 年撓曲油管服務全球市場報告
 連續油管的全球市場:市場規模·佔有率·趨勢,產業分析 (各類服務·工作·各用途·各地區),未來預測 (2025年~2034年)2025 年全球盤管市場報告
 北美撓曲油管服務:市場佔有率分析、產業趨勢與成長預測(2025-2030)歐洲撓曲油管:市場佔有率分析、產業趨勢、成長預測(2025-2030)連續油管市場 - 全球產業規模、佔有率、趨勢、機會和預測,按服務類型(修井、鑽井、其他)、應用(陸上、海上)、地區和競爭細分,2019-2029F
 撓曲油管市場:按服務類型、按應用分類 - 2025-2030 年全球預測
 全球撓曲油管市場,2024-2028