


 |
市場調查報告書
商品編碼
1667111
多平台鑽井市場機會、成長動力、產業趨勢分析與 2025 - 2034 年預測Multi Pad Drilling Market Opportunity, Growth Drivers, Industry Trend Analysis, and Forecast 2025 - 2034 |
||||||
2024 年全球多平台鑽井市場價值為 779 億美元,預計 2025 年至 2034 年期間將以 7.8% 的強勁複合年成長率成長。此外,市場還受益於技術進步,這些技術進步有助於降低鑽井和基礎設施成本,同時提高效率並最大限度地減少環境影響。政府旨在保護環境的法規以及鼓勵探勘未開發儲備的政策將進一步支持該行業的成長軌跡。
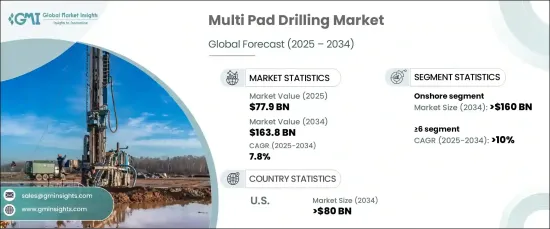
預計到 2034 年,陸上鑽井產業的規模將超過 1,600 億美元。技術創新和增強的探勘能力以及資源再開發的支持性監管框架預計將推動市場需求。採用多平台系統等先進鑽井技術將在滿足不斷成長的能源需求、維持較低營運成本和最佳化開採過程方面發揮關鍵作用。
| 市場範圍 | |
|---|---|
| 起始年份 | 2024 |
| 預測年份 | 2025-2034 |
| 起始值 | 779億美元 |
| 預測值 | 1638億美元 |
| 複合年成長率 | 7.8% |
預計到 2034 年,多平台鑽井系統市場(特別是 >=6 細分市場)的複合年成長率將超過 10%。多平台鑽井使操作員能夠從單一位置挖掘多個碳氫化合物儲層,從而提高鑽井作業的效率和獲利能力。對更大墊塊配置的追求,以及對資源最佳化和盡量減少環境破壞的日益關注,將進一步推動該領域的市場擴張。
受頁岩氣和其他油氣資源持續探勘和生產的推動,美國多平台鑽井市場規模預計到 2034 年將達到 800 億美元。預計各能源項目資本支出的增加將持續推動市場需求。為了維持生產和實現擴張目標而對石油基礎設施進行的大量投資將對市場成長產生積極影響,特別是在海上鑽井活動和常規資源可用性持續上升的情況下。
目錄
第 1 章:方法論與範圍
- 市場定義
- 基礎估算與計算
- 預測計算
- 資料來源
- 基本的
- 次要
- 有薪資的
- 民眾
第 2 章:執行摘要
第 3 章:產業洞察
- 產業生態系統分析
- 監管格局
- 產業衝擊力
- 成長動力
- 產業陷阱與挑戰
- 成長潛力分析
- 波特的分析
- 供應商的議價能力
- 買家的議價能力
- 新進入者的威脅
- 替代品的威脅
- PESTEL 分析
第4章:競爭格局
- 介紹
- 戰略儀表板
- 創新與永續發展格局
第 5 章:市場規模及預測:按 Pad,2021 – 2034 年
- 主要趨勢
- <6
- ≥6
第 6 章:市場規模與預測:按應用,2021 – 2034 年
- 主要趨勢
- 陸上
- 海上
第 7 章:市場規模及預測:按地區,2021 – 2034 年
- 主要趨勢
- 北美洲
- 美國
- 加拿大
- 墨西哥
- 歐洲
- 英國
- 俄羅斯
- 挪威
- 亞太地區
- 中國
- 印度
- 印尼
- 泰國
- 中東和非洲
- 沙烏地阿拉伯
- 阿拉伯聯合大公國
- 卡達
- 奈及利亞
- 拉丁美洲
- 巴西
- 阿根廷
第8章:公司簡介
- Baker Hughes
- Chevron
- ConocoPhillips
- Continental
- Devon
- ExxonMobil
- Halliburton
- Hess
- Nabors
- NOV
- Nostra Terra
- Petrofac
- Schlumberger
- Weatherford
The Global Multi Pad Drilling Market was valued at USD 77.9 billion in 2024 and is projected to expand at a robust CAGR of 7.8% from 2025 to 2034. This growth is primarily driven by the increased exploration and production of unconventional resources such as tight gas and shale oil, as well as the rising number of rigs being deployed. Additionally, the market is benefiting from technological advancements that help reduce drilling and infrastructure costs while improving efficiency and minimizing environmental impact. Government regulations aimed at protecting the environment, along with policies encouraging the exploration of untapped reserves, will further support the sector's growth trajectory.
The onshore drilling segment is expected to surpass USD 160 billion by 2034. This rise will be fueled by higher investment levels and the rich resource potential found in remote locations across various regions. Technological innovations and enhanced exploration capabilities, along with supportive regulatory frameworks for resource redevelopment, are expected to propel market demand. The adoption of advanced drilling techniques, such as multi-pad systems, will play a key role in meeting the rising demand for energy while keeping operational costs low and optimizing extraction processes.
| Market Scope | |
|---|---|
| Start Year | 2024 |
| Forecast Year | 2025-2034 |
| Start Value | $77.9 Billion |
| Forecast Value | $163.8 Billion |
| CAGR | 7.8% |
The market for multi-pad drilling systems, specifically in the >=6 segment, is forecasted to grow at a CAGR exceeding 10% through 2034. This surge is largely driven by extensive investments in offshore drilling, where significant capital is being allocated for oil and gas projects. Multi-pad drilling enables operators to tap into multiple hydrocarbon reservoirs from a single location, enhancing both the efficiency and profitability of drilling operations. The push for larger pad configurations, as well as a growing focus on resource optimization with minimal environmental disruption, will further drive market expansion in this segment.
The multi-pad drilling market in the U.S. is projected to reach USD 80 billion by 2034, spurred by the ongoing exploration and production of shale gas and other oil and gas resources. The increase in capital expenditure across various energy projects is expected to continue driving market demand. Significant investments in oil infrastructure to sustain production and achieve expansion goals will positively impact market growth, particularly as offshore drilling activities and conventional resource availability continue to rise.
Table of Contents
Chapter 1 Methodology & Scope
- 1.1 Market definitions
- 1.2 Base estimates & calculations
- 1.3 Forecast calculation
- 1.4 Data sources
- 1.4.1 Primary
- 1.4.2 Secondary
- 1.4.2.1 Paid
- 1.4.2.2 Public
Chapter 2 Executive Summary
- 2.1 Industry synopsis, 2021 - 2034
Chapter 3 Industry Insights
- 3.1 Industry ecosystem analysis
- 3.2 Regulatory landscape
- 3.3 Industry impact forces
- 3.3.1 Growth drivers
- 3.3.2 Industry pitfalls & challenges
- 3.4 Growth potential analysis
- 3.5 Porter's analysis
- 3.5.1 Bargaining power of suppliers
- 3.5.2 Bargaining power of buyers
- 3.5.3 Threat of new entrants
- 3.5.4 Threat of substitutes
- 3.6 PESTEL analysis
Chapter 4 Competitive Landscape, 2024
- 4.1 Introduction
- 4.2 Strategic dashboard
- 4.3 Innovation & sustainability landscape
Chapter 5 Market Size and Forecast, By Pad, 2021 – 2034 (USD Million)
- 5.1 Key trends
- 5.2 <6
- 5.3 ≥6
Chapter 6 Market Size and Forecast, By Application, 2021 – 2034 (USD Million)
- 6.1 Key trends
- 6.2 Onshore
- 6.3 Offshore
Chapter 7 Market Size and Forecast, By Region, 2021 – 2034 (USD Million)
- 7.1 Key trends
- 7.2 North America
- 7.2.1 U.S.
- 7.2.2 Canada
- 7.2.3 Mexico
- 7.3 Europe
- 7.3.1 UK
- 7.3.2 Russia
- 7.3.3 Norway
- 7.4 Asia Pacific
- 7.4.1 China
- 7.4.2 India
- 7.4.3 Indonesia
- 7.4.4 Thailand
- 7.5 Middle East & Africa
- 7.5.1 Saudi Arabia
- 7.5.2 UAE
- 7.5.3 Qatar
- 7.5.4 Nigeria
- 7.6 Latin America
- 7.6.1 Brazil
- 7.6.2 Argentina
Chapter 8 Company Profiles
- 8.1 Baker Hughes
- 8.2 Chevron
- 8.3 ConocoPhillips
- 8.4 Continental
- 8.5 Devon
- 8.6 ExxonMobil
- 8.7 Halliburton
- 8.8 Hess
- 8.9 Nabors
- 8.10 NOV
- 8.11 Nostra Terra
- 8.12 Petrofac
- 8.13 Schlumberger
- 8.14 Weatherford
 多平台鑽井市場 - 全球產業規模、佔有率、趨勢、機會和預測,細分,按服務類型、按應用、按平台、按地區、按競爭,2020-2030F
 全球水力壓裂市場研究報告 - 產業分析、規模、佔有率、成長、趨勢和預測 2025 年至 2033 年
 水力壓裂市場 - 全球產業規模、佔有率、趨勢、機會和預測,細分,按井類型、按技術、按材料、按流體類型、按應用、按地區和競爭,2020-2030F
 2025 年全球頁岩氣處理設備市場報告
 2025 年水力壓裂全球市場報告
 2025-2033 年按井類型、流體類型、技術、應用和地區分類的水力壓裂市場報告
 頁岩氣加工設備市場 - 全球產業規模、佔有率、趨勢、機會和預測,按頻率、應用、地區和競爭細分,2020-2030F
 歐洲水力壓裂液 -市場佔有率分析、產業趨勢與統計、成長預測(2025-2030 年)
 水力壓裂市場機會、成長動力、產業趨勢分析與 2025 - 2034 年預測
 水力壓裂市場(按井型、技術、應用和地區分類)