


 |
市場調查報告書
商品編碼
1667114
直流太陽能電纜市場機會、成長動力、產業趨勢分析及 2025 - 2034 年預測DC Solar Cable Market Opportunity, Growth Drivers, Industry Trend Analysis, and Forecast 2025 - 2034 |
||||||
2024 年全球直流太陽能電纜市場價值為 19 億美元,預計 2025 年至 2034 年期間將以 8.5% 的強勁複合年成長率成長。隨著世界各國政府和產業採用永續能源解決方案,對高效耐用的直流太陽能電纜的需求激增。這些電纜對於將直流電 (DC) 從太陽能板傳輸到逆變器至關重要,可確保最小的能量損失和最佳的性能。隨著太陽能成為住宅、商業和公用事業規模應用的主要能源,對支援這些系統的高品質、耐用電纜的需求比以往任何時候都更大。光伏(PV)系統的日益普及及其在各個領域的廣泛應用是需求激增的主要原因。
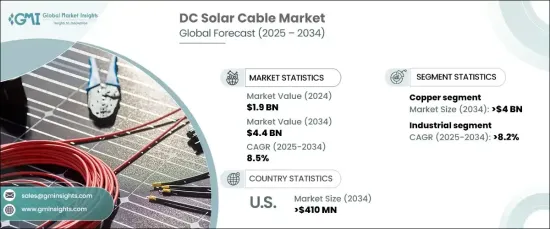
預計銅導體市場將佔據主導地位,到 2034 年創收 40 億美元。它以最大限度地減少能量損失並保持高效率而聞名,即使在惡劣的環境條件下也是如此。此外,銅的耐高溫和抗腐蝕能力確保了這些電纜的長使用壽命,使其成為大型太陽能裝置的理想選擇。隨著擴大太陽能專案的需求不斷成長,對銅基直流太陽能電纜的需求也持續攀升,這得益於其可靠的性能和滿足現代太陽能系統嚴格要求的能力。
| 市場範圍 | |
|---|---|
| 起始年份 | 2024 |
| 預測年份 | 2025-2034 |
| 起始值 | 19億美元 |
| 預測值 | 44億美元 |
| 複合年成長率 | 8.5% |
工業部門預計將實現顯著成長,到 2034 年預計複合年成長率為 8.2%。政府激勵措施,包括稅收抵免和清潔能源補貼,正在加速工業設施採用太陽能發電系統。隨著工業環境中太陽能的使用不斷成長,對能夠有效處理高電壓和電流水平並保持最佳性能的堅固直流太陽能電纜的需求也在不斷成長。這些工業太陽能裝置需要能夠承受惡劣條件並提供長期可靠性的電纜,這使得高品質的直流太陽能電纜成為必需品。
在美國,直流太陽能電纜市場預計到 2034 年將達到 4.1 億美元。聯邦和州的激勵措施,例如投資稅收抵免(ITC)計劃,使得向太陽能的轉變在經濟上更加可行。此外,美國政府對碳中和的承諾以及對再生能源基礎設施的大規模投資,正在加速全國範圍內採用太陽能,進一步推動對高性能直流太陽能電纜的需求。因此,隨著太陽能繼續在多個領域獲得關注,美國市場預計將繼續成長。
目錄
第 1 章:方法論與範圍
- 市場定義
- 基礎估算與計算
- 預測計算
- 資料來源
- 基本的
- 次要
- 有薪資的
- 民眾
第 2 章:執行摘要
第 3 章:產業洞察
- 產業生態系統分析
- 監管格局
- 產業衝擊力
- 成長動力
- 產業陷阱與挑戰
- 成長潛力分析
- 波特的分析
- 供應商的議價能力
- 買家的議價能力
- 新進入者的威脅
- 替代品的威脅
- PESTEL 分析
第4章:競爭格局
- 戰略儀表板
- 創新與永續發展格局
第 5 章:市場規模與預測:依指揮,2021 年至 2034 年
- 主要趨勢
- 銅
- 鋁
- 其他
第 6 章:市場規模與預測:按應用,2021 – 2034 年
- 主要趨勢
- 住宅
- 商業的
- 工業的
第 7 章:市場規模及預測:按地區,2021 – 2034 年
- 主要趨勢
- 北美洲
- 美國
- 加拿大
- 墨西哥
- 歐洲
- 英國
- 法國
- 德國
- 義大利
- 俄羅斯
- 西班牙
- 亞太地區
- 中國
- 澳洲
- 印度
- 日本
- 韓國
- 中東和非洲
- 沙烏地阿拉伯
- 阿拉伯聯合大公國
- 土耳其
- 南非
- 埃及
- 拉丁美洲
- 巴西
- 阿根廷
第8章:公司簡介
- Alpha Wire
- Allied Wire and Cable
- Belden
- Fujikura
- Furukawa Electric
- General Cable
- Havells
- Helukabel
- Hellenic Group
- Kabelwerk Eupen
- KEI Industries
- Lapp Group
- Leoni
- LS Cable and System
- Nexans
- Northwire
- Polycab
- Prysmian Group
- RR Kabel
- Southwire Company
- TE Connectivity
The Global DC Solar Cable Market was valued at USD 1.9 billion in 2024 and is estimated to grow at a robust CAGR of 8.5% from 2025 to 2034. This growth is being fueled by the increasing global shift towards renewable energy and the accelerating focus on solar power. As governments and industries worldwide embrace sustainable energy solutions, the demand for efficient and durable DC solar cables has skyrocketed. These cables are essential for transmitting direct current (DC) from solar panels to inverters, ensuring minimal energy loss and optimal performance. With solar power becoming a leading energy source for residential, commercial, and utility-scale applications, the need for high-quality, long-lasting cables to support these systems is greater than ever. The growing popularity of photovoltaic (PV) systems and their widespread adoption across various sectors are key contributors to this surge in demand.
The copper conductor segment is expected to dominate the market, generating USD 4 billion by 2034. Copper's superior electrical conductivity, thermal stability, and durability make it the material of choice for DC applications within PV systems. It is known for minimizing energy loss and maintaining high efficiency, even under challenging environmental conditions. Furthermore, copper's ability to withstand high heat and resist corrosion ensures a long operational life for these cables, making them ideal for large-scale solar installations. As the demand for expansive solar projects rises, the need for copper-based DC solar cables continues to climb, driven by their reliable performance and ability to meet the rigorous demands of modern solar energy systems.
| Market Scope | |
|---|---|
| Start Year | 2024 |
| Forecast Year | 2025-2034 |
| Start Value | $1.9 Billion |
| Forecast Value | $4.4 Billion |
| CAGR | 8.5% |
The industrial sector is expected to see significant growth, with a projected CAGR of 8.2% through 2034. Industries are increasingly turning to solar power to meet sustainability goals and reduce carbon footprints, with the added benefit of lowering energy costs. Government incentives, including tax credits and subsidies for clean energy, are accelerating the adoption of solar power systems in industrial facilities. As the use of solar energy in industrial settings grows, so too does the demand for robust DC solar cables that can efficiently handle high voltage and current levels while maintaining top performance. These industrial solar installations require cables that can endure challenging conditions and provide long-term reliability, which makes high-quality DC solar cables a necessity.
In the U.S., the DC solar cable market is projected to reach USD 410 million by 2034. The rapid growth in solar installations across residential, commercial, and utility-scale sectors is driving this expansion. Federal and state incentives, such as the Investment Tax Credit (ITC) program, have made the transition to solar energy more financially accessible. In addition, the U.S. government's commitment to carbon neutrality and large-scale investments in renewable energy infrastructure are accelerating the adoption of solar power nationwide, further boosting the demand for high-performance DC solar cables. As a result, the U.S. market is expected to see continued growth as solar energy continues to gain traction across multiple sectors.
Table of Contents
Chapter 1 Methodology & Scope
- 1.1 Market definitions
- 1.2 Base estimates & calculations
- 1.3 Forecast calculation
- 1.4 Data sources
- 1.4.1 Primary
- 1.4.2 Secondary
- 1.4.2.1 Paid
- 1.4.2.2 Public
Chapter 2 Executive Summary
- 2.1 Industry synopsis, 2021 - 2034
Chapter 3 Industry Insights
- 3.1 Industry ecosystem analysis
- 3.2 Regulatory landscape
- 3.3 Industry impact forces
- 3.3.1 Growth drivers
- 3.3.2 Industry pitfalls & challenges
- 3.4 Growth potential analysis
- 3.5 Porter's analysis
- 3.5.1 Bargaining power of suppliers
- 3.5.2 Bargaining power of buyers
- 3.5.3 Threat of new entrants
- 3.5.4 Threat of substitutes
- 3.6 PESTEL analysis
Chapter 4 Competitive landscape, 2024
- 4.1 Strategic dashboard
- 4.2 Innovation & sustainability landscape
Chapter 5 Market Size and Forecast, By Conductor, 2021 – 2034 (USD Million, ‘000 Tonnes)
- 5.1 Key trends
- 5.2 Copper
- 5.3 Aluminum
- 5.4 Others
Chapter 6 Market Size and Forecast, By Application, 2021 – 2034 (USD Million, ‘000 Tonnes)
- 6.1 Key trends
- 6.2 Residential
- 6.3 Commercial
- 6.4 Industrial
Chapter 7 Market Size and Forecast, By Region, 2021 – 2034 (USD Million, ‘000 Tonnes)
- 7.1 Key trends
- 7.2 North America
- 7.2.1 U.S.
- 7.2.2 Canada
- 7.2.3 Mexico
- 7.3 Europe
- 7.3.1 UK
- 7.3.2 France
- 7.3.3 Germany
- 7.3.4 Italy
- 7.3.5 Russia
- 7.3.6 Spain
- 7.4 Asia Pacific
- 7.4.1 China
- 7.4.2 Australia
- 7.4.3 India
- 7.4.4 Japan
- 7.4.5 South Korea
- 7.5 Middle East & Africa
- 7.5.1 Saudi Arabia
- 7.5.2 UAE
- 7.5.3 Turkey
- 7.5.4 South Africa
- 7.5.5 Egypt
- 7.6 Latin America
- 7.6.1 Brazil
- 7.6.2 Argentina
Chapter 8 Company Profiles
- 8.1 Alpha Wire
- 8.2 Allied Wire and Cable
- 8.3 Belden
- 8.4 Fujikura
- 8.5 Furukawa Electric
- 8.6 General Cable
- 8.7 Havells
- 8.8 Helukabel
- 8.9 Hellenic Group
- 8.10 Kabelwerk Eupen
- 8.11 KEI Industries
- 8.12 Lapp Group
- 8.13 Leoni
- 8.14 LS Cable and System
- 8.15 Nexans
- 8.16 Northwire
- 8.17 Polycab
- 8.18 Prysmian Group
- 8.19 RR Kabel
- 8.20 Southwire Company
- 8.21 TE Connectivity
 2025年全球太陽能電纜市場報告
 太陽能電纜市場規模、佔有率、趨勢分析報告(按材料、類型、最終用途、地區、細分市場預測),2025 年至 2030 年THHN 太陽能電纜市場機會、成長動力、產業趨勢分析與 2025 - 2034 年預測商業太陽能電纜市場機會、成長動力、產業趨勢分析和 2025 - 2034 年預測太陽能電纜市場機會、成長動力、產業趨勢分析與 2025 - 2034 年預測
 太陽能電纜市場:按材料、類型、應用和最終用戶分類 - 2025-2030 年全球預測
 太陽能電纜系統的全球市場,2024-2028全球太陽能電纜市場
 太陽能電纜市場至2030年的預測:按材料類型、電壓類型、電纜類型、應用、最終用戶和地區的全球分析
 全球太陽能電纜市場規模、佔有率、行業趨勢分析報告:按類型、最終用途、材料類型、區域展望和預測,2023-2030