


 |
市場調查報告書
商品編碼
1667154
LoRaWAN 市場機會、成長動力、產業趨勢分析與 2025 - 2034 年預測LoRaWAN Market Opportunity, Growth Drivers, Industry Trend Analysis, and Forecast 2025 - 2034 |
||||||
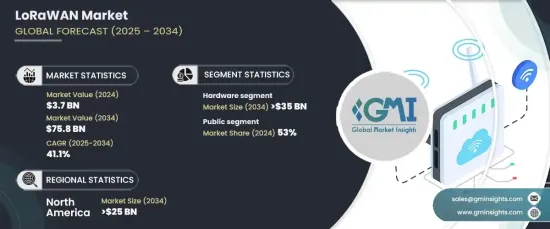
2024 年全球 LoRaWAN 市場價值為 37 億美元,預計 2025 年至 2034 年期間的複合年成長率將達到驚人的 41.1%。這些城市發展對高效率、高速通訊的需求是市場擴張的關鍵驅動力。
LoRaWAN 技術的採用正在不斷增加,因為它能夠透過介質存取控制 (MAC) 協定支援遠距離通訊。此外,其經濟高效、節能的無線網路滿足了對永續物聯網 (IoT) 解決方案的需求。企業還將人工智慧和機器學習等先進的數位工具整合到支援LoRaWAN的網路中,以提高不同行業的營運效率和即時應用效能。
| 市場範圍 | |
|---|---|
| 起始年份 | 2024 |
| 預測年份 | 2025-2034 |
| 起始值 | 37億美元 |
| 預測值 | 758億美元 |
| 複合年成長率 | 41.1% |
工業 4.0 趨勢正在放大這一勢頭,利用互聯設備之間的戰略網路來簡化低功耗廣域網路上的流程。製造業和其他行業對數位化的日益重視增強了基於 LoRaWAN 的解決方案的採用,這些解決方案可最佳化生產效率和質量,同時實現無縫的機器對機器通訊。與藍牙或 Zigbee 等傳統無線技術不同,LoRaWAN 設備提供卓越的遠距離連接,使其成為廣域通訊的理想解決方案。
根據組件,市場分為硬體、軟體和服務。 2024 年,硬體佔據最大佔有率,貢獻超過 45% 的市場。對物聯網設備日益成長的需求和感測器技術的進步資料推動這一領域的發展,預計到 2034 年該領域的規模將超過 350 億美元。
在部署方面,公共網路在2024年佔據了53%的市場佔有率。電信營運商的支持和政府推動節能通訊解決方案的舉措進一步推動了其採用。
從地區來看,北美佔據市場主導地位,2024 年的佔有率超過 30%,預計到 2034 年將達到 250 億美元。 美國仍然是主要貢獻者,這得益於廣泛的物聯網基礎設施投資以及對低功耗、節能技術的關注。政府對物聯網創新的大力支持持續推動各產業的市場成長。
目錄
第 1 章:方法論與範圍
- 研究設計
- 研究方法
- 資料收集方法
- 基礎估計和計算
- 基準年計算
- 市場估計的主要趨勢
- 預測模型
- 初步研究與驗證
- 主要來源
- 資料探勘來源
- 市場定義
第 2 章:執行摘要
第 3 章:產業洞察
- 產業生態系統分析
- 供應商概況
- 晶片組製造商
- 模組製造商
- 設備製造商
- 網路營運商
- 解決方案提供者
- 最終用途
- 利潤率分析
- LoRaWAN 與其他物聯網協定(例如 NB-IoT、Sigfox)的比較
- LoRAWAN 用戶
- 技術與創新格局
- 重要新聞及舉措
- 監管格局
- 衝擊力
- 成長動力
- 增加對智慧城市的投資
- 工業4.0的滲透率不斷提高
- 全球對遠端無線連線的需求不斷增加
- LoRa 閘道器和感測器在製造業的採用日益廣泛
- LoRaWAN 在資產管理和智慧廢棄物管理領域的應用日益廣泛
- 產業陷阱與挑戰
- 對資料安全的擔憂日益增加
- 網路覆蓋和品質
- 成長動力
- 成長潛力分析
- 波特的分析
- PESTEL 分析
第4章:競爭格局
- 介紹
- 公司市佔率分析
- 競爭定位矩陣
- 戰略展望矩陣
第5章:市場估計與預測:按組件,2021 - 2034 年
- 主要趨勢
- 硬體
- 端節點
- 閘道
- 模組
- 軟體
- 服務
- 一體化
- 維護
- 培訓和諮詢
第6章:市場估計與預測:依部署模型,2021 - 2034 年
- 主要趨勢
- 私人的
- 民眾
- 混合
第 7 章:市場估計與預測:按應用,2021 - 2034 年
- 主要趨勢
- 智慧燃氣和水計量
- 資產追蹤
- 智慧建築
- 智慧停車
- 精準農業
- 智慧廢棄物管理
- 牲畜監控
- 其他
第 8 章:市場估計與預測:按最終用途,2021 - 2034 年
- 主要趨勢
- 衛生保健
- 農業
- 物流和運輸
- 製造業
- 實用工具
- 消費性電子產品
- 政府和公共部門
- 其他
第 9 章:市場估計與預測:按地區,2021 - 2034 年
- 主要趨勢
- 北美洲
- 美國
- 加拿大
- 歐洲
- 英國
- 德國
- 法國
- 西班牙
- 義大利
- 俄羅斯
- 北歐
- 亞太地區
- 中國
- 印度
- 日本
- 韓國
- 澳新銀行
- 東南亞
- 拉丁美洲
- 巴西
- 墨西哥
- 阿根廷
- 中東及非洲
- 阿拉伯聯合大公國
- 南非
- 沙烏地阿拉伯
第10章:公司簡介
- A2A Smart City
- Actility
- Adeunis
- Cisco System
- Everynet
- Helium
- Kerlink
- Kontron AG
- KPN
- LORIOT AG
- Meshed
- Microchip Technology
- National Narrowband Network Co. (NNNCo.)
- Orange
- OrbiWise
- Senet
- SMtech
- Swisscom AG
- TEKTELIC Communications
- Worldsensing
The Global LoRaWAN Market, valued at USD 3.7 billion in 2024, is anticipated to grow at an impressive CAGR of 41.1% from 2025 to 2034. This growth is fueled by increasing investments in smart city initiatives focused on advancing transportation, communication, energy, safety, and waste management systems. The need for efficient, high-speed communication in these urban developments is a critical driver of market expansion.
The adoption of LoRaWAN technology is rising due to its ability to support long-range communication through the Medium Access Control (MAC) protocol. In addition, its cost-effective and energy-efficient wireless networks address the demand for sustainable Internet of Things (IoT) solutions. Businesses are also integrating advanced digital tools such as artificial intelligence and machine learning into LoRaWAN-enabled networks to enhance operational efficiencies and real-time application performance across diverse industries.
| Market Scope | |
|---|---|
| Start Year | 2024 |
| Forecast Year | 2025-2034 |
| Start Value | $3.7 Billion |
| Forecast Value | $75.8 Billion |
| CAGR | 41.1% |
Industry 4.0 trends are amplifying this momentum, leveraging strategic networking among interconnected devices to streamline processes over low-power, wide-area networks. The growing emphasis on digitalization in manufacturing and other industries enhances the adoption of LoRaWAN-based solutions, which optimize production efficiency and quality while enabling seamless machine-to-machine communication. Unlike traditional wireless technologies like Bluetooth or Zigbee, LoRaWAN devices provide superior long-range connectivity, positioning them as the ideal solution for wide-area communications.
By component, the market is categorized into hardware, software, and services. Hardware held the largest share in 2024, contributing over 45% to the market. The increasing demand for IoT-enabled devices and advancements in sensor technology are driving this segment, which is forecasted to surpass USD 35 billion by 2034. Components like sensors, gateways, and modules are vital in facilitating efficient data transmission and enhancing network coverage.
In terms of deployment, public networks accounted for 53% of the market share in 2024. These networks are widely preferred for their scalability and cost advantages, particularly for IoT applications requiring broad coverage. Support from telecom operators and government initiatives promoting energy-efficient communication solutions further drives adoption.
Regionally, North America led the market with a share exceeding 30% in 2024 and is projected to reach USD 25 billion by 2034. The U.S. remains a key contributor, driven by extensive IoT infrastructure investments and a focus on low-power, energy-efficient technologies. Strong government support for IoT innovation continues to propel the market's growth across industries.
Table of Contents
Chapter 1 Methodology & Scope
- 1.1 Research design
- 1.1.1 Research approach
- 1.1.2 Data collection methods
- 1.2 Base estimates and calculations
- 1.2.1 Base year calculation
- 1.2.2 Key trends for market estimates
- 1.3 Forecast model
- 1.4 Primary research & validation
- 1.4.1 Primary sources
- 1.4.2 Data mining sources
- 1.5 Market definition
Chapter 2 Executive Summary
- 2.1 Industry 3600 synopsis, 2021 - 2034
Chapter 3 Industry Insights
- 3.1 Industry ecosystem analysis
- 3.2 Supplier landscape
- 3.2.1 Chipset manufacturers
- 3.2.2 Module manufacturers
- 3.2.3 Device manufacturers
- 3.2.4 Network operators
- 3.2.5 Solution providers
- 3.2.6 End Use
- 3.3 Profit margin analysis
- 3.4 Comparison of LoRaWAN with other IoT protocols (e.g., NB-IoT, Sigfox)
- 3.5 LoRAWAN subscribers
- 3.5.1 North America
- 3.5.2 Europe
- 3.5.3 Asia Pacific
- 3.5.4 Latin America
- 3.5.5 MEA
- 3.6 Technology & innovation landscape
- 3.7 Key news & initiatives
- 3.8 Regulatory landscape
- 3.9 Impact forces
- 3.9.1 Growth drivers
- 3.9.1.1 Increasing investments toward smart cities
- 3.9.1.2 Increasing penetration of Industry 4.0
- 3.9.1.3 Increasing demand for long-range wireless connectivity around the world
- 3.9.1.4 The growing adoption of LoRa gateways and sensors in the manufacturing industry
- 3.9.1.5 Growing adoption of LoRaWAN in asset management and smart waste management
- 3.9.2 Industry pitfalls & challenges
- 3.9.2.1 Increasing concerns related to data security
- 3.9.2.2 Network coverage and quality
- 3.9.1 Growth drivers
- 3.10 Growth potential analysis
- 3.11 Porter’s analysis
- 3.12 PESTEL analysis
Chapter 4 Competitive Landscape, 2024
- 4.1 Introduction
- 4.2 Company market share analysis
- 4.3 Competitive positioning matrix
- 4.4 Strategic outlook matrix
Chapter 5 Market Estimates & Forecast, By Component, 2021 - 2034 ($Bn)
- 5.1 Key trends
- 5.2 Hardware
- 5.2.1 End-node
- 5.2.2 Gateway
- 5.2.3 Module
- 5.3 Software
- 5.4 Services
- 5.4.1 Integration
- 5.4.2 Maintenance
- 5.4.3 Training and consulting
Chapter 6 Market Estimates & Forecast, By Deployment Model, 2021 - 2034 ($Bn)
- 6.1 Key trends
- 6.2 Private
- 6.3 Public
- 6.4 Hybrid
Chapter 7 Market Estimates & Forecast, By Application, 2021 - 2034 ($Bn)
- 7.1 Key trends
- 7.2 Smart gas and water metering
- 7.3 Asset tracking
- 7.4 Smart buildings
- 7.5 Smart parking
- 7.6 Precision agriculture
- 7.7 Smart waste management
- 7.8 Livestock monitoring
- 7.9 Others
Chapter 8 Market Estimates & Forecast, By End Use, 2021 - 2034 ($Bn)
- 8.1 Key trends
- 8.2 Healthcare
- 8.3 Agriculture
- 8.4 Logistics and transportation
- 8.5 Manufacturing
- 8.6 Utilities
- 8.7 Consumer electronics
- 8.8 Government and public sector
- 8.9 Others
Chapter 9 Market Estimates & Forecast, By Region, 2021 - 2034 ($Bn)
- 9.1 Key trends
- 9.2 North America
- 9.2.1 U.S.
- 9.2.2 Canada
- 9.3 Europe
- 9.3.1 UK
- 9.3.2 Germany
- 9.3.3 France
- 9.3.4 Spain
- 9.3.5 Italy
- 9.3.6 Russia
- 9.3.7 Nordics
- 9.4 Asia Pacific
- 9.4.1 China
- 9.4.2 India
- 9.4.3 Japan
- 9.4.4 South Korea
- 9.4.5 ANZ
- 9.4.6 Southeast Asia
- 9.5 Latin America
- 9.5.1 Brazil
- 9.5.2 Mexico
- 9.5.3 Argentina
- 9.6 MEA
- 9.6.1 UAE
- 9.6.2 South Africa
- 9.6.3 Saudi Arabia
Chapter 10 Company Profiles
- 10.1 A2A Smart City
- 10.2 Actility
- 10.3 Adeunis
- 10.4 Cisco System
- 10.5 Everynet
- 10.6 Helium
- 10.7 Kerlink
- 10.8 Kontron AG
- 10.9 KPN
- 10.10 LORIOT AG
- 10.11 Meshed
- 10.12 Microchip Technology
- 10.13 National Narrowband Network Co. (NNNCo.)
- 10.14 Orange
- 10.15 OrbiWise
- 10.16 Senet
- 10.17 SMtech
- 10.18 Swisscom AG
- 10.19 TEKTELIC Communications
- 10.20 Worldsensing
 2025年低功耗廣域網路(LPWAN)全球市場報告
 低功耗 WAN:市場佔有率分析、產業趨勢與統計、成長預測(2025-2030 年)LoRa 閘道器市場 - 全球產業規模、佔有率、趨勢、機會和預測,按連接性、應用程式、最終用戶產業、地區和競爭細分,2019-2029 年
 LoRa 和 LoRaWAN 物聯網市場:按組件、網路類型、部署模型、應用程式、最終用戶 - 2025-2030 年全球預測Wi SUN 技術市場 - 全球產業規模、佔有率、趨勢、機會和預測,按組件、應用、最終用戶、地區和競爭細分,2019-2029FLoRa 和 LoRaWAN 物聯網連接:市場佔有率分析、行業趨勢和統計、成長預測(2024-2029 年)
 全球 LoRa 和 LoRaWAN 物聯網市場:按產品、按應用、按最終用戶、按網路部署、按地區 - 預測(~2029 年)
 LPWAN 全球市場:追蹤與預測(2015-2027)
 LoRa 和 LoRaWAN 物聯網市場報告:2030 年趨勢、預測和競爭分析
 低功耗廣域網路 (LPWAN) 成長機會