


 |
市場調查報告書
商品編碼
1667199
FPSO 市場機會、成長動力、產業趨勢分析與 2025 - 2034 年預測FPSO Market Opportunity, Growth Drivers, Industry Trend Analysis, and Forecast 2025 - 2034 |
||||||
2024 年全球 FPSO 市場價值為 43 億美元,預計 2025 年至 2034 年期間將以 12.5% 的強勁複合年成長率成長。隨著陸上石油儲量下降以及陸上基礎設施開發相關成本上升,FPSO因其無需固定結構即可作業而變得越來越受歡迎。離岸營運的彈性是推動市場擴張的重要因素。此外,FPSO能夠以經濟高效的方式加速石油和天然氣生產,其在偏遠海上地區邊際儲量探勘中的應用日益廣泛,這也加強了其在整個行業的應用。
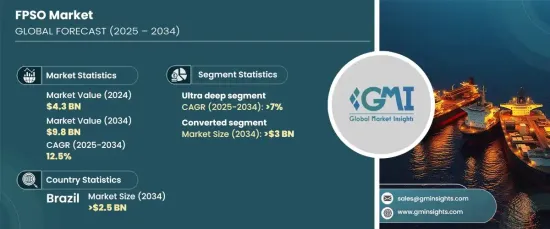
市場對改裝 FPSO 的需求也正在激增,預計到 2034 年將超過 30 億美元。該細分市場受益於可重新利用的退役 FPSO 和油輪,與具有類似功能的新建船舶相比,它們僅需投資一小部分。因此,營運商擴大選擇改裝 FPSO,以降低前期成本並縮短專案時間表。
| 市場範圍 | |
|---|---|
| 起始年份 | 2024 |
| 預測年份 | 2025-2034 |
| 起始值 | 43億美元 |
| 預測值 | 98億美元 |
| 複合年成長率 | 12.5% |
此外,超深水 FPSO 市場預計將穩定成長,到 2034 年預計複合年成長率將超過 7%。這些地區通常蘊藏著較大的石油儲量,隨著探勘技術的進步,其開採難度越來越大,為FPSO的部署創造了有利條件。
預計到 2034 年,巴西的 FPSO 市場規模將超過 25 億美元。此外,隨著營運商努力滿足嚴格的環境標準,同時保持高效的海上作業,對減少排放和能源多樣化的日益關注正在塑造該地區FPSO市場的未來。
目錄
第 1 章:方法論與範圍
- 市場定義
- 基礎估算與計算
- 預測計算
- 資料來源
- 基本的
- 次要
- 有薪資的
- 民眾
第 2 章:執行摘要
第 3 章:產業洞察
- 產業生態系統分析
- 監管格局
- 產業衝擊力
- 成長動力
- 產業陷阱與挑戰
- 成長潛力分析
- 波特的分析
- 供應商的議價能力
- 買家的議價能力
- 新進入者的威脅
- 替代品的威脅
- PESTEL 分析
第4章:競爭格局
- 介紹
- 戰略儀表板
- 創新與永續發展格局
第 5 章:市場規模及預測:依產品,2021 – 2034 年
- 主要趨勢
- 已轉換
- 新建
第6章:市場規模與預測:按水深,2021 – 2034 年
- 主要趨勢
- 淺的
- 深的
- 超深
第 7 章:市場規模與預測:依國家/地區,2021 年至 2034 年
- 主要趨勢
- 美國
- 英國
- 挪威
- 中國
- 印度
- 印尼
- 澳洲
- 巴西
- 蓋亞那
- 世界其他地區
第8章:公司簡介
- Bumi Armada
- BW Offshore
- CNOOC
- DNV
- Hanwha
- Hyundai Heavy Industries
- KBR
- MODEC
- Petrobras
- Saipem
- SBM Offshore
- Shell
- SHI-MCI
- TechnipFMC
- Woodside
- Yinson
The Global FPSO Market, valued at USD 4.3 billion in 2024, is projected to grow at a robust CAGR of 12.5% from 2025 to 2034. The key drivers of this growth include substantial investments in offshore exploration and the advancement of deepwater technologies. As onshore oil reserves decline and the costs associated with onshore infrastructure development rise, FPSOs are becoming increasingly favorable due to their ability to operate without the need for fixed structures. This flexibility in offshore operations is a significant factor in driving market expansion. Furthermore, FPSOs' capacity to accelerate oil and gas production in a cost-effective manner and their increasing use in the exploration of marginal reserves in remote offshore areas are strengthening their adoption across the industry.
The market is also witnessing a surge in the demand for converted FPSOs, expected to surpass USD 3 billion by 2034. Converted units offer notable advantages over new builds, including reduced capital expenses, faster deployment, and enhanced operational flexibility. This segment benefits from the availability of retired FPSOs and oil tankers that can be repurposed, requiring only a fraction of the investment compared to newly constructed vessels with comparable features. As a result, operators are increasingly opting for converted FPSOs to reduce upfront costs and improve project timelines.
| Market Scope | |
|---|---|
| Start Year | 2024 |
| Forecast Year | 2025-2034 |
| Start Value | $4.3 Billion |
| Forecast Value | $9.8 Billion |
| CAGR | 12.5% |
Additionally, the ultra-deepwater FPSO segment is anticipated to grow steadily, with a projected CAGR of over 7% through 2034. The shift toward ultra-deepwater exploration, combined with advances in seismic and drilling technologies, is boosting the adoption of FPSOs in deeper offshore basins. These regions, which often contain larger oil reserves, are becoming increasingly accessible thanks to improved exploration technologies, creating favorable conditions for FPSO deployment.
The FPSO market in Brazil is expected to exceed USD 2.5 billion by 2034. This growth is largely driven by the discovery of vast offshore oil reserves, supported by favorable government policies and significant investments in the oil and gas exploration sector. Additionally, the increasing focus on reducing emissions and diversifying energy sources is shaping the future of the FPSO market in the region as operators work to meet stringent environmental standards while maintaining efficient offshore operations.
Table of Contents
Chapter 1 Methodology & Scope
- 1.1 Market definitions
- 1.2 Base estimates & calculations
- 1.3 Forecast calculation
- 1.4 Data sources
- 1.4.1 Primary
- 1.4.2 Secondary
- 1.4.2.1 Paid
- 1.4.2.2 Public
Chapter 2 Executive Summary
- 2.1 Industry synopsis, 2021 - 2034
Chapter 3 Industry Insights
- 3.1 Industry ecosystem analysis
- 3.2 Regulatory landscape
- 3.3 Industry impact forces
- 3.3.1 Growth drivers
- 3.3.2 Industry pitfalls & challenges
- 3.4 Growth potential analysis
- 3.5 Porter's analysis
- 3.5.1 Bargaining power of suppliers
- 3.5.2 Bargaining power of buyers
- 3.5.3 Threat of new entrants
- 3.5.4 Threat of substitutes
- 3.6 PESTEL analysis
Chapter 4 Competitive Landscape, 2024
- 4.1 Introduction
- 4.2 Strategic dashboard
- 4.3 Innovation & sustainability landscape
Chapter 5 Market Size and Forecast, By Product, 2021 – 2034 (USD Million, Units, ‘000 BOPD)
- 5.1 Key trends
- 5.2 Converted
- 5.3 New built
Chapter 6 Market Size and Forecast, By Water Depth, 2021 – 2034 (USD Million, Units, ‘000 BOPD)
- 6.1 Key trends
- 6.2 Shallow
- 6.3 Deep
- 6.4 Ultra-deep
Chapter 7 Market Size and Forecast, By Country, 2021 – 2034 (USD Million, Units, ‘000 BOPD)
- 7.1 Key trends
- 7.2 U.S.
- 7.3 UK
- 7.4 Norway
- 7.5 China
- 7.6 India
- 7.7 Indonesia
- 7.8 Australia
- 7.9 Brazil
- 7.10 Guyana
- 7.11 Rest of the World
Chapter 8 Company Profiles
- 8.1 Bumi Armada
- 8.2 BW Offshore
- 8.3 CNOOC
- 8.4 DNV
- 8.5 Hanwha
- 8.6 Hyundai Heavy Industries
- 8.7 KBR
- 8.8 MODEC
- 8.9 Petrobras
- 8.10 Saipem
- 8.11 SBM Offshore
- 8.12 Shell
- 8.13 SHI-MCI
- 8.14 TechnipFMC
- 8.15 Woodside
- 8.16 Yinson
 浮式生產儲油卸油設備(FPSO) 市場規模、佔有率和成長分析(按類型、推進器、船舶類型、應用和地區)- 產業預測 2025-2032
 FPSO:市場佔有率分析、產業趨勢與統計、成長預測(2025-2030 年)
 浮式生產儲油卸油設備(FPSO) 全球市場規模、佔有率、趨勢分析報告:按類型、推進、應用、船舶類型、地區、展望和預測,2024-2031 年
 浮體式石油天然氣生產儲存出貨設(FPSO)市場:各產品類型,水深,船型,各地區,2024年~2031年
 浮體式海上石油生產、儲存和貨運設施(FPSO) 的全球市場
 全球FPSO(浮體式石油天然氣生產儲存出貨設)產業預測:2024年~2029年