

 |
市場調查報告書
商品編碼
1684850
離岸風力渦輪機市場機會、成長動力、產業趨勢分析及 2025 - 2034 年預測Offshore Wind Turbine Market Opportunity, Growth Drivers, Industry Trend Analysis, and Forecast 2025 - 2034 |
||||||
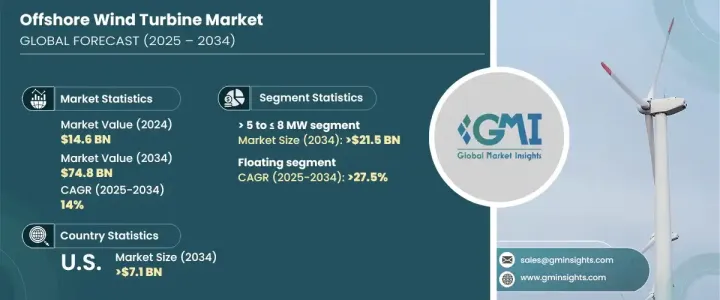
2024 年全球離岸風力渦輪機市場規模達到 146 億美元,預計 2025 年至 2034 年期間將以 14% 的強勁複合年成長率擴張。離岸風力渦輪機利用風能發電,通常安裝在海洋或大型湖泊等大型水域。這些渦輪機旨在承受惡劣的海洋環境,並根據水深安裝在浮動平台或固定基礎上。隨著政府和企業越來越重視永續能源解決方案,向再生能源的日益轉變是推動市場擴張的關鍵因素。
隨著支持性政策對離岸風電項目的推動,清潔能源需求的不斷成長以及來自私營和公共部門的投資正在加速離岸風電技術的應用。在能源價格波動和地緣政治不確定性的推動下,能源多樣化的趨勢正在推動各國尋求更可靠、更永續的發電選擇。技術創新正在提高渦輪機的效率、降低成本並改善整體性能。此外,電網整合和能源儲存解決方案的進步有助於最佳化風能分配,進一步增強市場潛力。
| 市場範圍 | |
|---|---|
| 起始年份 | 2024 |
| 預測年份 | 2025-2034 |
| 起始值 | 146億美元 |
| 預測值 | 748億美元 |
| 複合年成長率 | 14% |
就渦輪機的額定功率而言,市場分為不同的類別,渦輪機的功率範圍從<= 2 MW 到 > 12 MW。預計到 2034 年,> 5 至 <= 8 MW 部分將產生 215 億美元的收入。此類渦輪機可提供更高的功率輸出,使其更具成本效益並降低每兆瓦時的專案成本。這些渦輪機的需求源自於其卓越的效率和以較低的平準化能源成本運作的能力。因此,它們越來越受歡迎,特別是在海上風力條件不那麼極端的地區。製造商正在繼續致力於最佳化這些渦輪機的性能、耐用性和靈活性,使其在市場上更具競爭力。
預計浮動離岸風力渦輪機領域將實現最高成長率,到 2034 年複合年成長率將達到 27.5%。這些浮動風力渦輪機能夠在固定底部模型不適用的深水中運行,從而釋放出大量尚未開發的離岸風電潛力。浮動渦輪機設計的創新,包括半潛式、立柱浮標式和張力腿平台,正在提高成本效率和穩定性。在深水域部署這些渦輪機的能力擴大了離岸風電專案的機會範圍,特別是在淺水資源有限的地區。
美國離岸風力渦輪機市場也將大幅成長,預計到 2034 年市場價值將達到 71 億美元。政府激勵措施(包括投資和生產稅收抵免)正在推動這項擴張。隨著美國努力實現其雄心勃勃的再生能源目標,州一級的戰略舉措正在推動風能計畫的發展。浮動渦輪機技術的進步為深海離岸風電場鋪平了道路,進一步推動了市場成長,並鞏固了離岸風電作為美國再生能源格局基石的地位。
目錄
第 1 章:方法論與範圍
- 市場定義
- 基礎估算與計算
- 預測計算
- 初步研究與驗證
- 主要來源
- 資料探勘來源
- 市場定義
第 2 章:執行摘要
第 3 章:產業洞察
- 產業生態系統
- 監管格局
- 產業衝擊力
- 成長動力
- 產業陷阱與挑戰
- 成長潛力分析
- 波特的分析
- PESTEL 分析
第4章:競爭格局
- 介紹
- 戰略儀表板
- 創新與永續發展格局
第 5 章:市場規模及預測:依評級,2021 – 2034 年
- 主要趨勢
- ≤ 2 兆瓦
- > 2 至 ≤ 5 MW
- > 5 至 ≤ 8 MW
- > 8 至 ≤ 10 MW
- > 10 至 ≤ 12 MW
- > 12 兆瓦
第 6 章:市場規模及預測:依安裝量,2021 – 2034 年
- 主要趨勢
- 漂浮的
- 固定的
- 軸
- 水平軸風力渦輪機
- 逆風
- 順風
- 垂直軸風力渦輪機
- 水平軸風力渦輪機
- 成分
- 刀片
- 塔
- 其他
- 軸
第 7 章:市場規模及預測:按地區,2021 – 2034 年
- 主要趨勢
- 北美洲
- 美國
- 加拿大
- 歐洲
- 德國
- 西班牙
- 英國
- 法國
- 義大利
- 瑞典
- 波蘭
- 丹麥
- 葡萄牙
- 荷蘭
- 愛爾蘭
- 比利時
- 亞太地區
- 中國
- 印度
- 澳洲
- 日本
- 韓國
- 越南
- 菲律賓
- 台灣
- 世界其他地區
第8章:公司簡介
- Bergey Windpower
- CSSC
- Doosan Corporation
- ENERCON
- ENESSERE
- Envision Group
- EOLINK
- General Electric
- Goldwind
- Mingyang Smart Energy Group
- NORDEX
- Orsted
- Senvion
- Siemens Gamesa Renewable Energy
- Suzlon Energy Limited
- Vattenfall
- Vestas
- WEG
The Global Offshore Wind Turbine Market reached USD 14.6 billion in 2024 and is projected to expand at a robust CAGR of 14% from 2025 to 2034. Offshore wind turbines, which harness the power of wind to generate electricity, are typically installed in large bodies of water such as oceans or large lakes. These turbines are designed to withstand the harsh marine environment and are mounted on either floating platforms or fixed foundations, depending on the water depth. The growing transition to renewable energy is a key factor driving market expansion as governments and corporations increasingly prioritize sustainable energy solutions.
Along with supportive policies promoting offshore wind initiatives, the rising demand for clean energy sources and investments from both private and public sectors are accelerating the adoption of offshore wind technologies. The drive for energy diversification, spurred by fluctuations in energy prices and geopolitical uncertainties, is pushing nations to seek more reliable and sustainable power generation options. Technological innovations are enhancing the efficiency of turbines, reducing costs, and improving overall performance. Additionally, advancements in grid integration and energy storage solutions are helping optimize the distribution of wind energy, further strengthening the market's potential.
| Market Scope | |
|---|---|
| Start Year | 2024 |
| Forecast Year | 2025-2034 |
| Start Value | $14.6 Billion |
| Forecast Value | $74.8 Billion |
| CAGR | 14% |
When it comes to the turbines' rating, the market is segmented into various categories, with turbines ranging from <= 2 MW to > 12 MW. The > 5 to <= 8 MW segment is expected to generate USD 21.5 billion by 2034. This category of turbines delivers higher power outputs, making them more cost-effective and reducing project costs per megawatt-hour. The demand for these turbines is driven by their superior efficiency and their ability to operate at a lower levelized cost of energy. As a result, they are gaining popularity, particularly in areas where offshore wind conditions are less extreme. Manufacturers are continuing to focus on optimizing the performance, durability, and flexibility of these turbines, making them more competitive in the market.
The floating offshore turbines segment is anticipated to experience the highest growth rate, with a CAGR of 27.5% by 2034. These floating turbines are capable of operating in deep waters where fixed-bottom models are not feasible, unlocking a wealth of untapped offshore wind potential. Innovations in floating turbine designs, including semi-submersible, spar buoy, and tension-leg platforms, are improving both cost efficiency and stability. The ability to deploy these turbines in deeper waters expands the range of opportunities for offshore wind projects, especially in regions with limited shallow-water resources.
The US offshore wind turbine market is also set for substantial growth, with a projected market value of USD 7.1 billion by 2034. Government incentives, including investment and production tax credits, are fueling this expansion. Strategic initiatives at the state level are pushing forward wind energy projects as the US works toward its ambitious renewable energy targets. Advances in floating turbine technology are paving the way for offshore wind farms in deeper waters, further propelling market growth and solidifying offshore wind as a cornerstone of the US renewable energy landscape.
Table of Contents
Chapter 1 Methodology & Scope
- 1.1 Market definitions
- 1.2 Base estimates & calculations
- 1.3 Forecast calculation
- 1.4 Primary research & validation
- 1.4.1 Primary sources
- 1.4.2 Data mining sources
- 1.5 Market Definitions
Chapter 2 Executive Summary
- 2.1 Industry synopsis, 2021 – 2034
Chapter 3 Industry Insights
- 3.1 Industry ecosystem
- 3.2 Regulatory landscape
- 3.3 Industry impact forces
- 3.3.1 Growth drivers
- 3.3.2 Industry pitfalls & challenges
- 3.4 Growth potential analysis
- 3.5 Porter's analysis
- 3.5.1 Bargaining power of suppliers
- 3.5.2 Bargaining power of buyers
- 3.5.3 Threat of new entrants
- 3.5.4 Threat of substitutes
- 3.6 PESTEL analysis
Chapter 4 Competitive landscape, 2024
- 4.1 Introduction
- 4.2 Strategic dashboard
- 4.3 Innovation & sustainability landscape
Chapter 5 Market Size and Forecast, By Rating, 2021 – 2034 (USD Million & MW)
- 5.1 Key trends
- 5.2 ≤ 2 MW
- 5.3 > 2 to ≤ 5 MW
- 5.4 > 5 to ≤ 8 MW
- 5.5 > 8 to ≤ 10 MW
- 5.6 > 10 to ≤ 12 MW
- 5.7 > 12 MW
Chapter 6 Market Size and Forecast, By Installation, 2021 – 2034 (USD Million & MW)
- 6.1 Key trends
- 6.1.1 Floating
- 6.1.2 Fixed
- 6.1.2.1 Axis
- 6.1.2.1.1 HAWT
- 6.1.2.1.1.1 Up-Wind
- 6.1.2.1.1.2 Down-Wind
- 6.1.2.1.2 VAWT
- 6.1.2.1.1 HAWT
- 6.1.2.2 Component
- 6.1.2.2.1 Blades
- 6.1.2.2.2 Towers
- 6.1.2.2.3 Others
- 6.1.2.1 Axis
Chapter 7 Market Size and Forecast, By Region, 2021 – 2034 (USD Million & MW)
- 7.1 Key trends
- 7.2 North America
- 7.2.1 U.S.
- 7.2.2 Canada
- 7.3 Europe
- 7.3.1 Germany
- 7.3.2 Spain
- 7.3.3 UK
- 7.3.4 France
- 7.3.5 Italy
- 7.3.6 Sweden
- 7.3.7 Poland
- 7.3.8 Denmark
- 7.3.9 Portugal
- 7.3.10 Netherlands
- 7.3.11 Ireland
- 7.3.12 Belgium
- 7.4 Asia Pacific
- 7.4.1 China
- 7.4.2 India
- 7.4.3 Australia
- 7.4.4 Japan
- 7.4.5 South Korea
- 7.4.6 Vietnam
- 7.4.7 Philippines
- 7.4.8 Taiwan
- 7.5 Rest of World
Chapter 8 Company Profiles
- 8.1 Bergey Windpower
- 8.2 CSSC
- 8.3 Doosan Corporation
- 8.4 ENERCON
- 8.5 ENESSERE
- 8.6 Envision Group
- 8.7 EOLINK
- 8.8 General Electric
- 8.9 Goldwind
- 8.10 Mingyang Smart Energy Group
- 8.11 NORDEX
- 8.12 Orsted
- 8.13 Senvion
- 8.14 Siemens Gamesa Renewable Energy
- 8.15 Suzlon Energy Limited
- 8.16 Vattenfall
- 8.17 Vestas
- 8.18 WEG
 離岸風力發電機- 2025 年至 2030 年預測
 離岸風力發電機市場規模、佔有率、成長分析、按容量、按水深、按組件、按地點、按應用、按地區 - 2024-2031 年行業預測
 離岸風力發電機市場:按容量、按應用分類 - 2025-2030 年全球預測
 到 2030 年海上風力發電機市場預測:按類型、組件類型、安裝類型、技術、應用、最終用戶和地區進行的全球分析
 離岸風力發電機市場規模、佔有率、趨勢分析報告:按容量、按水深、按地區、細分市場預測,2024-2030年
 離岸風力發電機市場(基礎類型:單樁、導管架、三腳架、浮動式等;位置鄰近性:淺水、過渡水和深水)- 2024 年全球產業分析、規模、佔有率、成長、趨勢和預測-2034
 海上風力渦輪機市場規模:按額定值(=<2 MW,>2=<5 MW,>5=<8 MW,>8=<10 MW,>10=<12 MW,>12 MW),按安裝(浮體,固定)和預測,2023-2032