


 |
市場調查報告書
商品編碼
1698521
遊戲機市場機會、成長動力、產業趨勢分析及 2025-2034 年預測Game Consoles Market Opportunity, Growth Drivers, Industry Trend Analysis, and Forecast 2025-2034 |
||||||
全球遊戲機市場規模到 2024 年將達到 558 億美元,預計在 2025 年至 2034 年期間的複合年成長率為 5%,這得益於不斷變化的消費者偏好和技術進步。線上遊戲的日益普及和基於訂閱的遊戲服務的擴展是推動這一成長的關鍵因素。訂閱模式讓玩家只需支付固定的月費即可存取豐富的遊戲庫,從而使遊戲更加實惠,並可供更廣泛的受眾使用。隨著全球網路連結性的改善,雲端遊戲越來越受到關注,進一步加速了市場擴張。
智慧型手機和平板電腦的日益普及也影響著遊戲產業,越來越多的消費者尋求在多種裝置上獲得無縫的遊戲體驗。遊戲玩家越來越要求跨平台相容性,以便他們能夠在遊戲機、個人電腦和行動裝置之間輕鬆轉換。此外,人工智慧 (AI) 和擴增實境 (AR) 與遊戲的融合增強了遊戲體驗,提高了參與度並延長了遊戲時間。隨著電子競技、直播和互動遊戲社群的興起,遊戲生態系統正在不斷擴大,從而增加了遊戲機的需求。社交遊戲平台和多人遊戲體驗已成為市場不可或缺的一部分,促進了持續參與和遊戲內購買。
| 市場範圍 | |
|---|---|
| 起始年份 | 2024 |
| 預測年份 | 2025-2034 |
| 起始值 | 558億美元 |
| 預測值 | 902億美元 |
| 複合年成長率 | 5% |
按應用程式分類的市場凸顯了網路遊戲的主導地位。 2024 年,線上遊戲佔據 81.1% 的市場佔有率,預計在預測期內的複合年成長率為 5.2%。網路用戶的激增,加上高速網路的普及,正在加速這一領域的成長。玩家擴大選擇基於雲端的服務,這種服務無需高階硬體即可實現即時遊戲下載和串流媒體播放。遊戲產業正在經歷向數位內容的轉變,主要出版商專注於線上遊戲發行和即時服務模式。
根據類型,市場涵蓋家用遊戲機、手持遊戲機和混合遊戲機。由於便攜性和可訪問性,掌上游戲機在 2024 年經歷了顯著成長。消費者之所以對手持遊戲設備感興趣,是因為其靈活性,讓他們可以隨時隨地玩遊戲。跨平台遊戲功能進一步增加了對掌上游戲機的需求,使其成為休閒遊戲玩家和鐵桿遊戲玩家的首選。不斷擴大的獨家和第三方遊戲庫繼續吸引新用戶,鞏固了該領域在市場上的地位。
美國遊戲機市場價值 2024 年將達到 130 億美元,預計複合年成長率為 5.4%。相當一部分美國人積極參與遊戲,其中遊戲機是最受歡迎的平台。獨家遊戲發行、沉浸式數位內容以及遊戲技術進步等因素正在推動市場成長。增強的圖形、更快的處理器和尖端的遊戲開發正在創造更逼真、更引人入勝的體驗,進一步推動遊戲機的銷售。訂閱式服務、捆綁產品以及領先遊戲公司的促銷活動也在推動消費者的採用。隨著數位轉型持續影響遊戲產業,對創新和高效能遊戲機的需求依然強勁。
目錄
第1章:方法論與範圍
- 市場範圍和定義
- 基礎估算與計算
- 預測計算
- 資料來源
- 基本的
- 次要
- 付費來源
- 公共資源
第2章:執行摘要
第3章:行業洞察
- 產業生態系統分析
- 影響價值鏈的因素
- 利潤率分析
- 中斷
- 未來展望
- 製造商
- 經銷商
- 供應商格局
- 利潤率分析
- 技術概述
- 重要新聞和舉措
- 監管格局
- 衝擊力
- 成長動力
- 增強的圖形和處理能力
- 熱門系列推動遊戲機銷售
- 對多人遊戲體驗的需求不斷增加
- 沉浸式遊戲的普及率不斷上升
- 產業陷阱與挑戰
- 開發成本高
- 來自其他平台的競爭
- 成長動力
- 成長潛力分析
- 波特的分析
- PESTEL 分析
第4章:競爭格局
- 介紹
- 公司市佔率分析
- 競爭定位矩陣
- 戰略展望矩陣
第5章:市場估計與預測:依產品類型,2021-2034
- 主要趨勢
- 家用遊戲機
- 手持控制台
- 混合控制台
第6章:市場估計與預測:按應用,2021-2034
- 主要趨勢
- 線上遊戲
- 離線遊戲
第7章:市場估計與預測:依最終用途,2021-2034
- 主要趨勢
- 住宅
- 商業的
第8章:市場估計與預測:依代數,2021-2034
- 主要趨勢
- 目前的
- 以前的
- 遺產
第9章:市場估計與預測:按地區,2021-2034
- 主要趨勢
- 北美洲
- 美國
- 加拿大
- 歐洲
- 英國
- 德國
- 法國
- 義大利
- 西班牙
- 俄羅斯
- 亞太地區
- 中國
- 印度
- 日本
- 韓國
- 澳洲
- 拉丁美洲
- 巴西
- 墨西哥
- 中東及非洲
- 南非
- 沙烏地阿拉伯
- 阿拉伯聯合大公國
第10章:公司簡介
- ASUS
- Ayaneo
- Logitech
- Microsoft
- Nintendo
- Razer
- Sega
- SNK Corporation
- Sony
- Valve Corporation
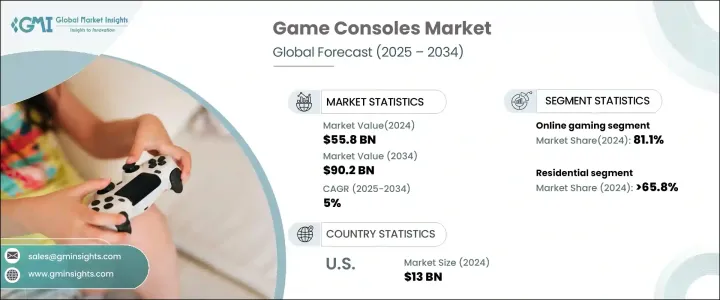
The Global Game Consoles Market, valued at USD 55.8 billion in 2024, is projected to expand at a CAGR of 5% from 2025 to 2034, driven by evolving consumer preferences and technological advancements. The increasing popularity of online gaming and the expansion of subscription-based gaming services are key factors fueling this growth. Subscription models offer players access to extensive game libraries for a fixed monthly fee, making gaming more affordable and accessible to a broader audience. As internet connectivity improves worldwide, cloud gaming is gaining traction, further accelerating market expansion.
The rising adoption of smartphones and tablets is also influencing the gaming industry, with more consumers seeking seamless gaming experiences across multiple devices. Gamers increasingly demand cross-platform compatibility, allowing them to transition effortlessly between consoles, PCs, and mobile devices. Additionally, the integration of artificial intelligence (AI) and augmented reality (AR) into gaming is enhancing gameplay experiences, driving higher engagement and longer playtimes. The gaming ecosystem is expanding with the rise of esports, live streaming, and interactive gaming communities, contributing to increased console demand. Social gaming platforms and multiplayer experiences have become integral to the market, fostering continuous engagement and in-game purchases.
| Market Scope | |
|---|---|
| Start Year | 2024 |
| Forecast Year | 2025-2034 |
| Start Value | $55.8 Billion |
| Forecast Value | $90.2 Billion |
| CAGR | 5% |
Market segmentation by application highlights the dominance of online gaming. In 2024, online gaming accounted for 81.1% of the market and is expected to grow at a CAGR of 5.2% over the forecast period. A surge in internet users, combined with the widespread availability of high-speed networks, is accelerating this segment's growth. Players are increasingly opting for cloud-based services, which enable instant game downloads and streaming without requiring high-end hardware. The gaming industry is witnessing a shift towards digital content, with major publishers focusing on online game distribution and live-service models.
By type, the market encompasses home, handheld, and hybrid consoles. Handheld consoles experienced significant growth in 2024, driven by their portability and accessibility. Consumers are drawn to handheld gaming devices due to their flexibility, allowing them to play games on the go. Cross-platform gaming capabilities have further increased the demand for handheld consoles, making them a preferred choice for both casual and hardcore gamers. An expanding library of exclusive and third-party titles continues to attract new users, strengthening this segment's position in the market.
The U.S. game consoles market, valued at USD 13 billion in 2024, is poised for a CAGR of 5.4%. A substantial portion of the American population actively engages in gaming, with consoles being a favored platform. Factors such as exclusive game releases, immersive digital content, and advancements in gaming technology are propelling market growth. Enhanced graphics, faster processors, and cutting-edge game development are creating more realistic and engaging experiences, further driving console sales. Subscription-based services, bundled offerings, and promotions from leading gaming companies are also boosting consumer adoption. As digital transformation continues to shape the gaming industry, the demand for innovative and high-performance gaming consoles remains strong.
Table of Contents
Chapter 1 Methodology & Scope
- 1.1 Market scope & definitions
- 1.2 Base estimates & calculations
- 1.3 Forecast calculations
- 1.4 Data sources
- 1.4.1 Primary
- 1.4.2 Secondary
- 1.4.2.1 Paid sources
- 1.4.2.2 Public sources
Chapter 2 Executive Summary
- 2.1 Industry 3600 synopsis, 2021-2034
Chapter 3 Industry Insights
- 3.1 Industry ecosystem analysis
- 3.1.1 Factor affecting the value chain
- 3.1.2 Profit margin analysis
- 3.1.3 Disruptions
- 3.1.4 Future outlook
- 3.1.5 Manufacturers
- 3.1.6 Distributors
- 3.2 Supplier landscape
- 3.3 Profit margin analysis
- 3.4 Technological overview
- 3.5 Key news & initiatives
- 3.6 Regulatory landscape
- 3.7 Impact forces
- 3.7.1 Growth drivers
- 3.7.1.1 Enhanced graphics and processing capabilities
- 3.7.1.2 Popular franchises driving console sales
- 3.7.1.3 Increasing demand for multiplayer experiences
- 3.7.1.4 Rising adoption of immersive gaming
- 3.7.2 Industry pitfalls & challenges
- 3.7.2.1 High development costs
- 3.7.2.2 Competition from other platforms
- 3.7.1 Growth drivers
- 3.8 Growth potential analysis
- 3.9 Porter's analysis
- 3.10 PESTEL analysis
Chapter 4 Competitive Landscape, 2024
- 4.1 Introduction
- 4.2 Company market share analysis
- 4.3 Competitive positioning matrix
- 4.4 Strategic outlook matrix
Chapter 5 Market Estimates & Forecast, By Product Type, 2021-2034 (USD Billion) (Thousand Units)
- 5.1 Key trends
- 5.2 Home console
- 5.3 Handheld console
- 5.4 Hybrid console
Chapter 6 Market Estimates & Forecast, By Application, 2021-2034 (USD Billion) (Thousand Units)
- 6.1 Key trends
- 6.2 Online gaming
- 6.3 Offline gaming
Chapter 7 Market Estimates & Forecast, By End Use, 2021-2034 (USD Billion) (Thousand Units)
- 7.1 Key trends
- 7.2 Residential
- 7.3 Commercial
Chapter 8 Market Estimates & Forecast, By Generation, 2021-2034 (USD Billion) (Thousand Units)
- 8.1 Key trends
- 8.2 Current
- 8.3 Previous
- 8.4 Legacy
Chapter 9 Market Estimates & Forecast, By Region, 2021-2034 (USD Billion) (Thousand Units)
- 9.1 Key trends
- 9.2 North America
- 9.2.1 U.S.
- 9.2.2 Canada
- 9.3 Europe
- 9.3.1 UK
- 9.3.2 Germany
- 9.3.3 France
- 9.3.4 Italy
- 9.3.5 Spain
- 9.3.6 Russia
- 9.4 Asia Pacific
- 9.4.1 China
- 9.4.2 India
- 9.4.3 Japan
- 9.4.4 South Korea
- 9.4.5 Australia
- 9.5 Latin America
- 9.5.1 Brazil
- 9.5.2 Mexico
- 9.6 MEA
- 9.6.1 South Africa
- 9.6.2 Saudi Arabia
- 9.6.3 UAE
Chapter 10 Company Profiles
- 10.1 ASUS
- 10.2 Ayaneo
- 10.3 Logitech
- 10.4 Microsoft
- 10.5 Nintendo
- 10.6 Razer
- 10.7 Sega
- 10.8 SNK Corporation
- 10.9 Sony
- 10.10 Valve Corporation

