

 |
市場調查報告書
商品編碼
1698530
自願性碳權市場機會、成長動力、產業趨勢分析及2025-2034年預測Voluntary Carbon Credit Market Opportunity, Growth Drivers, Industry Trend Analysis, and Forecast 2025-2034 |
||||||
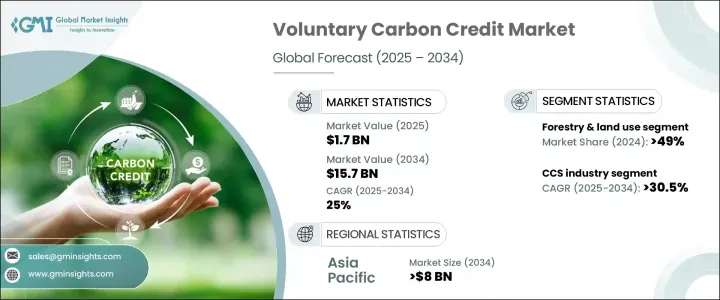
2024 年全球自願性碳權市場價值為 17 億美元,預計 2025 年至 2034 年期間的複合年成長率將達到 25%。企業對實現淨零排放和提高永續性評級的承諾日益增多,推動了不同產業多樣化信用體系的發展。企業正在積極購買碳權額來抵消業務營運產生的排放,從而促進市場成長。自願性碳權納入合規框架增強了市場流動性、可信度和需求,吸引了有助於價格穩定和企業參與的機構投資者。這種整合有利於增加對高品質專案的投資,推動全球減少碳足跡的努力,並加速該產業的擴張。
目前,有相當多的企業將碳權納入其ESG策略,以增強投資者信心並提高企業聲譽。雖然自願性碳權市場規模從 2022 年的 19 億美元下降到 2024 年的 17 億美元,但產業預測表明,在技術進步和碳補償計算方法改進的推動下,市場將出現強勁反彈。預計提高可訪問性和可追溯性的創新將在預測期內支持持續成長。
| 市場範圍 | |
|---|---|
| 起始年份 | 2024 |
| 預測年份 | 2025-2034 |
| 起始值 | 17億美元 |
| 預測值 | 157億美元 |
| 複合年成長率 | 25% |
全球範圍內有多個框架鼓勵企業自願抵消排放並與永續發展目標保持一致。這些指導方針強調責任和透明度,促使更多組織參與碳權市場。此外,政府法規以外的各種方式也推動自願參與減排計劃,擴大市場範圍。
根據最終用途,市場分為多個部分,包括林業和土地利用、農業、再生能源、碳捕獲和儲存、家庭和社區、化學過程、工業和商業、運輸和廢物管理。 2024年,林業和土地利用將佔據49%以上的市場佔有率,預計將持續成長。全球範圍內不斷擴大的造林和再造林計畫增加了對碳補償的需求,而環境政策進一步強化了這些措施。
預計到 2034 年,自願性碳權市場中的碳捕獲和儲存部門的複合年成長率將超過 30.5%。碳減排投資的增加和儲存技術的進步是推動這項擴張的關鍵因素。受再生能源在國家能源結構中所佔比重不斷增加的推動,到 2034 年,再生能源產業的規模預計也將超過 30 億美元。隨著全球能源結構向永續替代能源轉變,預計碳權的需求將大幅上升。
在美國,自願性碳權市場從 2022 年的 2 億美元成長到 2024 年的 4 億美元。不斷增加的淨零承諾和消費者對永續產品的偏好正在推動企業採用碳權計劃。在區塊鏈技術的支持下,碳權交易的透明度提高,增強了市場信任。此外,對直接空氣捕獲和碳去除計劃的投資正在促進創新,進一步支持自願性碳權產業的發展。
目錄
第1章:方法論與範圍
- 市場範圍和定義
- 市場估計和預測參數
- 預測計算
- 資料來源
- 基本的
- 次要
- 有薪資的
- 民眾
第2章:執行摘要
第3章:行業洞察
- 產業生態系統分析
- 監管格局
- 產業衝擊力
- 成長動力
- 產業陷阱與挑戰
- 成長潛力分析
- 波特的分析
- PESTEL 分析
第4章:競爭格局
- 介紹
- 戰略展望
- 創新與永續發展格局
第5章:市場規模及預測:依最終用途,2021 年至 2034 年
- 主要趨勢
- 農業
- 碳捕獲和儲存
- 化學過程
- 家庭和社區
- 工業和商業
- 林業和土地利用
- 再生能源
- 廢棄物管理
- 其他
第6章:市場規模及預測:依地區,2021 年至 2034 年
- 主要趨勢
- 北美洲
- 美國
- 加拿大
- 墨西哥
- 歐洲
- 保加利亞
- 羅馬尼亞
- 荷蘭
- 瑞士
- 亞太地區
- 中國
- 印度
- 印尼
- 泰國
- 中東和非洲
- 土耳其
- 肯亞
- 奈及利亞
- 南非
- 拉丁美洲
- 巴西
- 智利
- 秘魯
第7章:公司簡介
- 3Degrees
- ALLCOT
- Atmosfair
- CarbonClear
- ClimeCo
- Climate Impact Partners
- EcoAct
- Ecosecurities
- Microsoft
- PwC
- Shell
- South Pole
- TerraPass
- The Carbon Collective Company
- The Carbon Trust
- VERRA
The Global Voluntary Carbon Credit Market, valued at USD 1.7 billion in 2024, is projected to expand at a CAGR of 25% from 2025 to 2034. Growing corporate commitments to achieving net-zero emissions and improving sustainability ratings have driven the development of diverse credit systems across different sectors. Companies are actively purchasing carbon credits to offset emissions from business operations, reinforcing market growth. The integration of voluntary carbon credits into compliance frameworks has enhanced market liquidity, credibility, and demand, attracting institutional investors who contribute to price stability and corporate participation. This integration is facilitating increased investment in high-quality projects, boosting global efforts to reduce carbon footprints, and accelerating the industry's expansion.
A significant number of enterprises now incorporate carbon credits into their ESG strategies to strengthen investor confidence and enhance business reputations. While the voluntary carbon credit market saw a decline from USD 1.9 billion in 2022 to USD 1.7 billion in 2024, industry projections indicate a strong rebound driven by technological advancements and improved methods for calculating carbon offsets. Innovations that improve accessibility and traceability are expected to support sustained growth over the forecast period.
| Market Scope | |
|---|---|
| Start Year | 2024 |
| Forecast Year | 2025-2034 |
| Start Value | $1.7 Billion |
| Forecast Value | $15.7 Billion |
| CAGR | 25% |
Several frameworks worldwide encourage businesses to voluntarily offset emissions and align with sustainability objectives. These guidelines emphasize accountability and transparency, prompting more organizations to engage in carbon credit markets. Additionally, various approaches outside government regulations are promoting voluntary participation in emissions reduction programs, expanding the market's scope.
The market is categorized into multiple segments based on end use, including forestry and land use, agriculture, renewable energy, carbon capture and storage, household and community, chemical processes, industrial and commercial, transportation, and waste management. In 2024, forestry and land use accounted for more than 49% of the market share, with expectations of continued growth. Expanding afforestation and reforestation projects worldwide have increased the demand for carbon offsets, with environmental policies further reinforcing these initiatives.
The carbon capture and storage sector within the voluntary carbon credit market is anticipated to grow at a CAGR exceeding 30.5% through 2034. Rising investments in carbon mitigation and advancements in storage technologies are key factors fueling this expansion. The renewable energy sector is also expected to surpass USD 3 billion by 2034, driven by the growing share of renewable sources in national energy portfolios. As the global energy mix shifts toward sustainable alternatives, the demand for carbon credits is expected to rise significantly.
In the United States, the voluntary carbon credit market grew from USD 200 million in 2022 to USD 400 million in 2024. Increasing net-zero commitments and consumer preference for sustainable products are driving corporate adoption of carbon credit programs. Enhanced transparency in carbon credit trading, supported by blockchain technology, has strengthened trust in the market. Additionally, investments in direct air capture and carbon removal initiatives are fostering innovation, further supporting the voluntary carbon credit industry's growth.
Table of Contents
Chapter 1 Methodology & Scope
- 1.1 Market scope & definitions
- 1.2 Market estimates & forecast parameters
- 1.3 Forecast calculation
- 1.4 Data sources
- 1.4.1 Primary
- 1.4.2 Secondary
- 1.4.2.1 Paid
- 1.4.2.2 Public
Chapter 2 Executive Summary
- 2.1 Industry synopsis, 2021 - 2034
Chapter 3 Industry Insights
- 3.1 Industry ecosystem analysis
- 3.2 Regulatory landscape
- 3.3 Industry impact forces
- 3.3.1 Growth drivers
- 3.3.2 Industry pitfalls & challenges
- 3.4 Growth potential analysis
- 3.5 Porter's analysis
- 3.5.1 Bargaining power of suppliers
- 3.5.2 Bargaining power of buyers
- 3.5.3 Threat of new entrants
- 3.5.4 Threat of substitutes
- 3.6 PESTEL analysis
Chapter 4 Competitive Landscape, 2024
- 4.1 Introduction
- 4.2 Strategic outlook
- 4.3 Innovation & sustainability landscape
Chapter 5 Market Size and Forecast, By End Use, 2021 – 2034 (Million Credits, USD Billion)
- 5.1 Key trends
- 5.2 Agriculture
- 5.3 Carbon capture & storage
- 5.4 Chemical process
- 5.5 Household & community
- 5.6 Industrial & commercial
- 5.7 Forestry & land use
- 5.8 Renewable energy
- 5.9 Waste management
- 5.10 Others
Chapter 6 Market Size and Forecast, By Region, 2021 – 2034 (Million Credits, USD Billion)
- 6.1 Key trends
- 6.2 North America
- 6.2.1 U.S.
- 6.2.2 Canada
- 6.2.3 Mexico
- 6.3 Europe
- 6.3.1 Bulgaria
- 6.3.2 Romania
- 6.3.3 Netherlands
- 6.3.4 Switzerland
- 6.4 Asia Pacific
- 6.4.1 China
- 6.4.2 India
- 6.4.3 Indonesia
- 6.4.4 Thailand
- 6.5 Middle East & Africa
- 6.5.1 Turkey
- 6.5.2 Kenya
- 6.5.3 Nigeria
- 6.5.4 South Africa
- 6.6 Latin America
- 6.6.1 Brazil
- 6.6.2 Chile
- 6.6.3 Peru
Chapter 7 Company Profiles
- 7.1 3Degrees
- 7.2 ALLCOT
- 7.3 Atmosfair
- 7.4 CarbonClear
- 7.5 ClimeCo
- 7.6 Climate Impact Partners
- 7.7 EcoAct
- 7.8 Ecosecurities
- 7.9 Microsoft
- 7.10 PwC
- 7.11 Shell
- 7.12 South Pole
- 7.13 TerraPass
- 7.14 The Carbon Collective Company
- 7.15 The Carbon Trust
- 7.16 VERRA
 全球低碳農業市場 - 2025-2032
 碳農業市場:按農業實踐、實踐類型和最終用戶 - 2025-2030 年全球預測
 碳農業市場 - 全球產業規模、佔有率、趨勢、機會和預測,按專案類型、實踐、最終用戶、地區和競爭細分,2020-2030 年
 全球碳農業市場 - 2025 至 2032 年
 碳農業市場 - 全球和區域分析:按應用、產品和國家 - 分析和預測(2024-2034 年)
 碳權檢驗、確認和認證市場預測至 2030 年:按類型、服務、計劃類型、檢驗類型、最終用戶和地區進行的全球分析
 排碳權/碳補償市場:2025 年至 2032 年全球產業分析、規模、佔有率、成長、趨勢與預測
 碳信用/碳補償市場 - 全球產業分析、規模、佔有率、成長、趨勢及 2032 年預測
 農業碳封存市場 - 全球產業規模、佔有率、趨勢、機會和預測,按原料、應用、地區和競爭細分,2020-2030F
 全球農業碳匯市場:應用、產品、區域、政策、現有和即將推出的碳匯方法、未來路徑分析和預測(2024-2034)