


 |
市場調查報告書
商品編碼
1698550
資料中心電力市場機會、成長動力、產業趨勢分析及 2025-2034 年預測Data Center Power Market Opportunity, Growth Drivers, Industry Trend Analysis, and Forecast 2025-2034 |
||||||
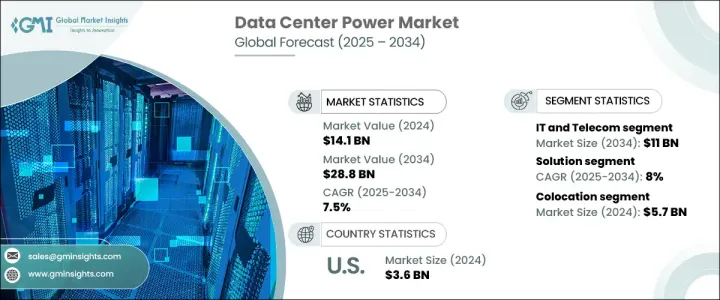
全球資料中心電力市場價值 2024 年將達到 141 億美元,預計 2025 年至 2034 年的複合年成長率為 7.5%。模組化資料中心的日益普及是推動這一成長的主要因素,因為這些設施提供了更高的效率、可擴展性和靈活性。它們正在成為滿足日益成長的資料處理和儲存需求的首選解決方案。模組化電力系統將發電機、配電裝置和不間斷電源整合在預製設計中,從而降低成本和能源消耗,從而降低營運費用並減少碳足跡。隨著數位基礎設施的擴展,對強大且節能的電源解決方案的需求持續成長。
領先的科技公司和網路公司已經採用模組化資料中心技術來最佳化成本、降低能耗並加速部署。與傳統資料中心相比,模組化設施降低了土木工程成本,並將設計、管理和統包承包費用減少了約 30%。在邊緣人工智慧、5G 網路和雲端運算的推動下,低延遲資料處理的推動進一步刺激了資料中心對高效能電源解決方案的需求。
| 市場範圍 | |
|---|---|
| 起始年份 | 2024 |
| 預測年份 | 2025-2034 |
| 起始值 | 141億美元 |
| 預測值 | 288億美元 |
| 複合年成長率 | 7.5% |
市場按應用細分為 BFSI、主機託管、能源、政府、醫療保健、製造、IT 和電信等。 2024 年,IT 和電信佔據了 24% 的市場佔有率,預計到 2034 年主機託管部分的收入將超過 110 億美元。 IT 和電信供應商都優先考慮節能資料中心,並專注於提高效能、降低成本和最大限度減少環境影響的冷卻技術。隨著高效能運算需求的成長,節能冷卻和電力系統對於管理高耗電工作負載變得至關重要。
資料中心電力市場也按組件分為解決方案和服務。 2024 年,解決方案部門佔據 63% 的市場佔有率,而服務業預計到 2034 年將以約 8% 的複合年成長率擴張。由於成本效率和環境問題,向風能和太陽能等再生能源的轉變正在獲得動力。這種轉變正在改變配電單元(PDU)和不間斷電源(UPS),它們現在結合了先進的監控和管理功能,以最佳化資料中心的電力可靠性和效率。
根據資料中心類型,市場分為超大規模、主機託管、邊緣和企業設施。受能源成本上漲和節能營運需求的推動,主機託管產業將在 2024 年以 57 億美元的規模引領市場。主機託管服務供應商正在積極投資再生能源解決方案,並採用液體和人工智慧驅動冷卻等先進的冷卻方法來提高效率並降低營運費用。這些創新有助於降低對傳統空調的依賴,同時改善高密度 IT 基礎架構的冷卻管理。
在北美,美國在 2024 年佔據資料中心電力領域的主導地位,創造了 36 億美元的收入。該地區的成長受到科技巨頭投資高效電力基礎設施以支持不斷擴大的資料中心營運的推動。各種規模的企業擴大採用雲端運算服務,進一步刺激了對先進電源解決方案的需求。隨著數位基礎設施的不斷進步,高效、永續的電力系統仍將是全球資料中心營運商的首要任務。
目錄
第1章:方法論與範圍
- 研究設計
- 研究方法
- 資料收集方法
- 基礎估算與計算
- 基準年計算
- 市場評估的主要趨勢
- 預測模型
- 初步研究和驗證
- 主要來源
- 資料探勘來源
- 市場範圍和定義
第2章:執行摘要
第3章:行業洞察
- 產業生態系統分析
- 電源分配器
- 技術提供者
- 資料中心營運商
- 最終用途
- 供應商格局
- 利潤率分析
- 技術與創新格局
- 專利分析
- 重要新聞和舉措
- 建置與維護資料中心的成本明細
- 資料中心年度電源使用效率(PUE)
- 監管格局
- 衝擊力
- 成長動力
- 全球資料中心功耗不斷上升
- 全球資料中心庫存不斷成長
- 模組化資料中心需求不斷成長
- 區塊鏈和機器學習(ML)等數位技術的出現
- 轉向智慧電源管理解決方案
- 產業陷阱與挑戰
- 與資料中心功耗相關的環境永續性挑戰
- 與資料中心電源相關的高管理成本
- 成長動力
- 成長潛力分析
- 波特的分析
- PESTEL分析
第4章:競爭格局
- 介紹
- 公司市佔率分析
- 競爭定位矩陣
- 戰略展望矩陣
第5章:市場估計與預測:按組件,2021 - 2034 年
- 主要趨勢
- 解決方案
- 電源分配單元 (PDU)
- UPS
- 產生器
- 柴油發電機
- 瓦斯發電機
- 佈線基礎設施
- 其他
- 服務
- 託管
- 專業的
第6章:市場估計與預測:按應用,2021 - 2034 年
- 主要趨勢
- 金融服務業
- 主機託管
- 能源
- 政府
- 衛生保健
- 製造業
- IT和電信
- 其他
第7章:市場估計與預測:按資料中心,2021 - 2034 年
- 主要趨勢
- 超大規模
- 主機託管
- 邊緣
- 企業
第8章:市場估計與預測:按地區,2021 - 2034 年
- 北美洲
- 美國
- 加拿大
- 墨西哥
- 歐洲
- 英國
- 德國
- 法國
- 西班牙
- 波蘭
- 比荷盧經濟聯盟
- 亞太地區
- 中國
- 印度
- 日本
- 新加坡
- 澳洲
- 南美洲
- 巴西
- 智利
- 秘魯
- 阿根廷
- MEA
- 阿拉伯聯合大公國
- 沙烏地阿拉伯
- 南非
第9章:公司簡介
- ABB
- Active POWER
- Belkin International
- Black Box
- Caterpillar
- Cummins
- Cyber Power Systems
- Delta Electronics
- Eaton
- Hewlett Packard Enterprise
- Huawei Technologies
- Legrand
- Mitsubishi Electric Corporation
- NVIDIA
- Rittal
- Schneider Electric
- Siemens
- Toshiba
- Tripp Lite
- Vertiv
The Global Data Center Power Market, valued at USD 14.1 billion in 2024, is projected to grow at a CAGR of 7.5% from 2025 to 2034. The increasing adoption of modular data centers is a major factor driving this growth, as these facilities offer enhanced efficiency, scalability, and flexibility. They are becoming a preferred solution to meet the rising demand for data processing and storage. Modular power systems integrate generators, power distribution units, and uninterruptible power supplies in prefabricated designs that reduce costs and energy consumption, leading to lower operational expenses and a smaller carbon footprint. As digital infrastructure expands, the need for robust and energy-efficient power solutions continues to grow.
Leading technology firms and internet companies have already embraced modular data center technologies to optimize costs, reduce energy consumption, and accelerate deployment. Compared to traditional data centers, modular facilities lower civil engineering costs and cut design, management, and turnkey contracting expenses by approximately 30%. The push toward low-latency data processing, driven by advancements in edge AI, 5G networks, and cloud computing, is further fueling demand for high-performance power solutions in data centers.
| Market Scope | |
|---|---|
| Start Year | 2024 |
| Forecast Year | 2025-2034 |
| Start Value | $14.1 Billion |
| Forecast Value | $28.8 Billion |
| CAGR | 7.5% |
The market is segmented by application into BFSI, colocation, energy, government, healthcare, manufacturing, IT & telecom, and others. In 2024, IT & telecom accounted for 24% of the market, with the colocation segment expected to surpass USD 11 billion in revenue by 2034. Both IT and telecommunications providers are prioritizing power-efficient data centers, focusing on cooling technologies that enhance performance, reduce costs, and minimize environmental impact. As high-performance computing requirements grow, energy-efficient cooling and power systems are becoming critical for managing power-intensive workloads.
The power market for data centers is also classified by component into solutions and services. In 2024, the solutions segment held a 63% market share, while the services sector is anticipated to expand at a CAGR of approximately 8% through 2034. The transition toward renewable energy sources, including wind and solar, is gaining momentum due to cost efficiency and environmental concerns. This shift is transforming power distribution units (PDUs) and uninterruptible power supplies (UPS), which are now incorporating advanced monitoring and management features to optimize power reliability and efficiency in data centers.
By data center type, the market is categorized into hyperscale, colocation, edge, and enterprise facilities. The colocation sector led the market with USD 5.7 billion in 2024, driven by increasing energy costs and the need for energy-efficient operations. Colocation providers are actively investing in renewable energy solutions and adopting advanced cooling methods such as liquid and AI-driven cooling to enhance efficiency and reduce operating expenses. These innovations help lower reliance on conventional air conditioning while improving the cooling management of high-density IT infrastructure.
In North America, the United States dominated the data center power sector in 2024, generating USD 3.6 billion in revenue. Growth in this region is propelled by technology giants investing in efficient power infrastructure to support expanding data center operations. The rising adoption of cloud computing services by enterprises of all sizes further fuels the demand for advanced power solutions. With continuous advancements in digital infrastructure, efficient and sustainable power systems will remain a priority for data center operators worldwide.
Table of Contents
Chapter 1 Methodology & Scope
- 1.1 Research design
- 1.1.1 Research approach
- 1.1.2 Data collection methods
- 1.2 Base estimates & calculations
- 1.2.1 Base year calculation
- 1.2.2 Key trends for market estimation
- 1.3 Forecast model
- 1.4 Primary research and validation
- 1.4.1 Primary sources
- 1.4.2 Data mining sources
- 1.5 Market scope & definition
Chapter 2 Executive Summary
- 2.1 Industry synopsis, 2021 - 2034
Chapter 3 Industry Insights
- 3.1 Industry ecosystem analysis
- 3.1.1 Power distributor
- 3.1.2 Technology provider
- 3.1.3 Data center operator
- 3.1.4 End use
- 3.2 Supplier landscape
- 3.3 Profit margin analysis
- 3.4 Technology & innovation landscape
- 3.5 Patent analysis
- 3.6 Key news & initiatives
- 3.7 Cost breakdown to build and maintain a data center
- 3.8 Annual power usage effectiveness (PUE) of data centers
- 3.9 Regulatory landscape
- 3.10 Impact forces
- 3.10.1 Growth drivers
- 3.10.1.1 Rising data center power consumption across the globe
- 3.10.1.2 Growing global data center inventory
- 3.10.1.3 Rising demand for modular data centers
- 3.10.1.4 Emergence of digital technologies including blockchain and Machine Learning (ML)
- 3.10.1.5 Shift toward intelligent power managing solutions
- 3.10.2 Industry pitfalls & challenges
- 3.10.2.1 Environmental sustainability challenges associated with data center power consumption
- 3.10.2.2 High management costs related to data center power
- 3.10.1 Growth drivers
- 3.11 Growth potential analysis
- 3.12 Porter's analysis
- 3.13 PESTEL analysis
Chapter 4 Competitive Landscape, 2024
- 4.1 Introduction
- 4.2 Company market share analysis
- 4.3 Competitive positioning matrix
- 4.4 Strategic outlook matrix
Chapter 5 Market Estimates & Forecast, By Component, 2021 - 2034 ($Bn)
- 5.1 Key trends
- 5.2 Solution
- 5.2.1 Power distribution units (PDUs)
- 5.2.2 UPS
- 5.2.3 Generators
- 5.2.3.1 Diesel generator
- 5.2.3.2 Gas generator
- 5.2.4 Cabling infrastructure
- 5.2.5 Others
- 5.3 Services
- 5.3.1 Managed
- 5.3.2 Professional
Chapter 6 Market Estimates & Forecast, By Application, 2021 - 2034 ($Bn)
- 6.1 Key trends
- 6.2 BFSI
- 6.3 Colocation
- 6.4 Energy
- 6.5 Government
- 6.6 Healthcare
- 6.7 Manufacturing
- 6.8 IT & telecom
- 6.9 Others
Chapter 7 Market Estimates & Forecast, By Data Center, 2021 - 2034 ($Bn)
- 7.1 Key trends
- 7.2 Hyperscale
- 7.3 Colocation
- 7.4 Edge
- 7.5 Enterprise
Chapter 8 Market Estimates & Forecast, By Region, 2021 - 2034 ($Bn)
- 8.1 North America
- 8.1.1 U.S.
- 8.1.2 Canada
- 8.1.3 Mexico
- 8.2 Europe
- 8.2.1 UK
- 8.2.2 Germany
- 8.2.3 France
- 8.2.4 Spain
- 8.2.5 Poland
- 8.2.6 Benelux
- 8.3 Asia Pacific
- 8.3.1 China
- 8.3.2 India
- 8.3.3 Japan
- 8.3.4 Singapore
- 8.3.5 Australia
- 8.4 South America
- 8.4.1 Brazil
- 8.4.2 Chile
- 8.4.3 Peru
- 8.4.4 Argentina
- 8.5 MEA
- 8.5.1 UAE
- 8.5.2 Saudi Arabia
- 8.5.3 South Africa
Chapter 9 Company Profiles
- 9.1 ABB
- 9.2 Active POWER
- 9.3 Belkin International
- 9.4 Black Box
- 9.5 Caterpillar
- 9.6 Cummins
- 9.7 Cyber Power Systems
- 9.8 Delta Electronics
- 9.9 Eaton
- 9.10 Hewlett Packard Enterprise
- 9.11 Huawei Technologies
- 9.12 Legrand
- 9.13 Mitsubishi Electric Corporation
- 9.14 NVIDIA
- 9.15 Rittal
- 9.16 Schneider Electric
- 9.17 Siemens
- 9.18 Toshiba
- 9.19 Tripp Lite
- 9.20 Vertiv
 北美資料中心電源:市場佔有率分析、產業趨勢與成長預測(2025-2031)資料中心電源:市場佔有率分析、產業趨勢與統計、成長預測(2025-2030 年)
 2025 年資料中心電源管理全球市場報告2025 年全球資料中心電力市場報告
 2025 年至 2029 年全球資料中心電力市場歐洲資料中心電源:市場佔有率分析、產業趨勢與統計、成長預測(2025-2030 年)
 資料中心電力市場規模、佔有率、成長分析,按組件、最終用戶類型、產業、資料中心類型、地區 - 產業預測,2024-2031年
 2025-2033 年日本資料中心電力市場報告(按解決方案類型、服務類型、規模、垂直產業和地區)
 資料中心電力市場,規模,佔有率,趨勢,產業分析報告:各零件,各資料中心規模,各終端用戶,各業界,各地區 - 市場預測 2025年~2034年資料中心電力市場:按產品、解決方案、服務和應用分類 - 2025-2030 年全球預測