


 |
市場調查報告書
商品編碼
1698553
智慧交通系統 (ITS) 市場機會、成長動力、產業趨勢分析及 2025-2034 年預測Intelligent Transportation System (ITS) Market Opportunity, Growth Drivers, Industry Trend Analysis, and Forecast 2025-2034 |
||||||
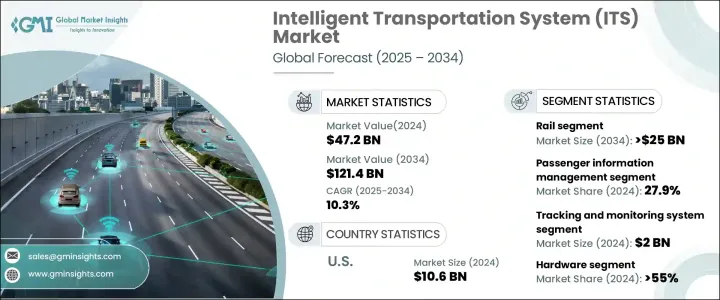
2024 年全球智慧交通系統市場估值達 472 億美元,預計 2025 年至 2034 年的複合年成長率將達到 10.3%。隨著城市化繼續以前所未有的速度發展,對智慧城市發展的日益關注是一個重要的驅動力。世界各地的城市對永續、高效、安全的出行解決方案的需求日益成長。隨著全球人口向城市地區轉移,交通基礎設施的數位化進步對於最佳化交通流量、減少交通堵塞和提高公共交通效率至關重要。
ITS 解決方案整合了先進的交通管理、即時資料分析、互聯互通和公共交通營運,以簡化城市交通。隨著環境問題日益嚴重,新技術正在運用以支援電動車、共享交通和降低排放。城市擴張預計將導致道路上增加數百萬輛新車,對現有的交通系統提出挑戰,並需要創新的解決方案來保持永續性。智慧物聯網、人工智慧和分析技術的採用將多種交通方式整合到無縫的多模式網路中,重新定義城市交通。即時資訊系統使旅行者能夠獲取時刻表、交通更新和替代路線,從而提高效率和便利性。隨著城市實施促進數位移動生態系統的政策,對 ITS 的投資持續成長,推動了對更安全、更永續的城市交通解決方案的需求。
| 市場範圍 | |
|---|---|
| 起始年份 | 2024 |
| 預測年份 | 2025-2034 |
| 起始值 | 472億美元 |
| 預測值 | 1214億美元 |
| 複合年成長率 | 10.3% |
市場依運輸方式細分,包括鐵路、公路、航空和海運。 2024 年,鐵路產業佔據超過 40% 的市場佔有率,而預計到 2034 年公路產業的市場規模將超過 250 億美元。各國政府正在發布高額的道路升級招標,優先考慮基礎設施升級,以適應日益成長的交通量。這些項目專注於改善交叉路口、修復道路和部署即時監控系統以加強交通管理並緩解交通堵塞。
在鐵路領域,應用包括智慧票務、乘客資訊管理、營運、安全、緊急通知和防撞。 2024 年,乘客資訊管理佔據 27.9% 的市場佔有率,而智慧票務預計到 2034 年將以 13% 的複合年成長率成長。交通運輸領域加強數位轉型的努力正在利用即時通訊技術、車內運算系統、GPS 追蹤和基於雲端的資訊平台來改善乘客體驗和營運效率。
航空運輸部門包括資訊顯示系統、追蹤和監控系統、自助行李解決方案、自助服務終端、通訊網路和智慧門。追蹤和監控解決方案在 2024 年引領市場,估值達 20 億美元。 GPS 和物聯網的整合徹底改變了航空業,實現了對飛機、乘客和行李的即時追蹤。增強的態勢感知可提高安全性、營運效率和資產管理,確保航空公司和機場的無縫營運。
公路運輸市場分為硬體、軟體和服務。 2024年,硬體領域佔據主導地位,市場佔有率超過55%。 GPS 裝置、感測器、高畫質攝影機和加固型物聯網設備的採用提高了連接性和運作可靠性。邊緣運算實現了車輛內部的資料處理,提高了效率和乘客安全。
在北美,美國以 2024 年 106 億美元的營收領先 ITS 市場。公共運輸系統擴大採用共享出行服務,將共享單車、電動滑板車和共乘整合到多模式網路中。非接觸式票務系統已廣泛實施,可透過智慧型手機、智慧卡和數位錢包實現無縫票價支付。這些進步透過減少交通堵塞、提高運輸效率和提供更互聯的交通體驗,增強了城市交通。
目錄
第1章:方法論與範圍
- 研究設計
- 研究方法
- 資料收集方法
- 基礎估算與計算
- 基準年計算
- 市場評估的主要趨勢
- 預測模型
- 初步研究和驗證
- 主要來源
- 資料探勘來源
- 市場範圍和定義
第2章:執行摘要
第3章:行業洞察
- 產業生態系統分析
- 原物料供應商
- 零件供應商
- 製造商
- 技術/軟體供應商
- 系統整合商
- 服務提供者
- 政府機構
- 金融當局
- 供應商格局
- 利潤率分析
- 技術與創新格局
- 專利分析
- 重要新聞和舉措
- 監管格局
- 衝擊力
- 成長動力
- 政府資助和 PPP 模式
- 歐洲和北美通勤者對預付費票務服務的需求
- 北美和亞太地區政府推出更多有利於有效交通管理的舉措
- 歐洲鐵路基礎建設投資不斷增加
- 亞太地區都市化進程快速推進,智慧城市計畫不斷湧現
- 產業陷阱與挑戰
- 與遺留系統的整合複雜性
- 海上設備成本高 安裝成本高且資料複雜
- 成長動力
- 成長潛力分析
- 波特的分析
- PESTEL分析
第4章:競爭格局
- 介紹
- 公司市佔率分析
- 競爭定位矩陣
- 戰略展望矩陣
第5章:市場估計與預測:依運輸方式,2021 - 2034 年
- 主要趨勢
- 軌
- 路
- 空氣
- 海洋
第6章:市場估計與預測:鐵路運輸,2021 - 2034 年
- 主要趨勢
- 成分
- 解決方案
- 軌道運輸管理
- 資產管理軟體
- 鐵路通訊及網路
- 即時乘客資訊系統
- 鐵路分析
- 服務
- 專業服務
- 安裝、維護和操作
- 解決方案
- 應用
- 智慧票務
- 乘客資訊系統
- 操作與防撞
- 安全
- 緊急通知
- 其他
第7章:市場估計與預測:依道路分類,2021 - 2034 年
- 主要趨勢
- 系統
- 先進的交通管理系統(ATMS)
- 先進的旅行者資訊系統(ATIS)
- 先進運輸定價系統(ATPS)
- 先進公共運輸系統(APTS)
- 先進的農村交通系統(ARTS)
- 商用車輛營運(CVO)
- 成分
- 硬體
- 電信網路
- 介面板
- 感應器
- 監測檢測系統
- 監視器
- 軟體
- 視覺化軟體
- 影片偵測管理軟體
- 交通管理系統
- 其他
- 服務
- 專業服務
- 安裝、維護和操作
- 硬體
- 應用
- 交通管理
- 道路安全
- 貨運管理
- 停車管理
- 道路使用者收費/ETC
- 遠端資訊處理
第8章:市場估計與預測:空運,2021 - 2034
- 主要趨勢
- 系統
- 資訊顯示系統
- 追蹤和監控系統
- 自助行李系統
- 自助服務終端
- 通訊和網路
- 智慧門系統
- 其他
- 應用
- 安全
- 智慧票務
- 公車追蹤
- 機隊管理(飛機管理)
- 緊急通知
- 乘客資訊
- 其他
第9章:市場估計與預測:按船舶,2021 - 2034 年
- 主要趨勢
- 系統
- 海上導航與資訊系統
- 追蹤和監控系統
- 船舶交通管理系統
- 應用
- 貨物運輸(貨櫃)
- 安全和緊急通知
- 天氣資訊
- 海上抵達和過境
- 其他
第10章:市場估計與預測:按地區,2021 - 2034 年
- 北美洲
- 美國
- 加拿大
- 歐洲
- 英國
- 德國
- 法國
- 西班牙
- 義大利
- 荷蘭
- 俄羅斯
- 亞太地區
- 中國
- 印度
- 日本
- 新加坡
- 澳洲
- 拉丁美洲
- 巴西
- 墨西哥
- 阿根廷
- MEA
- 阿拉伯聯合大公國
- 沙烏地阿拉伯
- 南非
第 11 章:公司簡介
- Alstom
- Cisco
- Clever Devices
- Cubic
- Embross
- ETA Transit Systems
- FURUNO ELECTRIC
- Garmin
- Indra Sistemas
- Kapsch
- Kongsberg Gruppen
- Kyosan Electric Manufacturing
- Lanner Electronics
- Nisshinbo
- Northrop Grumman
- Q-Free ASA
- Raytheon
- Siemens
- Teledyne
- Thales
- Trapeze Group
- Xerox
The Global Intelligent Transportation System Market reached a valuation of USD 47.2 billion in 2024 and is projected to expand at a CAGR of 10.3% from 2025 to 2034. The increasing focus on smart city development is a significant driver as urbanization continues to rise at an unprecedented rate. Cities worldwide are experiencing heightened demand for sustainable, efficient, and safer mobility solutions. As the global population shifts towards urban areas, digital advancements in transportation infrastructure are essential for optimizing traffic flow, reducing congestion, and improving public transit efficiency.
ITS solutions integrate advanced traffic management, real-time data analytics, interconnectivity, and public transit operations to streamline urban mobility. With growing environmental concerns, new technologies are being incorporated to support electric vehicles, shared transportation, and lower emissions. Urban expansion is expected to add millions of new vehicles to roads, challenging existing transport systems and requiring innovative solutions to maintain sustainability. The adoption of smart IoT, AI, and analytical technologies is redefining urban mobility by integrating multiple modes of transportation into seamless, multimodal networks. Real-time information systems allow travelers to access schedules, traffic updates, and alternate routes, enhancing efficiency and convenience. As cities implement policies promoting digital mobility ecosystems, investments in ITS continue to grow, driving the demand for safer and more sustainable urban transportation solutions.
| Market Scope | |
|---|---|
| Start Year | 2024 |
| Forecast Year | 2025-2034 |
| Start Value | $47.2 Billion |
| Forecast Value | $121.4 Billion |
| CAGR | 10.3% |
The market is segmented by mode of transportation, including rail, road, air, and marine. In 2024, the rail sector accounted for over 40% of the market share, while the road segment is forecast to exceed USD 25 billion by 2034. Governments are issuing high-value tenders for roadway enhancements, prioritizing infrastructure upgrades to accommodate increasing traffic volumes. These projects focus on improving intersections, rehabilitating roadways, and deploying real-time monitoring systems to enhance traffic management and mitigate congestion.
Within the railway segment, applications include smart ticketing, passenger information management, operations, security, emergency notifications, and collision avoidance. Passenger information management accounted for a 27.9% market share in 2024, while smart ticketing is projected to grow at a CAGR of 13% by 2034. Enhanced digital transformation efforts in transportation are leveraging real-time communication technologies, in-train computing systems, GPS tracking, and cloud-based information platforms to improve passenger experience and operational efficiency.
The air transportation segment includes information display systems, tracking and monitoring systems, self-service baggage solutions, kiosks, communication networks, and smart gates. Tracking and monitoring solutions led the market in 2024 with a valuation of USD 2 billion. The integration of GPS and IoT has revolutionized aviation by enabling real-time tracking of aircraft, passengers, and baggage. Enhanced situational awareness improves safety, operational efficiency, and asset management, ensuring seamless airline and airport operations.
The road transportation market is categorized into hardware, software, and services. In 2024, the hardware segment dominated, with a market share exceeding 55%. The adoption of GPS units, sensors, high-definition cameras, and ruggedized IoT devices has improved connectivity and operational reliability. Edge computing enables data processing within vehicles, enhancing efficiency and passenger safety.
In North America, the United States led the ITS market with a revenue of USD 10.6 billion in 2024. Public transit systems are increasingly adopting shared mobility services, integrating bike-sharing, e-scooters, and ride-sharing into multimodal transport networks. Contactless ticketing systems have been widely implemented, enabling seamless fare payments through smartphones, smart cards, and digital wallets. These advancements are enhancing urban mobility by reducing congestion, improving transit efficiency, and providing a more connected transportation experience.
Table of Contents
Chapter 1 Methodology & Scope
- 1.1 Research design
- 1.1.1 Research approach
- 1.1.2 Data collection methods
- 1.2 Base estimates & calculations
- 1.2.1 Base year calculation
- 1.2.2 Key trends for market estimation
- 1.3 Forecast model
- 1.4 Primary research and validation
- 1.4.1 Primary sources
- 1.4.2 Data mining sources
- 1.5 Market scope & definition
Chapter 2 Executive Summary
- 2.1 Industry synopsis, 2021 - 2034
Chapter 3 Industry Insights
- 3.1 Industry ecosystem analysis
- 3.1.1 Raw material suppliers
- 3.1.2 Component suppliers
- 3.1.3 Manufacturers
- 3.1.4 Technology/software providers
- 3.1.5 System integrators
- 3.1.6 Service providers
- 3.1.7 Government agencies
- 3.1.8 Financial authorities
- 3.2 Supplier landscape
- 3.3 Profit margin analysis
- 3.4 Technology & innovation landscape
- 3.5 Patent analysis
- 3.6 Key news & initiatives
- 3.7 Regulatory landscape
- 3.8 Impact forces
- 3.8.1 Growth drivers
- 3.8.1.1 Government funding and PPP models
- 3.8.1.2 Demand for Pay-as-you-go ticketing service among commuters in Europe and North America
- 3.8.1.3 Rise in favorable government initiatives for effective traffic management in North America and Asia Pacific
- 3.8.1.4 Growing investment in railway infrastructure in Europe
- 3.8.1.5 Rapidly growing urbanization and rising smart city projects in Asia Pacific
- 3.8.2 Industry pitfalls & challenges
- 3.8.2.1 Integration complexities with legacy systems
- 3.8.2.2 High cost of maritime equipment High installation cost and data complexity
- 3.8.1 Growth drivers
- 3.9 Growth potential analysis
- 3.10 Porter's analysis
- 3.11 PESTEL analysis
Chapter 4 Competitive Landscape, 2024
- 4.1 Introduction
- 4.2 Company market share analysis
- 4.3 Competitive positioning matrix
- 4.4 Strategic outlook matrix
Chapter 5 Market Estimates & Forecast, By Mode of Transport, 2021 - 2034 ($Bn)
- 5.1 Key trends
- 5.2 Rail
- 5.3 Road
- 5.4 Air
- 5.5 Marine
Chapter 6 Market Estimates & Forecast, By Rail, 2021 - 2034 ($Bn)
- 6.1 Key trends
- 6.2 Component
- 6.2.1 Solution
- 6.2.1.1 Rail traffic management
- 6.2.1.2 Asset management software
- 6.2.1.3 Rail communication and networking
- 6.2.1.4 Real-time passenger information system
- 6.2.1.5 Rail analytics
- 6.2.2 Services
- 6.2.2.1 Professional services
- 6.2.2.2 Installation, maintenance, and operation
- 6.2.1 Solution
- 6.3 Application
- 6.3.1 Smart ticketing
- 6.3.2 Passenger information system
- 6.3.3 Operation & collision avoidance
- 6.3.4 Security
- 6.3.5 Emergency notification
- 6.3.6 Others
Chapter 7 Market Estimates & Forecast, By Road, 2021 - 2034 ($Bn)
- 7.1 Key trends
- 7.2 System
- 7.2.1 Advanced traffic management system (ATMS)
- 7.2.2 Advanced traveler information system (ATIS)
- 7.2.3 Advanced transportation pricing system (ATPS)
- 7.2.4 Advanced public transport system (APTS)
- 7.2.5 Advanced rural transportation system (ARTS)
- 7.2.6 Commercial vehicle operation (CVO)
- 7.3 Component
- 7.3.1 Hardware
- 7.3.1.1 Telecommunication network
- 7.3.1.2 Interface boards
- 7.3.1.3 Sensors
- 7.3.1.4 Monitoring & detection system
- 7.3.1.5 Surveillance camera
- 7.3.2 Software
- 7.3.2.1 Visualization software
- 7.3.2.2 Video detection management software
- 7.3.2.3 Transit management system
- 7.3.2.4 Others
- 7.3.3 Services
- 7.3.3.1 Professional services
- 7.3.3.2 Installation, maintenance, and operation
- 7.3.1 Hardware
- 7.4 Application
- 7.4.1 Traffic management
- 7.4.2 Road safety
- 7.4.3 Freight management
- 7.4.4 Parking management
- 7.4.5 Road user charging/ETC
- 7.5 Telematics
Chapter 8 Market Estimates & Forecast, By Air, 2021 - 2034 ($Bn)
- 8.1 Key trends
- 8.2 System
- 8.2.1 Information display system
- 8.2.2 Tracking and monitoring system
- 8.2.3 Self-service baggage system
- 8.2.4 Kiosks
- 8.2.5 Communication and networking
- 8.2.6 Smart gate system
- 8.2.7 Others
- 8.3 Application
- 8.3.1 Security
- 8.3.2 Smart ticketing
- 8.3.3 Bus tracking
- 8.3.4 Fleet management (aircraft management)
- 8.3.5 Emergency notification
- 8.3.6 Passenger information
- 8.3.7 Others
Chapter 9 Market Estimates & Forecast, By Marine, 2021 - 2034 ($Bn)
- 9.1 Key trends
- 9.2 System
- 9.2.1 Maritime navigation and information system
- 9.2.2 Tracking and monitoring system
- 9.2.3 Vessel traffic management system
- 9.3 Application
- 9.3.1 Freight movement (container)
- 9.3.2 Security and emergency notification
- 9.3.3 Weather information
- 9.3.4 Marine arrival and transit
- 9.3.5 Others
Chapter 10 Market Estimates & Forecast, By Region, 2021 - 2034 ($Bn)
- 10.1 North America
- 10.1.1 U.S.
- 10.1.2 Canada
- 10.2 Europe
- 10.2.1 UK
- 10.2.2 Germany
- 10.2.3 France
- 10.2.4 Spain
- 10.2.5 Italy
- 10.2.6 Netherlands
- 10.2.7 Russia
- 10.3 Asia Pacific
- 10.3.1 China
- 10.3.2 India
- 10.3.3 Japan
- 10.3.4 Singapore
- 10.3.5 Australia
- 10.4 Latin America
- 10.4.1 Brazil
- 10.4.2 Mexico
- 10.4.3 Argentina
- 10.5 MEA
- 10.5.1 UAE
- 10.5.2 Saudi Arabia
- 10.5.3 South Africa
Chapter 11 Company Profiles
- 11.1 Alstom
- 11.2 Cisco
- 11.3 Clever Devices
- 11.4 Cubic
- 11.5 Embross
- 11.6 ETA Transit Systems
- 11.7 FURUNO ELECTRIC
- 11.8 Garmin
- 11.9 Indra Sistemas
- 11.10 Kapsch
- 11.11 Kongsberg Gruppen
- 11.12 Kyosan Electric Manufacturing
- 11.13 Lanner Electronics
- 11.14 Nisshinbo
- 11.15 Northrop Grumman
- 11.16 Q-Free ASA
- 11.17 Raytheon
- 11.18 Siemens
- 11.19 Teledyne
- 11.20 Thales
- 11.21 Trapeze Group
- 11.22 Xerox
 公共運輸市場規模、佔有率及成長分析(按推進力、模式類型、移動性、分銷管道、應用、最終用戶和地區)-2025 年至 2032 年產業預測
 智慧交通系統市場 - 全球和區域分析:按應用、產品和國家 - 分析和預測(2024-2033 年)
 智慧交通系統市場-全球產業分析、規模、佔有率、成長、趨勢及預測(2025-2035)2025 年智慧型運輸系統全球市場報告
 全球智慧交通系統市場:市場規模、佔有率、趨勢、產業分析(依類型、交通方式、服務、應用和地區)、未來預測(2025-2034)
 公共交通,全球 2025-2029
 2025-2033 年日本智慧交通系統市場報告(按產品、產品、協定(短程、長程、IEEE 1512、交通管理資料字典等)、交通方式、應用和區域分類)
 智慧交通系統市場規模和預測、全球和地區佔有率、趨勢和成長機會分析報告範圍:按類型、系統、應用程式和地理位置智慧交通系統市場:按產品、系統、功能和應用分類 - 2025-2030 年全球預測
 公路及鐵路貨運脫碳