


 |
市場調查報告書
商品編碼
1698568
包裝標籤市場機會、成長動力、產業趨勢分析及 2025-2034 年預測Packaging Labels Market Opportunity, Growth Drivers, Industry Trend Analysis, and Forecast 2025-2034 |
||||||
2024 年全球包裝標籤市場價值為 556 億美元,預計 2025 年至 2034 年的複合年成長率為 4.6%。電子商務的快速擴張是一個重要驅動力,推動了電子、食品、時尚和製藥等各行業對包裝標籤的需求。隨著網路零售的擴張,對清晰、耐用且符合法規要求的標籤的需求不斷增加。隨著企業致力於減少碳足跡,該行業也正在轉向永續標籤解決方案。可重複使用和環保包裝正變得越來越普遍,企業整合可回收材料並採用智慧標籤技術來增強產品可追溯性和消費者參與度。
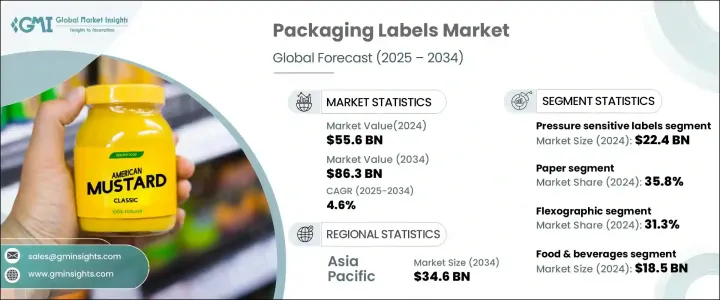
市場按標籤類型細分,包括壓敏標籤、收縮標籤、拉伸標籤和濕膠標籤。 2024年,壓敏標籤的市場規模為224億美元,由於其跨產業的適應性,將繼續廣泛的應用。收縮標籤預計到 2034 年將達到 229 億美元,因其能夠適應複雜的包裝形狀並提供全面的品牌覆蓋而受到青睞。拉伸標籤的複合年成長率為 4.3%,通常用於防篡改包裝,而濕膠標籤預計到 2034 年將達到 89 億美元,在高檔食品和飲料產品中很受歡迎。採用整合 RFID 和數位印刷技術的智慧標籤進一步增強了品牌推廣、認證和可追溯性。
| 市場範圍 | |
|---|---|
| 起始年份 | 2024 |
| 預測年份 | 2025-2034 |
| 起始值 | 556億美元 |
| 預測值 | 863億美元 |
| 複合年成長率 | 4.6% |
根據材料類型,市場分為紙質標籤、塑膠標籤和金屬標籤。 2024 年,紙質標籤佔據了 35.8% 的市場佔有率,反映出人們開始轉向無塑膠替代品。塑膠標籤的複合年成長率為 5.1%,正在採用可生物分解的材料以符合永續發展目標。金屬標籤因其耐用性和耐惡劣環境條件的特異性,預計到 2034 年其市場價值將達到 91 億美元。
印刷技術的進步正在重塑這個產業。柔版印刷到 2024 年將佔據 31.3% 的市場佔有率,仍然是高速、大量生產的首選。由於其卓越的影像品質和色彩一致性,預計到 2034 年凹版印刷的市場規模將達到 209 億美元。數位印刷的複合年成長率為 4.8%,支援更短的生產週期和客製化,而膠印預計到 2034 年將達到 48 億美元,仍然是中型到大型印刷的首選。混合印刷結合了傳統技術和數位技術,其複合年成長率為 2.6%。
食品和飲料、製藥、消費品和汽車等終端行業正在推動市場擴張。 2024 年,食品和飲料產業的價值將達到 185 億美元,嚴格的標籤法規將增強需求。製藥業的複合年成長率為 6.2%,正在利用智慧標籤來改善產品的認證和可追溯性。預計到 2034 年,消費品市場規模將達到 128 億美元,消費品越來越注重美觀且資訊豐富的標籤。汽車和工業領域擴大整合 RFID 解決方案用於庫存追蹤和供應鏈管理。
亞太地區將主導市場,到 2034 年將達到 346 億美元。該地區蓬勃發展的電子商務行業和智慧標籤解決方案的採用是關鍵的成長因素。對永續包裝解決方案的需求不斷推動創新,塑造全球包裝標籤市場的未來。
目錄
第1章:方法論與範圍
- 市場範圍和定義
- 基礎估算與計算
- 預測參數
- 資料來源
- 基本的
- 次要
- 付費來源
- 公共資源
第2章:執行摘要
第3章:行業洞察
- 產業生態系統分析
- 供應商矩陣
- 技術與創新格局
- 專利分析
- 重要新聞和舉措
- 監管格局
- 衝擊力
- 成長動力
- 電子商務領域蓬勃發展
- 消費者對永續包裝的偏好日益增強
- 技術進步
- 監管要求
- 食品和飲料行業的成長
- 產業陷阱與挑戰
- 環境問題
- 監管限制
- 成長動力
- 成長潛力分析
- 波特的分析
- PESTEL分析
第4章:競爭格局
- 公司市佔率分析
- 競爭定位矩陣
- 戰略展望矩陣
第5章:市場估計與預測:按標籤類型,2021 - 2032 年
- 主要趨勢
- 壓力標籤
- 收縮標籤
- 拉伸標籤
- 濕膠標籤
- 其他
第6章:市場估計與預測:依資料,2021 年至 2032 年
- 主要趨勢
- 紙
- 塑膠
- 金屬
- 其他
第7章:市場估計與預測:依印刷技術,2021 年至 2032 年
- 主要趨勢
- 柔版印刷
- 輪轉凹版印刷/凹印
- 數位印刷
- 膠印
- 混合印刷
第8章:市場估計與預測:依最終用途,2021 年至 2032 年
- 主要趨勢
- 食品和飲料
- 烘焙和糖果
- 乳製品
- 冷凍食品
- 酒精
- 非酒精性
- 其他
- 製藥
- 片劑/膠囊
- 乳膏和軟膏
- 液體糖漿
- 其他
- 消費品
- 化學品
- 汽車
- 工業的
- 其他
第9章:市場估計與預測:按地區,2021 - 2032 年
- 主要趨勢
- 北美洲
- 美國
- 加拿大
- 歐洲
- 英國
- 德國
- 法國
- 義大利
- 西班牙
- 歐洲其他地區
- 亞太地區
- 中國
- 印度
- 日本
- 韓國
- 澳新銀行
- 亞太其他地區
- 拉丁美洲
- 巴西
- 墨西哥
- 拉丁美洲其他地區
- MEA
- 阿拉伯聯合大公國
- 沙烏地阿拉伯
- 南非
- MEA 其餘地區
第10章:公司簡介
- 3M Company
- Amcor plc
- Anchor Printing
- Avery Dennison Corporation
- Berry Global
- CCL Industries Inc.
- Constantia Flexibles Group GmbH
- Coveris Holding SA
- Fort Dearborn Company
- Fuji Seal International, Inc.
- HERMA GmbH
- Honeywell International Inc.
- Huhtamaki Group
- ID Images
- Klöckner Pentaplast Europe GmbH & Co KG
- KRIS FLEXIPACKS PVT. LTD.
- Lintec Corporation
- Mondi Plc
- Multi-Color Corporation
- Neenah, Inc
- Resource Label Group, LLC
- Sato Holdings Corporation
- Taghleef Industries Inc.
- UPM Raflatac
- WestRock Company
The Global Packaging Labels Market was valued at USD 55.6 billion in 2024 and is expected to grow at a CAGR of 4.6% from 2025 to 2034. The rapid expansion of e-commerce is a significant driver, fueling the demand for packaging labels across various industries, including electronics, food, fashion, and pharmaceuticals. As online retail expands, the need for clear, durable, and regulatory-compliant labeling continues to rise. The industry is also shifting towards sustainable labeling solutions as companies aim to reduce their carbon footprint. Reusable and eco-friendly packaging is becoming more prevalent, with businesses integrating recyclable materials and adopting smart labeling technologies to enhance product traceability and consumer engagement.
The market is segmented by label type, including pressure-sensitive labels, shrink labels, stretch labels, and wet glue labels. Pressure-sensitive labels accounted for USD 22.4 billion in 2024 and continue to be widely used due to their adaptability across industries. Shrink labels, projected to reach USD 22.9 billion by 2034, are preferred for their ability to conform to complex packaging shapes, offering full branding coverage. Stretch labels, growing at a CAGR of 4.3%, are commonly used for tamper-evident packaging, while wet glue labels, expected to reach USD 8.9 billion by 2034, are popular in premium food and beverage products. The adoption of smart labels integrated with RFID and digital printing technologies is further enhancing branding, authentication, and traceability.
| Market Scope | |
|---|---|
| Start Year | 2024 |
| Forecast Year | 2025-2034 |
| Start Value | $55.6 Billion |
| Forecast Value | $86.3 Billion |
| CAGR | 4.6% |
By material type, the market is classified into paper, plastic, and metal labels. Paper labels held a 35.8% market share in 2024, reflecting a shift toward plastic-free alternatives. Plastic labels, growing at a CAGR of 5.1%, are incorporating biodegradable materials to align with sustainability goals. Metal labels, anticipated to reach USD 9.1 billion by 2034, remain in demand for their durability and resistance to harsh environmental conditions.
Advancements in printing technology are reshaping the industry. Flexographic printing, holding a 31.3% market share in 2024, remains the leading choice for high-speed, large-volume production. Rotogravure printing is expected to reach USD 20.9 billion by 2034 due to its superior image quality and color consistency. Digital printing, growing at a CAGR of 4.8%, supports shorter production runs and customization, while offset printing, projected to reach USD 4.8 billion by 2034, remains a preferred option for medium to large-scale printing. Hybrid printing, combining traditional and digital techniques, is expanding at a CAGR of 2.6%.
End-use industries such as food and beverages, pharmaceuticals, consumer goods, and automotive are driving market expansion. The food and beverage segment was valued at USD 18.5 billion in 2024, with stringent labeling regulations enhancing demand. The pharmaceutical industry, growing at a CAGR of 6.2%, is leveraging smart labels for improved product authentication and traceability. Consumer goods, projected to reach USD 12.8 billion by 2034, are focusing on aesthetic and informative labeling. The automotive and industrial sectors are increasingly integrating RFID solutions for inventory tracking and supply chain management.
Asia Pacific is set to dominate the market, reaching USD 34.6 billion by 2034. The region's booming e-commerce sector and adoption of smart labeling solutions are key growth factors. The demand for sustainable packaging solutions continues to drive innovation, shaping the future of the global packaging labels market.
Table of Contents
Chapter 1 Methodology & Scope
- 1.1 Market scope & definition
- 1.2 Base estimates & calculations
- 1.3 Forecast parameters
- 1.4 Data sources
- 1.4.1 Primary
- 1.4.2 Secondary
- 1.4.2.1 Paid sources
- 1.4.2.2 Public sources
Chapter 2 Executive Summary
- 2.1 Industry 3600 synopsis, 2021 - 2032
Chapter 3 Industry Insights
- 3.1 Industry ecosystem analysis
- 3.2 Vendor matrix
- 3.3 Technology & innovation landscape
- 3.4 Patent analysis
- 3.5 Key news and initiatives
- 3.6 Regulatory landscape
- 3.7 Impact forces
- 3.7.1 Growth drivers
- 3.7.1.1 Growing E-Commerce sector
- 3.7.1.2 Rising consumer preference for sustainable packaging
- 3.7.1.3 Technological advancements
- 3.7.1.4 Regulatory requirements
- 3.7.1.5 Growth in the food and beverage industry
- 3.7.2 Industry pitfalls & challenges
- 3.7.2.1 Environmental concerns
- 3.7.2.2 Regulatory restrictions
- 3.7.1 Growth drivers
- 3.8 Growth potential analysis
- 3.9 Porter's analysis
- 3.9.1 Supplier power
- 3.9.2 Buyer power
- 3.9.3 Threat of new entrants
- 3.9.4 Threat of substitutes
- 3.9.5 Industry rivalry
- 3.10 PESTEL analysis
Chapter 4 Competitive Landscape, 2023
- 4.1 Company market share analysis
- 4.2 Competitive positioning matrix
- 4.3 Strategic outlook matrix
Chapter 5 Market Estimates & Forecast, By Label Type, 2021 - 2032 (USD Million)
- 5.1 Key trends
- 5.2 Pressure sensitive labels
- 5.3 Shrink labels
- 5.4 Stretch labels
- 5.5 Wet glue labels
- 5.6 Others
Chapter 6 Market Estimates & Forecast, By Material, 2021 – 2032 (USD Million)
- 6.1 Key trends
- 6.2 Paper
- 6.3 Plastic
- 6.4 Metal
- 6.5 Others
Chapter 7 Market Estimates & Forecast, By Printing Technology, 2021 – 2032 (USD Million)
- 7.1 Key trends
- 7.2 Flexographic
- 7.3 Rotogravure/Gravure
- 7.4 Digital printing
- 7.5 Offset printing
- 7.6 Hybrid printing
Chapter 8 Market Estimates & Forecast, By End-Use, 2021 – 2032 (USD Million)
- 8.1 Key trends
- 8.2 Food & beverages
- 8.2.1 Bakery & confectionery
- 8.2.2 Dairy products
- 8.2.3 Frozen food
- 8.2.4 Alcoholic
- 8.2.5 Non-Alcoholic
- 8.2.6 Others
- 8.3 Pharmaceutical
- 8.3.1 Tablet/Capsules
- 8.3.2 Cream & ointment
- 8.3.3 Liquid syrup
- 8.3.4 Others
- 8.4 Consumer goods
- 8.5 Chemicals
- 8.6 Automotive
- 8.7 Industrial
- 8.8 Others
Chapter 9 Market Estimates & Forecast, By Region, 2021 - 2032 (USD Million)
- 9.1 Key trends
- 9.2 North America
- 9.2.1 U.S.
- 9.2.2 Canada
- 9.3 Europe
- 9.3.1 UK
- 9.3.2 Germany
- 9.3.3 France
- 9.3.4 Italy
- 9.3.5 Spain
- 9.3.6 Rest of Europe
- 9.4 Asia Pacific
- 9.4.1 China
- 9.4.2 India
- 9.4.3 Japan
- 9.4.4 South Korea
- 9.4.5 ANZ
- 9.4.6 Rest of Asia Pacific
- 9.5 Latin America
- 9.5.1 Brazil
- 9.5.2 Mexico
- 9.5.3 Rest of Latin America
- 9.6 MEA
- 9.6.1 UAE
- 9.6.2 Saudi Arabia
- 9.6.3 South Africa
- 9.6.4 Rest of MEA
Chapter 10 Company Profiles
- 10.1 3M Company
- 10.2 Amcor plc
- 10.3 Anchor Printing
- 10.4 Avery Dennison Corporation
- 10.5 Berry Global
- 10.6 CCL Industries Inc.
- 10.7 Constantia Flexibles Group GmbH
- 10.8 Coveris Holding S.A.
- 10.9 Fort Dearborn Company
- 10.10 Fuji Seal International, Inc.
- 10.11 HERMA GmbH
- 10.12 Honeywell International Inc.
- 10.13 Huhtamaki Group
- 10.14 ID Images
- 10.15 Klöckner Pentaplast Europe GmbH & Co KG
- 10.16 KRIS FLEXIPACKS PVT. LTD.
- 10.17 Lintec Corporation
- 10.18 Mondi Plc
- 10.19 Multi-Color Corporation
- 10.20 Neenah, Inc
- 10.21 Resource Label Group, LLC
- 10.22 Sato Holdings Corporation
- 10.23 Taghleef Industries Inc.
- 10.24 UPM Raflatac
- 10.25 WestRock Company
 增強文字標籤市場報告:2031 年趨勢、預測與競爭分析
 2025年全球工業標籤市場報告
 標記·產品裝飾的全球市場(2025年)
 包裝標籤市場規模、佔有率、趨勢分析報告:按材料、標籤類型、最終用途、地區、細分預測,2025-2030
 工業標籤市場規模、佔有率和成長分析(按材料、類型、印刷技術、最終用途行業和地區)- 2025-2032 年行業預測工業標籤市場機會、成長動力、產業趨勢分析與 2025 - 2034 年預測
 全球標籤 -市場佔有率分析、行業趨勢和統計、成長預測(2025-2030 年)到 2030 年可洗非標籤藥物市場預測:按黏合劑類型、材料、技術、應用、最終用戶和地區進行的全球分析再封口標籤市場至2030年的預測:按產品、材料、技術、應用、最終用戶和地區的全球分析
 全球標籤市場 - 2024-2031