


 |
市場調查報告書
商品編碼
1698582
寵物食品及零食市場機會、成長動力、產業趨勢分析及 2025-2034 年預測Pet Food and Treats Market Opportunity, Growth Drivers, Industry Trend Analysis, and Forecast 2025-2034 |
||||||
2024 年全球寵物食品和零食市場價值為 1,389 億美元,預計 2025 年至 2034 年期間的複合年成長率為 6.1%。隨著寵物主人優先考慮寵物的健康和福祉,對優質寵物食品的支出增加推動了對高品質原料的需求。消費者正在尋求既有營養價值又有增強口感的新型成分。這種被稱為高階化的趨勢為創新配方創造了機會,旨在滿足寵物的飲食需求,同時保持卓越的品質。
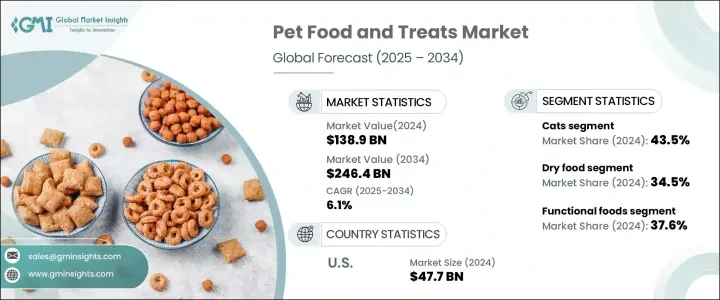
隨著寵物越來越被視為家庭成員,主人願意投資採用知名高品質成分的優質寵物食品產品。市場透過包含真正的肉類來源、水果、蔬菜和全穀物同時避免填充劑、副產品和人工添加劑來區分優質寵物食品。由於乾糧被廣泛接受且方便食用,到 2024 年,乾糧將佔據寵物食品和零食市場 34.5% 的佔有率。
| 市場範圍 | |
|---|---|
| 起始年份 | 2024 |
| 預測年份 | 2025-2034 |
| 起始值 | 1389億美元 |
| 預測值 | 2464億美元 |
| 複合年成長率 | 6.1% |
標準寵物食品含有約 14% 至 17% 的肉和肉類副產品,以及穀物、穀類、維生素和礦物質。光是在美國,每年就有超過 300 家製造商生產約 700 萬噸寵物食品,提供從乾糧、罐頭食品到半濕糧、餅乾、粗磨食物和零食等多種選擇。乾寵物食品通常含有 10% 至 12% 的水分,而濕食品的水分含量為 70% 至 80%。
2024 年,貓糧佔寵物食品和零食市場的 43.5% 以上,而狗糧的需求成長速度更快,與其他寵物類別相比,成長率高出 6.2%。 2022 年和 2023 年,狗乾糧和貓乾糧銷售額均顯著成長。乾狗糧銷售額達 13 億美元,成長 19.7%,乾貓糧銷售額達 6 億美元,成長 21.8%。濕狗糧和貓糧的銷售量也分別成長了12.5%和14.6%。
擠壓乾粗磨食物仍然是寵物食品市場的主導選擇,佔銷售額的 57%。此外,儘管有一定比例的寵物每天也會吃罐頭食品,但超過 60% 的狗主人和 69% 的貓主人會定期餵食他們的寵物粗磨食物。 2024 年,市場按成分類型細分為蛋白質、穀物和蔬菜、脂肪和油以及維生素和礦物質。功能性食品佔了37.6%的收入佔有率,為營養全面的商業寵物食品奠定了基礎。
人們對純素和無穀物寵物食品的興趣日益濃厚,推動了對替代成分(尤其是水果和蔬菜)的需求,以增強口感、質地和風味。 2024 年,美國寵物食品和零食市場規模達到 477 億美元,其中約 55% 的收入來自粗磨食物以外的替代形式,包括罐裝、半濕和冷藏寵物食品。雖然冷藏寵物食品目前僅佔 4% 的佔有率,但其年成長率高達 35%。
目錄
第1章:方法論與範圍
- 市場範圍和定義
- 基礎估算與計算
- 預測計算
- 資料來源
- 基本的
- 次要
- 付費來源
- 公共資源
- 初步研究和驗證
- 主要來源
- 資料探勘來源
第2章:執行摘要
第3章:行業洞察
- 產業生態系統分析
- 影響價值鏈的因素
- 利潤率分析
- 中斷
- 未來展望
- 製造商
- 經銷商
- 供應商格局
- 利潤率分析
- 重要新聞和舉措
- 監管格局
- 衝擊力
- 成長動力
- 優質寵物食品需求不斷成長
- 全球寵物收養率不斷提高
- 擴大寵物食品電商銷售
- 產業陷阱與挑戰
- 優質寵物食品成本高昂
- 嚴格的寵物食品安全法規
- 成長動力
- 成長潛力分析
- 波特的分析
- PESTEL分析
第4章:競爭格局
- 介紹
- 公司市佔率分析
- 競爭定位矩陣
- 戰略展望矩陣
第5章:市場估計與預測:依產品類型,2021 年至 2034 年
- 主要趨勢
- 餅乾、餅乾、零食
- 罐頭食品
- 骨頭
- 乾糧
- 棍棒
- 其他(凍乾食品等)
第6章:市場估計與預測:按寵物類型,2021 年至 2034 年
- 主要趨勢
- 狗
- 貓
- 其他(魚、鳥、倉鼠等)
第7章:市場估計與預測:依成分類型,2021 年至 2034 年
- 主要趨勢
- 蛋白質
- 雞
- 牛肉
- 魚(鮭魚、鮪魚)
- 土耳其
- 羊肉
- 穀物和蔬菜
- 脂肪和油
- 維生素和礦物質
- 其他(增味劑、特殊補充品等)
第8章:市場估計與預測:按包裝,2021 年至 2034 年
- 主要趨勢
- 罐頭
- 袋裝
- 包包
- 紙盒
- 其他(罐、桶子等)
第9章:市場估計與預測:依人生階段,2021 年至 2034 年
- 主要趨勢
- 小狗/小貓
- 成年寵物
- 老年寵物
第10章:市場估計與預測:依特殊飲食需求,2021 年至 2034 年
- 主要趨勢
- 體重管理
- 無穀物
- 低過敏性
- 有機/天然
- 生鮮/凍乾
第 11 章:市場估計與預測:按價格範圍,2021 年至 2034 年
- 主要趨勢
- 低的
- 中等的
- 高的
第 12 章:市場估計與預測:按配銷通路,2021 年至 2034 年
- 主要趨勢
- 線上
- 電子商務
- 公司網站
- 離線
- 超市/雜貨店
- 寵物專賣店
- 零售商
- 獸醫診所
第 13 章:市場估計與預測:按地區,2021 年至 2034 年
- 主要趨勢
- 北美洲
- 美國
- 加拿大
- 歐洲
- 德國
- 英國
- 法國
- 西班牙
- 義大利
- 俄羅斯
- 亞太地區
- 中國
- 印度
- 日本
- 澳洲
- 韓國
- 拉丁美洲
- 巴西
- 墨西哥
- 中東和非洲
- 沙烏地阿拉伯
- 南非
- 阿拉伯聯合大公國
第 14 章:公司簡介
- Agrolimen SA
- Big Heart Pet Brands, Inc.
- Blue Buffalo Pet Products, Inc.
- Diamond Pet Foods
- Freshpet
- General Mills, Inc.
- Heristo AG
- Hill's Pet Nutrition, Inc.
- Mars Petcare US, Inc.
- Nestlé Purina PetCare Company
- Nisshin Pet Food, Inc.
- Nutriara Alimentos Ltda
- The JM Smucker Company
- WellPet LLC
The Global Pet Food And Treats Market was valued at USD 138.9 billion in 2024 and is projected to grow at a 6.1% CAGR from 2025 to 2034. Increased spending on premium pet food is driving demand for high-quality ingredients as pet owners prioritize their pets' health and well-being. Consumers are seeking novel ingredients that offer both nutritional benefits and enhanced taste. This trend, known as premiumization, is creating opportunities for innovative formulations designed to cater to pets' dietary needs while maintaining superior quality.
With pets increasingly seen as family members, owners are willing to invest in premium pet food products that feature recognizable, high-quality ingredients. The market differentiates premium pet food by including real meat sources, fruits, vegetables, and whole grains while avoiding fillers, by-products, and artificial additives. The dry food segment held a 34.5% share of the pet food and treats market in 2024, owing to its widespread acceptance and convenience.
| Market Scope | |
|---|---|
| Start Year | 2024 |
| Forecast Year | 2025-2034 |
| Start Value | $138.9 Billion |
| Forecast Value | $246.4 Billion |
| CAGR | 6.1% |
Standard pet food contains approximately 14 to 17 percent meat and meat by-products, along with cereals, grains, vitamins, and minerals. In the United States alone, over 300 manufacturers produce around 7 million tons of pet food annually, offering a vast selection ranging from dry and canned options to semi-moist varieties, biscuits, kibbles, and treats. Dry pet food generally contains 10 to 12 percent moisture, whereas wet food has a moisture content ranging from 70 to 80 percent.
The cat food segment accounted for over 43.5% of the pet food and treats market in 2024, while the demand for dog food is rising at a faster rate, registering 6.2% higher growth compared to other pet categories. Both dog and cat dry food sales experienced significant growth in 2022 and 2023. Sales of dry dog food reached USD 1.3 billion, reflecting a 19.7% increase, while dry cat food sales amounted to USD 0.6 billion, marking a 21.8% growth. Wet dog and cat food sales also expanded by 12.5% and 14.6%, respectively.
Extruded dry kibble remains the dominant choice in the pet food market, accounting for 57% of sales. Additionally, over 60% of dog owners and 69% of cat owners regularly feed their pets kibble, despite a percentage of pets also consuming canned food daily. In 2024, the market was segmented by ingredient type into proteins, cereals and vegetables, fats and oils, and vitamins and minerals. Functional foods commanded a 37.6% revenue share, serving as a foundation for nutritionally complete commercial pet food.
The rising interest in vegan and grain-free pet food options is fueling demand for alternative ingredients, particularly fruits and vegetables, to enhance taste, texture, and flavor. The US pet food and treats market reached USD 47.7 billion in 2024, with approximately 55% of revenue coming from alternative formats beyond kibble, including canned, semi-moist, and refrigerated pet food. While refrigerated pet food currently holds a modest 4% share, it is expanding at an annual growth rate of 35%.
Table of Contents
Chapter 1 Methodology & Scope
- 1.1 Market scope & definition
- 1.2 Base estimates & calculations
- 1.3 Forecast calculation
- 1.4 Data sources
- 1.4.1 Primary
- 1.4.2 Secondary
- 1.4.2.1 Paid sources
- 1.4.2.2 Public sources
- 1.5 Primary research and validation
- 1.5.1 Primary sources
- 1.5.2 Data mining sources
Chapter 2 Executive Summary
- 2.1 Industry synopsis, 2021-2034
Chapter 3 Industry Insights
- 3.1 Industry ecosystem analysis
- 3.1.1 Factor affecting the value chain
- 3.1.2 Profit margin analysis
- 3.1.3 Disruptions
- 3.1.4 Future outlook
- 3.1.5 Manufacturers
- 3.1.6 Distributors
- 3.2 Supplier landscape
- 3.3 Profit margin analysis
- 3.4 Key news & initiatives
- 3.5 Regulatory landscape
- 3.6 Impact forces
- 3.6.1 Growth drivers
- 3.6.1.1 Rising demand for premium pet food
- 3.6.1.2 Increasing pet adoption rates globally
- 3.6.1.3 Expansion of e-commerce pet food sales
- 3.6.2 Industry pitfalls & challenges
- 3.6.2.1 High costs of premium pet food
- 3.6.2.2 Stringent pet food safety regulations
- 3.6.1 Growth drivers
- 3.7 Growth potential analysis
- 3.8 Porter's analysis
- 3.9 PESTEL analysis
Chapter 4 Competitive Landscape, 2024
- 4.1 Introduction
- 4.2 Company market share analysis
- 4.3 Competitive positioning matrix
- 4.4 Strategic outlook matrix
Chapter 5 Market Estimates and Forecast, By Product Type, 2021 – 2034 (USD Billion) (Kilo Tons)
- 5.1 Key trends
- 5.2 Cookies, biscuits, snacks
- 5.3 Canned food
- 5.4 Bones
- 5.5 Dry food
- 5.6 Sticks
- 5.7 Others (Freeze-dried food, etc.)
Chapter 6 Market Estimates and Forecast, By Pet Type, 2021 – 2034 (USD Billion) (Kilo Tons)
- 6.1 Key trends
- 6.2 Dogs
- 6.3 Cats
- 6.4 Others (fish, birds, hamsters, etc.)
Chapter 7 Market Estimates and Forecast, By Ingredient Type, 2021 – 2034 (USD Billion) (Kilo Tons)
- 7.1 Key trends
- 7.2 Proteins
- 7.2.1 Chicken
- 7.2.2 Beef
- 7.2.3 Fish (salmon, tuna)
- 7.2.4 Turkey
- 7.2.5 Lamb
- 7.3 Cereals & Vegetables
- 7.4 Fats and oils
- 7.5 Vitamins & Minerals
- 7.6 Others (Flavour Enhancers, Specialty Supplemental, etc.)
Chapter 8 Market Estimates and Forecast, By Packaging, 2021 – 2034 (USD Billion) (Kilo Tons)
- 8.1 Key trends
- 8.2 Cans
- 8.3 Pouches
- 8.4 Bags
- 8.5 Carton
- 8.6 Others (tins, tubs, etc.)
Chapter 9 Market Estimates and Forecast, By Life Stage, 2021 – 2034 (USD Billion) (Kilo Tons)
- 9.1 Key trends
- 9.2 Puppy/kitten
- 9.3 Adult pet
- 9.4 Senior pet
Chapter 10 Market Estimates and Forecast, By Special Dietary Needs, 2021 – 2034 (USD Billion) (Kilo Tons)
- 10.1 Key trends
- 10.2 Weight management
- 10.3 Grain-free
- 10.4 Hypoallergenic
- 10.5 Organic/natural
- 10.6 Raw/freeze-dried
Chapter 11 Market Estimates and Forecast, By Price Range, 2021 – 2034 (USD Billion) (Kilo Tons)
- 11.1 Key trends
- 11.2 Low
- 11.3 Medium
- 11.4 High
Chapter 12 Market Estimates and Forecast, By Distribution Channel, 2021 – 2034 (USD Billion) (Kilo Tons)
- 12.1 Key trends
- 12.2 Online
- 12.2.1 E-commerce
- 12.2.2 Company websites
- 12.3 Offline
- 12.3.1 Supermarkets/grocery stores
- 12.3.2 Pet specialty stores
- 12.3.3 Retailers
- 12.3.4 Veterinary clinics
Chapter 13 Market Estimates and Forecast, By Region, 2021 – 2034 (USD Billion) (Kilo Tons)
- 13.1 Key trends
- 13.2 North America
- 13.2.1 U.S.
- 13.2.2 Canada
- 13.3 Europe
- 13.3.1 Germany
- 13.3.2 UK
- 13.3.3 France
- 13.3.4 Spain
- 13.3.5 Italy
- 13.3.6 Russia
- 13.4 Asia Pacific
- 13.4.1 China
- 13.4.2 India
- 13.4.3 Japan
- 13.4.4 Australia
- 13.4.5 South Korea
- 13.5 Latin America
- 13.5.1 Brazil
- 13.5.2 Mexico
- 13.6 Middle East and Africa
- 13.6.1 Saudi Arabia
- 13.6.2 South Africa
- 13.6.3 UAE
Chapter 14 Company Profiles
- 14.1 Agrolimen S.A.
- 14.2 Big Heart Pet Brands, Inc.
- 14.3 Blue Buffalo Pet Products, Inc.
- 14.4 Diamond Pet Foods
- 14.5 Freshpet
- 14.6 General Mills, Inc.
- 14.7 Heristo AG
- 14.8 Hill’s Pet Nutrition, Inc.
- 14.9 Mars Petcare US, Inc.
- 14.10 Nestlé Purina PetCare Company
- 14.11 Nisshin Pet Food, Inc.
- 14.12 Nutriara Alimentos Ltda
- 14.13 The J.M. Smucker Company
- 14.14 WellPet LLC
 印度的寵物市場評估:寵物產品市場,寵物服務市場,各地區,機會及預測,2018~2032年美國寵物市場評估、寵物產品市場、寵物服務市場,依地區,機會和預測,2018年至2032年
 2030 年寵物食品和零食市場預測:按產品類型、寵物、成分類型、分銷管道和地區進行的全球分析
 鳥籠及配件市場 - 全球產業規模、佔有率、趨勢、機會和預測,按類型、價格範圍、配銷通路、地區和競爭細分,2019-2029F
 寵物噪音焦慮市場機會、成長動力、產業趨勢分析和 2024 年至 2032 年預測
 寵物噪音焦慮市場:按類型、動物分類 - 全球預測 2025-2030寵物食品碗市場:按類型、按寵物類型、按地區寵物噪音焦慮市場 - 全球產業規模、佔有率、趨勢、機會和預測,按類型(寵物藥物、寵物包裹等)、動物類型(犬、貓、其他)、地區和競爭細分,2019-2029F狗背帶市場評估:依背帶類型、功能、材料、最終用戶、價格範圍、分銷管道和地區劃分的機會和預測(2017-2031)
 2023-2030 年全球寵物鎮靜產品市場規模研究與預測(依寵物類型、產品、配銷通路、類型及區域分析)