


 |
市場調查報告書
商品編碼
1698604
電影院市場機會、成長動力、產業趨勢分析及 2025-2034 年預測Drive in Movie Theater Market Opportunity, Growth Drivers, Industry Trend Analysis, and Forecast 2025-2034 |
||||||
2024 年,全球汽車電影院市場規模達到 53 億美元,預計 2025 年至 2034 年的複合年成長率將達到 6.6%。隨著年輕人和中年人群越來越被獨特的戶外電影體驗所吸引,該市場正在經歷復甦。雖然中年消費者往往被汽車劇院的懷舊氛圍所吸引,但年輕觀眾卻被汽車劇院的社交和社區中心特色所吸引。在新冠疫情期間,隨著人們尋求保持社交距離的娛樂方式,汽車劇院的受歡迎程度激增,而且這種趨勢仍在持續。推動成長的關鍵因素包括可支配收入的增加、汽車擁有量的增加以及投影系統和行動票務的技術進步。 2023 年美國可支配個人收入的成長進一步支持了休閒活動支出(包括汽車電影院體驗)的成長趨勢。
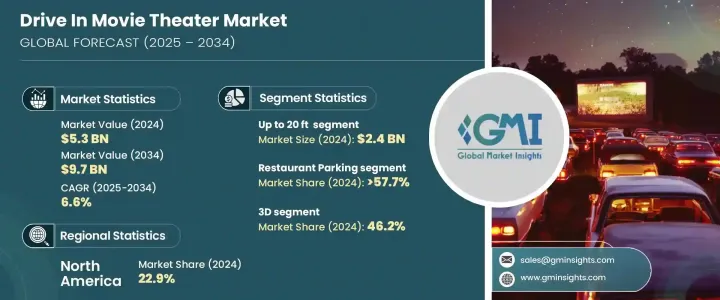
就螢幕尺寸而言,市場分為三類:20 英尺以下、20-50 英尺和 50 英尺以上。 20 英尺以下部分在 2024 年創造了 24 億美元的收入,預計到 2034 年的複合年成長率為 7.2%。這種螢幕尺寸特別受歡迎,因為它平衡了成本、空間和觀賞質量,使其成為小型和獨立汽車劇院的理想選擇。它為各種車輛類型提供清晰的觀看體驗,並為近距離和遠距離觀眾保持影像品質。 20 英尺螢幕的懷舊氛圍吸引著電影觀眾,同時仍然適應現代技術。
| 市場範圍 | |
|---|---|
| 起始年份 | 2024 |
| 預測年份 | 2025-2034 |
| 起始值 | 53億美元 |
| 預測值 | 97億美元 |
| 複合年成長率 | 6.6% |
從場地類型來看,汽車電影院市場分為餐廳停車場和劇院停車場。餐廳停車場部分佔 2024 年收入的 57.7% 以上,預計到 2034 年將以 6.8% 的複合年成長率成長。這些場所為餐廳提供了一個獨特的機會,可以將其停車場改造成戶外電影場所,這有助於增加客流量並產生額外的收入。由於對提供安全和社交距離的露天娛樂空間的需求不斷增加,這一趨勢得到了發展。
市場也按技術細分,其中 2D 和 3D 電影是主要選擇。預計到 2024 年,3D 領域將佔據 46.2% 的顯著佔有率。隨著偏光 3D 和數位投影技術的進步,汽車影院能夠提供增強的觀看體驗。這些創新,加上消費者對高階娛樂的興趣,推動了汽車劇院對 3D 放映的需求不斷成長。
北美在汽車電影院市場佔據主導地位,到 2024 年將貢獻總收入的 22.9%,即 12 億美元。該地區正在經歷汽車影院的復興,文化和技術因素在其持續成功中發揮關鍵作用。可支配收入的增加和對戶外娛樂體驗的偏好促進了市場的成長。
目錄
第1章:方法論與範圍
- 研究設計
- 研究方法
- 資料收集方法
- 基礎估算與計算
- 基準年計算
- 市場估計的主要趨勢
- 預測模型
- 初步研究與驗證
- 主要來源
- 資料探勘來源
- 市場定義
第2章:執行摘要
第3章:行業洞察
- 產業生態系統分析
- 供應商格局
- 定價分析
- 技術與創新格局
- 重要新聞和舉措
- 監管格局
- 製造商
- 經銷商
- 衝擊力
- 成長動力
- 融入先進技術並改善免下車區域
- 餐廳停車場被廣泛用於汽車電影院
- 消費支出不斷成長以及娛樂產業的數位化
- 產業陷阱與挑戰
- 季節性和天氣依賴性
- 初始設定成本高
- 成長動力
- 成長潛力分析
- 消費者購買行為
- 波特的分析
- PESTEL分析
第4章:競爭格局
- 介紹
- 公司市佔率分析
- 競爭定位矩陣
- 戰略展望矩陣
第5章:市場估計與預測:按螢幕尺寸,2021 - 2034 年
- 主要趨勢
- 高達 20 英尺
- 20-50英尺
- 50 英尺以上
第6章:市場估計與預測:按地區,2021 - 2034 年
- 主要趨勢
- 小規模
- 大規模
第7章:市場估計與預測:依技術分類,2021 - 2034 年
- 主要趨勢
- 2D
- 3D
第8章:市場估計與預測:按價格,2021 - 2034 年(十億美元)
- 主要趨勢
- 低的
- 中等的
- 高的
第9章:市場估計與預測:按應用,2021 - 2034 年
- 主要趨勢
- 餐廳停車場
- 劇院停車場
第10章:市場估計與預測:按地區,2021 - 2034 年
- 主要趨勢
- 北美洲
- 美國
- 加拿大
- 歐洲
- 英國
- 德國
- 法國
- 義大利
- 西班牙
- 俄羅斯
- 北歐人
- 亞太地區
- 中國
- 印度
- 日本
- 澳洲
- 韓國
- 東南亞
- 拉丁美洲
- 巴西
- 墨西哥
- 阿根廷
- 瑪米亞
- 阿拉伯聯合大公國
- 南非
- 沙烏地阿拉伯
第 11 章:公司簡介
- Capri Drive-In
- Coyote Drive-In and Canteen
- Delsea Drive-In
- Field of Dreams Drive-In
- Galaxy Drive-In
- Hull's Drive-In
- Malco Theatres
- Mesa Drive-In
- Shankweiler's Drive-In
- South Bay Drive-In
- Star Drive-In
- Starlight Cinemas
- Sunset Cinema Club
- Van Buren Drive-In
- Wellfleet Drive-In
The Global Drive In Movie Theater Market reached USD 5.3 billion in 2024 and is anticipated to grow at 6.6% CAGR from 2025 to 2034. This market is experiencing a resurgence as both younger and middle-aged groups are increasingly drawn to the unique outdoor movie experience. While middle-aged consumers often gravitate toward the nostalgic ambiance of drive-ins, younger audiences are attracted to the social and community-focused aspects of the events. The popularity of drive-in theaters surged during the COVID-19 pandemic as people sought socially distanced entertainment, and the trend continues to thrive. Key factors driving growth include greater disposable income, rising auto ownership, and technological advancements in projection systems and mobile ticketing. The increase in disposable personal income in the U.S. in 2023 further supports the growing trend of spending on leisure activities, including drive-in movie experiences.
In terms of screen size, the market is divided into three categories: up to 20 ft, 20-50 ft, and above 50 ft. The up to 20 ft segment generated USD 2.4 billion in 2024, with a forecasted CAGR of 7.2% through 2034. This screen size is particularly popular because it balances cost, space, and viewing quality, making it an ideal choice for small and independent drive-in theaters. It offers a clear viewing experience for various vehicle types and maintains image quality for both closer and distant viewers. The nostalgic vibe of the 20-foot screen appeals to moviegoers while still accommodating modern-day technology.
| Market Scope | |
|---|---|
| Start Year | 2024 |
| Forecast Year | 2025-2034 |
| Start Value | $5.3 Billion |
| Forecast Value | $9.7 Billion |
| CAGR | 6.6% |
Regarding venue types, the drive-in movie theater market is categorized into restaurant parking lots and theater parking lots. The restaurant parking lots segment accounted for over 57.7% of revenue in 2024 and is projected to grow at 6.8% CAGR until 2034. These venues offer a unique opportunity for restaurants to convert their parking lots into outdoor movie venues, which helps boost their traffic and generate additional revenue. This trend has gained traction due to the increasing demand for open-air entertainment spaces that offer safety and social distancing.
The market is also segmented by technology, with 2D and 3D films being the main options. The 3D segment is expected to hold a significant share of 46.2% in 2024. With advances in polarized 3D and digital projection technology, drive-in theaters are able to deliver enhanced viewing experiences. These innovations, combined with consumer interest in premium entertainment, are driving the growing demand for 3D screenings at drive-ins.
North America holds a dominant share in the drive-in movie theater market, contributing 22.9% of the total revenue in 2024, or USD 1.2 billion. This region is witnessing a revival of drive-in theaters, with cultural and technological factors playing a key role in their ongoing success. The rising disposable income and preference for outdoor entertainment experiences are contributing to market growth.
Table of Contents
Chapter 1 Methodology & Scope
- 1.1 Research design
- 1.1.1 Research approach
- 1.1.2 Data collection methods
- 1.2 Base estimates and calculations
- 1.2.1 Base year calculation
- 1.2.2 Key trends for market estimates
- 1.3 Forecast model
- 1.4 Primary research & validation
- 1.4.1 Primary sources
- 1.4.2 Data mining sources
- 1.5 Market definitions
Chapter 2 Executive Summary
- 2.1 Industry synopsis, 2021 - 2034
Chapter 3 Industry Insights
- 3.1 Industry ecosystem analysis
- 3.2 Supplier landscape
- 3.3 Pricing analysis
- 3.4 Technology & innovation landscape
- 3.5 Key news & initiatives
- 3.6 Regulatory landscape
- 3.7 Manufacturers
- 3.8 Distributors
- 3.9 Impact forces
- 3.9.1 Growth drivers
- 3.9.1.1 Incorporation of advanced technologies and enhancement of drive-through areas
- 3.9.1.2 Wide usage of restaurant parking lots for drive-in movie theatres
- 3.9.1.3 Rising consumer spending as well as digitization in the entertainment industry
- 3.9.2 Industry pitfalls & challenges
- 3.9.2.1 Seasonal nature and weather dependence
- 3.9.2.2 High initial setup costs
- 3.9.1 Growth drivers
- 3.10 Growth potential analysis
- 3.11 Consumer buying behavior
- 3.12 Porter's analysis
- 3.13 PESTEL analysis
Chapter 4 Competitive Landscape, 2024
- 4.1 Introduction
- 4.2 Company market share analysis
- 4.3 Competitive positioning matrix
- 4.4 Strategic outlook matrix
Chapter 5 Market Estimates & Forecast, By Screen Size, 2021 - 2034 ($Bn)
- 5.1 Key trends
- 5.2 Up to 20 ft
- 5.3 20-50 ft
- 5.4 Above 50 ft
Chapter 6 Market Estimates & Forecast, By Area, 2021 - 2034 ($Bn)
- 6.1 Key trends
- 6.2 Small scale
- 6.3 Large scale
Chapter 7 Market Estimates & Forecast, By Technology, 2021 - 2034 ($Bn)
- 7.1 Key trends
- 7.2 2D
- 7.3 3D
Chapter 8 Market Estimates & Forecast, By Price, 2021 - 2034 ($Bn
- 8.1 Key trends
- 8.2 Low
- 8.3 Medium
- 8.4 High
Chapter 9 Market Estimates & Forecast, By Application, 2021 - 2034 ($Bn)
- 9.1 Key trends
- 9.2 Restaurant parking lots
- 9.3 Theater parking lots
Chapter 10 Market Estimates & Forecast, By Region, 2021 - 2034 ($Bn)
- 10.1 Key trends
- 10.2 North America
- 10.2.1 The U.S.
- 10.2.2 Canada
- 10.3 Europe
- 10.3.1 UK
- 10.3.2 Germany
- 10.3.3 France
- 10.3.4 Italy
- 10.3.5 Spain
- 10.3.6 Russia
- 10.3.7 Nordics
- 10.4 Asia Pacific
- 10.4.1 China
- 10.4.2 India
- 10.4.3 Japan
- 10.4.4 Australia
- 10.4.5 South Korea
- 10.4.6 Southeast Asia
- 10.5 Latin America
- 10.5.1 Brazil
- 10.5.2 Mexico
- 10.5.3 Argentina
- 10.6 MAMEA
- 10.6.1 UAE
- 10.6.2 South Africa
- 10.6.3 Saudi Arabia
Chapter 11 Company Profiles
- 11.1 Capri Drive-In
- 11.2 Coyote Drive-In and Canteen
- 11.3 Delsea Drive-In
- 11.4 Field of Dreams Drive-In
- 11.5 Galaxy Drive-In
- 11.6 Hull's Drive-In
- 11.7 Malco Theatres
- 11.8 Mesa Drive-In
- 11.9 Shankweiler's Drive-In
- 11.10 South Bay Drive-In
- 11.11 Star Drive-In
- 11.12 Starlight Cinemas
- 11.13 Sunset Cinema Club
- 11.14 Van Buren Drive-In
- 11.15 Wellfleet Drive-In
 2025-2029年全球電影市場
 電影院市場規模、佔有率和成長分析(按類型、劇院類型、螢幕尺寸、螢幕類型、應用程式和地區)- 2025-2032 年產業預測
 電影院市場機會、成長動力、產業趨勢分析與 2025 - 2034 年預測
 電影院市場報告:至2030年的趨勢、預測與競爭分析
 電影院市場:按類型、螢幕類型、票價、地區、範圍和預測,2024-2031 年音樂廳和劇院市場規模- 按類型(音樂廳、歌劇院、劇院)、按節目安排和活動(古典音樂音樂會、歌劇表演、戲劇製作、現場活動和表演)、按活動頻率和預測,2024 - 2032 年電影院市場規模 - 按類型、螢幕和用途分類 - 區域前景、競爭策略和細分市場預測(截至 2033 年)全球電影院市場研究報告 - 2024 年至 2032 年產業分析、規模、佔有率、成長、趨勢和預測
 2023-2030 年全球汽車劇院市場規模研究與預測(按螢幕尺寸、面積、技術、應用和區域分析)
 2023-2030 年按螢幕尺寸、區域、技術、應用和地區分析的全球電影院驅動市場規模研究與預測